

Skip to content

Pricing

Every tool. Four plans.

Start free on delayed data. Upgrade for real-time flow, strategy tools and EZPZ AI.

  • 127 tools
  • 4 plans
  • 138 written guides
  • Finn for TradingView

Plans

  1. Free

    Starter

    Look around on delayed data, no card needed

    $0/mo

    No card needed

    31 tools live +69 delayed

    Includes:

    • Delayed options flow, dark pool and scanners (15 to 30 minutes behind)
    • Fundamentals, analyst estimates, Congress trades and calendars
    • Finn for TradingView with your own AI key
    • 5 free EZRA questions a day
  2. Pro

    Real-time data

    Real-time flow for active options traders

    $69 Monthly price $69$54.5 /mo

    Billed monthly Billed $650 a year · Save 21%

    7-day free trial · first trial only

    109 tools live +6 delayed

    Everything in Free, plus:

    • Real-time options flow, including SPX, SPY, $1M+ and 0DTE
    • Dark pool flow and analytics
    • GEX and DEX, IV rank, max pain, Ticker Explorer and the 3D volatility surface
    • AiPe, the AI analyst on every tool page
    • Finn gets live flow, scanner and dark pool data
    • Trading Discord, video tutorials and recorded live sessions

    Priority support

    See it in action on Pro
  3. Elite

    EZPZ AI

    EZPZ AI: research, chart work and voice, built in

    $195 Monthly price $195$149.5 /mo

    Billed monthly Billed $1795 a year · Save 23%

    7-day free trial · first trial only

    127 tools live

    Everything in Premium, plus:

    • EZRA, the AI research analyst (Intraday, Swing and Investing modes, file attachments, shareable chats)
    • Finn runs on EZPZ AI: no API key needed
    • Finn's Elite tools: setup analysis drawn on your chart, regimes, Greeks, news
    • EZPZ AI & Data included in Vox (Vox plan sold separately)
    • Theta Performance

    VIP dedicated support

    See it in action on Elite
  • Cancel anytime
  • Secure checkout with Stripe
  • Real-time data needs a one-time OPRA agreement

Finn · AI TradingView Connector

Talk to your TradingView chart

90 chart controls on every plan with your own AI key. Your plan unlocks EZPZ data, and Elite runs Finn on EZPZ AI with no key.

Elite runs Finn on EZPZ AI, so no API key is needed, and adds setup analysis drawn on your chart, regimes, Greeks and news. Shown on QQQ.

QQQ15 Sample data
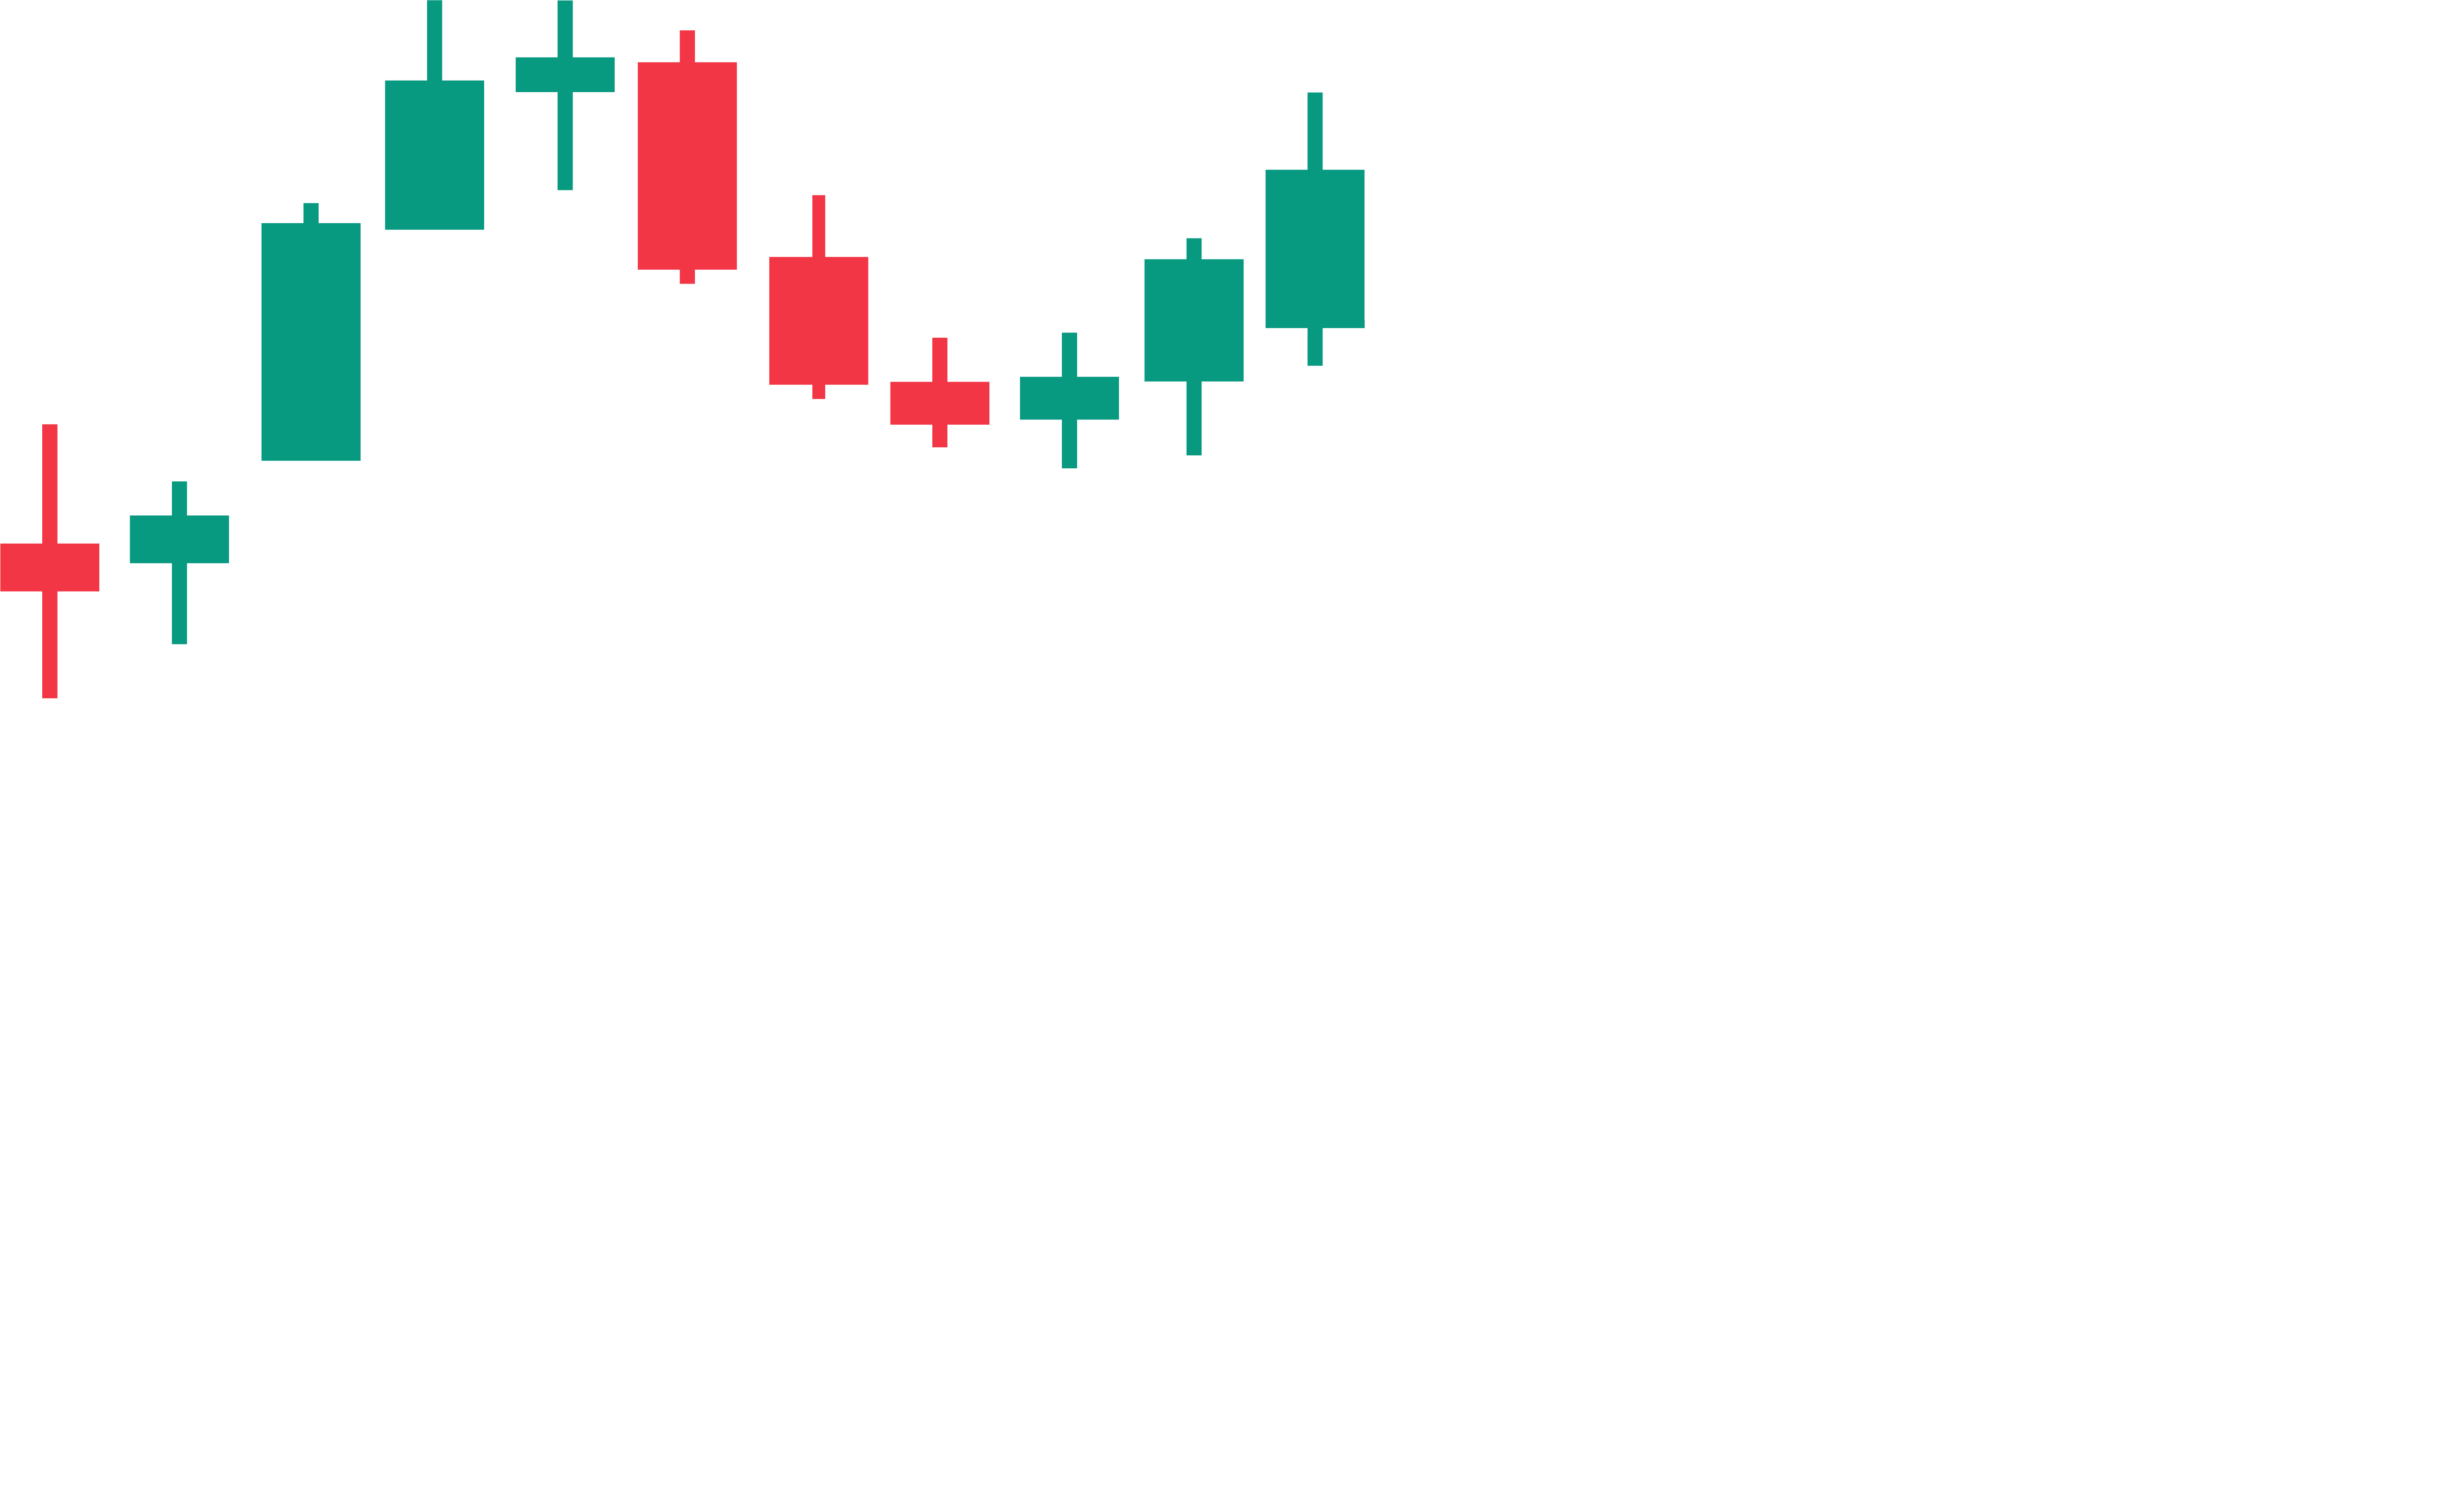
473.00474.00475.00476.00477.00478.00479.00480.00S/R (3x) · 480.00480.00S/R (2x) · 472.60472.60Trigger · 476.40476.40Invalidation · 474.10474.10475.30

Analyze QQQ's intraday setup and mark up the chart

EZPZ AITrading Assistant
Calling analyze_and_draw_intraday_trade_plan…

Bias leans long above the trigger. Trigger and invalidation are on the chart, with 2 confirmations and 1 conflict to watch.

Vox is a TradingVox plan. Elite includes EZPZ AI & Data in Vox. About Vox

  • Needs TradingView Desktop open on your computer
  • Finn draws, reads and sets alerts. It never places trades.
  • Anything destructive waits for your click

For TradingView Desktop on macOS, Windows and Linux. Sample data

Vox · Voice

Talk to your chart

Elite includes EZPZ AI & Data in Vox.

Add a Vox plan from $49/mo and skip the +$100 add-on.

Vox from $49/mo · EZPZ AI & Data included with Elite (+$100/mo otherwise)

Vox Finn Your TradingView
Vox routes each question to the real source: EZPZ data, EZRA, or your TradingView through Finn.

54 voice tools

Illustrative

Trading Desk: A trading-desk partner that reads the market with you and calls out what matters.

Mentor: A mentor that teaches as you trade: levels, Fibonacci, GEX, and why.

YouWhat's the read on QQQ for the open?

Vox · Trading DeskBias long above the opening range. Trigger on a reclaim of 476.40, invalidation below 474.10. Target the 480 wall.

YouWhat's the read on QQQ for the open?

Vox · MentorQQQ is holding above its opening range, and the gamma wall at 480 is the level that matters. I've drawn it so you can see why.

Tap a question below to hear Vox's real voice. We never use your microphone.

Hear Vox answer · recorded samples, sound on

  • “What's SPY doing right now?” Up about four tenths of a percent, trading a little above its opening range. Nothing dramatic — just steady buying since the open.
  • “Any unusual flow on NVDA?” Okay, this one's actually interesting — unusual call buying at the near-the-money strikes. Net premium flipped bullish twenty minutes ago, and it's building.
  • “What's the market regime today?” We're in a bullish swing regime right now. Score's in the upper third of the range, so there's still room for this trend to run.
  • “How's my watchlist looking?” Mostly green today — three of your five names are up, led by NVDA, which is having a genuinely strong session.
  • Two modes: Mentor teaches, Trading Desk reads the market like a desk partner
  • Drives your TradingView Desktop through Finn
  • Plain-English answers, never a wall of numbers
Try Vox free 3-minute demo, no account See Vox plans

Vox is a TradingVox plan, billed by TradingVox. Link your EZPZ account in TradingVox settings. Never places trades. Not financial advice.

Every tool

Slide to see what each plan unlocks

All 127 EZPZ tools across 8 categories. Live tools run on real-time data, delayed tools are the free copy that runs 15 to 30 minutes behind, and a lock means a higher plan.

Pro: 109 tools live, 6 delayed

  • Live
  • Delayed, 15 to 30 min
  • Higher plan
See the Pro plan

Options Analytics 27/32 live

Strategies 13/18 live

Stocks 13/16 live

Dark Pool 16/18 live

Investing & Calendars 23/23 live

Click any tool to read its guide. Delayed tools are free to use on any plan.

AI built in

AI that works on EZPZ data

EZRA answers research questions, AiPe explains the page you are on, and regime scores rank symbols for you. Each one comes with a different plan.

EZRA

AI research analyst

Elite

Ask about any ticker in plain words. EZRA pulls EZPZ flow, dark pool, gamma, regime and fundamentals and answers with charts and tables.

  • Intraday, Swing and Investing modes
  • Up to 5 attachments per message
  • Shareable chats
Illustrative

Question: What's the setup on NVDA for a swing trade?

EZRA answers with a trade setup card:
BULLISH NVDA Swing setup
Entry
182.40
Stop
176.90
Targets
189.50 194.00
Try 5 free questions a day

AiPe

On-page AI analyst

Pro and up

An AI analyst on 100+ tool pages that reads the page you're on and answers about it.

  • Click Ask AiPe on a tool page
  • Answers about the data on your screen
  • Included with Pro and up
Illustrative

On page: Gamma Exposure (GEX), SPY

Question: What stands out on this page?

AiPe answers: The largest positive gamma sits at the 450 strike, and gamma turns negative below 441. Those are the two levels this page is pointing at.

Regime scores

Regime leaderboards

Premium

Scores that sort the market by regime, so you can see which names are set up for the way you trade.

  • Intraday: about 100 liquid symbols, scored every 5 minutes in market hours
  • Swing: -100 to +100 for 5 to 30 day setups, updated hourly
  • Investing: a fundamental score across 7 categories
Swing regime leaderboard Illustrative
  1. NVDA+78
  2. MSFT+52
  3. AAPL+21
  4. TSLA-34
  5. XOM-61

Research tools, not advisers. They can be wrong.

Compare

Every feature, plan by plan

Delayed means the tool works on data 15 to 30 minutes behind the market. Each plan includes everything in the one before it.

Features included in each plan
Feature Free $0/mo Choose Free Pro $69$54.5/mo Choose Pro Premium $125$99.5/mo Choose Premium Elite $195$149.5/mo Choose Elite
EZPZ AI & Finn Research tools, not advisers. They can be wrong.
EZRA, the AI research analyst Free demo: 5 questions a day on delayed dataNot includedNot includedNot includedIncluded
AiPe on tool pages Ask about the data on the page you are onNot includedIncludedIncludedIncluded
EZPZ Finn download and 90 chart tools with your own AI key For TradingView Desktop on macOS, Windows and LinuxIncludedIncludedIncludedIncluded
Finn with built-in EZPZ AI, no key neededNot includedNot includedNot includedIncluded
Finn with EZPZ data: flow, scanner and dark poolNot includedIncludedIncludedIncluded
Finn with Trader's FieldMap levelsNot includedNot includedIncludedIncluded
Finn's Elite tools: setup analysis, regimes, Greeks and newsNot includedNot includedNot includedIncluded
EZPZ AI usage credit top-ups Buy more EZPZ AI usage when you need itNot includedNot includedNot includedIncluded
EZPZ AI & Data in Vox Vox plan sold separately, billed by TradingVoxNot includedNot includedNot includedIncluded
AI Portfolio Analysis An AI review of your own tradesNot includedNot includedIncludedIncluded
Options Flow The options tape as it prints: live flow, unusual activity and alerts.
Unusual Options Activity Spot the large, sweep, and block options trades that stand out from ordinary flow.DelayedIncludedIncludedIncluded
Live Flow See the options activity behind the names you already watch.Not includedIncludedIncludedIncluded
SPX & SPY Flow Live options tape locked to SPX, SPXW, and SPY, so you can watch how the S&P 500 is being positioned.Not includedIncludedIncludedIncluded
$1M Plus Flow Live options prints that already clear a million dollars of premium, with a floor you cannot lower.Not includedIncludedIncludedIncluded
0DTE Flow Live options prints that expire today, with DTE already locked so you are not mixing in weeklies and monthlies.Not includedIncludedIncludedIncluded
Option Chain The full list of available call and put contracts for a ticker across every strike and expiration, the basic building block behind every other options tool.Not includedIncludedIncludedIncluded
Unusual Activity Intraday Watch large, sweep, and block options trades as the session develops, with date and total value filters.DelayedIncludedIncludedIncluded
EZPZ Trade Alerts A live feed of notable options and stock activity worth knowing about the moment it happens, instead of discovering it after the fact.DelayedIncludedIncludedIncluded
Trader's FieldMap A one-ticker support and resistance ladder you can copy into TradingView as EZPZ FieldMap Levels.DelayedDelayedIncludedIncluded
Options Analytics Gamma, open interest, volatility and max pain, by strike and by expiration.
Gamma Exposure (GEX) A market wide measure of how much options dealers may need to buy or sell stock as prices move, and why it can make markets calmer or more volatile.Not includedIncludedIncludedIncluded
Max Pain The strike price where option buyers, as a group, would lose the most money at expiration, and why some traders watch it going into expiry.DelayedIncludedIncludedIncluded
IV Rank Explorer Where a stock's current implied volatility sits relative to its own history, used to judge whether options look cheap or expensive right now.DelayedIncludedIncludedIncluded
Put to Call Ratio A simple sentiment gauge comparing how much put volume is trading against call volume, and why extremes in either direction get watched closely.DelayedIncludedIncludedIncluded
Market Maker Exposure A broader read on how exposed options dealers are across the whole book, combining delta, gamma, and other greeks rather than looking at gamma alone.Not includedNot includedIncludedIncluded
Market Cross Flow A side by side view of options order flow across many tickers at once, built to show where money is rotating rather than just what one name is doing.Not includedNot includedIncludedIncluded
Greeks Heatmap A strike by expiration grid showing where a chosen greek is concentrated across the whole options chain, at a glance.Not includedNot includedIncludedIncluded
Option Depth Flow A strike by time chart of dealer exposure for one ticker, with candles on the same session.Not includedNot includedIncludedIncluded
GEX Heatmap Gamma exposure broken out across both strike and expiration at once, instead of collapsed into a single profile.Not includedNot includedIncludedIncluded
GEX and DEX Gamma exposure and delta exposure shown side by side, pairing a read on hedging intensity with a read on directional positioning.DelayedIncludedIncludedIncluded
Spot Gamma and Delta Gamma and delta exposure narrowed to the strikes closest to the current stock price, where hedging impact tends to matter most right now.DelayedIncludedIncludedIncluded
Expected Move The range the options market is pricing in for a stock by a given date, derived directly from options premiums rather than a guess.DelayedIncludedIncludedIncluded
Open Interest Scan A screen for where open interest is building or unwinding fastest across the chain, used to spot new positioning as it happens.DelayedIncludedIncludedIncluded
Volume Scan A ranked view of where options volume is heaviest right now, used to quickly find the contracts and tickers seeing the most action.DelayedIncludedIncludedIncluded
Greeks The core set of risk measures for an options contract, showing how its price is expected to react to changes in the stock, time, and volatility.DelayedIncludedIncludedIncluded
Volatility Analysis OI, IV Smile, and IV×OI by strike for one ticker, plus VIX and the S&P 500 Skew Index under the smile.DelayedIncludedIncludedIncluded
Historical Volatility How much a stock has actually moved in the past, measured directly from its own price history rather than from options prices.DelayedIncludedIncludedIncluded
Volatility Surface 3D A three dimensional map of implied volatility across every strike and expiration at once, showing skew and term structure together.Not includedIncludedIncludedIncluded
EZPZ Picks A bullish and bearish ticker leaderboard of options premium, with Current Day and Historical (Weekly) views.DelayedIncludedIncludedIncluded
Index Trader A dashboard focused specifically on options flow and sentiment in the major index products like SPY, QQQ, and SPX.DelayedIncludedIncludedIncluded
Top 20 Optionable A ranked list of the most actively traded optionable stocks, useful for finding where liquidity and options interest are concentrated.DelayedIncludedIncludedIncluded
Market Wave A cumulative view of options flow across the market, built to show whether buying or selling pressure has been building over the course of a session.DelayedIncludedIncludedIncluded
Movers and Shakers Tide Watch Net Call Premium versus Net Put Premium for about 18 mega-cap names, plotted next to SPY.DelayedIncludedIncludedIncluded
Net Flow Graph A chart of net bullish versus bearish options premium for a specific ticker, making shifts in options positioning easy to see at a glance.DelayedIncludedIncludedIncluded
Historical Net Premium A longer term view of net options premium flow, useful for spotting positioning trends that build up over weeks rather than a single session.DelayedIncludedIncludedIncluded
0DTE Graph A flow chart focused specifically on options expiring the same day, the fastest moving and most actively traded corner of the options market.DelayedIncludedIncludedIncluded
Weekly-DTE Graph A flow chart focused on options expiring within the current week, a step further out than same day contracts but still short dated.DelayedIncludedIncludedIncluded
7-DTE Graph A flow chart focused on options with roughly a week left until expiration, tracking positioning in that specific short term window.DelayedIncludedIncludedIncluded
Supply and Demand X-ray A visual map of where options open interest is concentrated by strike, used as a rough guide to potential support and resistance levels.DelayedIncludedIncludedIncluded
Money Sentiment Bought Ratio, Net Sentiment, and Netflow Graph for one ticker, with Current Day, Previous Hour, and Previous 15 min.DelayedIncludedIncludedIncluded
Net Premium Heatmap Strike-by-expiration Net Premium for one ticker, with Daily Heatmap and Weekly Heatmap.DelayedIncludedIncludedIncluded
Ticker Explorer A single, consolidated view of a ticker's options data, pulling flow, open interest, and key metrics together instead of checking each tool separately.Not includedIncludedIncludedIncluded
Strategies Scanners and screens built around one way of trading.
Theta Farming A premium selling approach built around collecting an option's time decay, and the tradeoffs that come with it.DelayedDelayedIncludedIncluded
Theta Performance A mark-to-market track of short-dated premium selling structures on one ticker, with the payoff at expiration.Not includedNot includedNot includedIncluded
Custom Strategies A builder for constructing your own multi leg options positions and seeing the payoff, breakeven, and risk before you place the trade.Not includedNot includedIncludedIncluded
Volatility Risk Premium (VRP) The gap between the volatility options imply and the volatility a stock then shows.Not includedNot includedIncludedIncluded
Directional Options Pressure A read on whether options order flow in a name currently leans toward bullish or bearish positioning, built from aggregating trade level buying and selling pressure.DelayedDelayedIncludedIncluded
Greek Gods Dashboard An intraday SPY or SPX view of Ares, Hermes, Apollo, and Zeus stacked under Price, Intraday Candlestick.DelayedIncludedIncludedIncluded
Contract Prices (XVWAP) Volume weighted average price applied to an individual options contract, giving traders an intraday reference point similar to how VWAP is used on stocks.DelayedIncludedIncludedIncluded
Gamma Short Squeeze A setup where dealer gamma hedging and short seller covering can reinforce each other, amplifying a move in a stock beyond what either force would produce on its own.DelayedIncludedIncludedIncluded
Relative Strength (RS) Ranking A table that ranks stocks by how their 1, 3, 6, and 12 month performance compares with SPY, in the style William O'Neil popularized.DelayedIncludedIncludedIncluded
Trend Trading Strategy A member guide to the math behind risk, reward, ATR stops, and market regime, built on a fixed 1:2 stop to target ratio.IncludedIncludedIncludedIncluded
WarriorTrading Setup A live day trading scanner for stocks priced $2 to $30 that gap up 10% or more on unusual volume, with news and dark pool context beside each name.DelayedIncludedIncludedIncluded
Stocks Outperforming A screener for stocks beating the broader market across multiple lookback periods, a simple way to see where relative strength is showing up.DelayedIncludedIncludedIncluded
Weighted Alpha A live leaderboard of the highest Weighted Alpha momentum scores, with price, volume and 52 week context beside each reading.DelayedIncludedIncludedIncluded
Historical Weighted Alpha One ticker's Weighted Alpha score charted day by day next to price, with a daily table of trailing returns from one week to one year.DelayedIncludedIncludedIncluded
Volatility Deviations A live scanner that ranks stocks by how unusual today's price move is for each stock, with an Up tab and a Down tab.DelayedIncludedIncludedIncluded
Retail Trend Navigator Three stacked charts for one ticker, each with a Short MA, a Long MA and BUY and SELL crossover labels, so you can see whether the trend agrees across timeframes.DelayedIncludedIncludedIncluded
Market Trend Signals A scanner that labels each stock Buy, Sell, Retracement, Hold or Neutral, with short, medium and long term trend reads beside the price.DelayedIncludedIncludedIncluded
Peter Lynch Fundamental Screener A growth at a reasonable price screen that keeps stocks passing six fixed fundamental cutoffs and shows their trend and volume beside them.Not includedIncludedIncludedIncluded
Stocks Scanners, regime scores and analytics for individual stocks.
Market Dashboard A single screen that pulls together index levels, market breadth, a sector heat map, and Market Direction lights driven by options premium.Not includedIncludedIncludedIncluded
Volume Leaderboard A ranked table of stocks by today's volume, with relative volume and dark pool share beside it, so you can see which names are unusually busy.DelayedIncludedIncludedIncluded
Top Gainers and Losers Two tabs that rank stocks by percent change from the prior close, the biggest gainers on one and the biggest losers on the other.DelayedIncludedIncludedIncluded
Gap Up and Down Two tabs that rank stocks by the opening gap from the prior close, the biggest gap ups on one and the biggest gap downs on the other.DelayedIncludedIncludedIncluded
Extended Hours Leaders Two tabs of stocks moving before the open and after the close, with the percent move, the gap, and how much actually traded.DelayedIncludedIncludedIncluded
Range Change Leaders Two tabs that rank stocks by how far they have moved since today's open, the biggest advances on one and the biggest declines on the other.DelayedIncludedIncludedIncluded
Intraday Regime Leaderboard A -100 to +100 Bullish, Neutral, or Bearish score for high-liquidity symbols, with a ticker page that shows what sits beside one symbol's score.Not includedNot includedIncludedIncluded
Swing Regime Leaderboard A -100 to +100 score and five-label regime for multi-day setups, with a ticker page that shows what sits behind one symbol's score.Not includedNot includedIncludedIncluded
Investing Regime Leaderboard A 0 to 100 score and four zones for stocks you might hold for weeks to months, with Entry and Size labels and a ticker page that shows what sits behind one symbol's score.Not includedNot includedIncludedIncluded
Technical Analysis Oscillator, moving average, and summary gauges for one symbol on any timeframe, with every indicator's value and signal listed below.DelayedIncludedIncludedIncluded
Top-50 Aggregate Technicals One technical indicator at a time for the fifty largest stocks by market cap, plotted as a scatter, plus market cap trend and SPY arbitrage charts.DelayedIncludedIncludedIncluded
Predictive CandleScope A model's 24-hour price range for a ticker. A model output, not a forecast to rely on.IncludedIncludedIncludedIncluded
Volume Surge Trades Today's largest S&P 500 trade imbalance: buy versus sell dollars, dark pool versus lit exchange, by sector and by stock.DelayedIncludedIncludedIncluded
Top Money Flow A ranked table of the stocks with the most dollars traded today, with price change and dark pool share beside each name.DelayedIncludedIncludedIncluded
Market Price Action Trend Two stacked trend charts that show the broad market and one ticker, each with a green or red EMA ribbon and EMA Cross labels.DelayedIncludedIncludedIncluded
Seasonal Returns A year by month heatmap of a ticker's percentage returns, with an Average row, a Yearly column, and a Summary grid of hit rates and extremes.DelayedIncludedIncludedIncluded
Dark Pool Off-exchange prints, the levels they cluster at and what they can and cannot tell you.
Dark Pool Flow Large trades executed away from public exchanges, and what they can and cannot tell you about institutional activity.Not includedIncludedIncludedIncluded
SPY Flow A dedicated feed of dark pool prints in SPY, the most heavily traded ETF in the market, isolated from every other ticker's flow.Not includedIncludedIncludedIncluded
$1M+ Premium Dark Pool Flow Dark pool prints filtered down to only the trades carrying at least a million dollars of notional value, cutting out the smaller, more routine prints.Not includedIncludedIncludedIncluded
$1M+ DP Volume Flow Off-exchange prints where dark pool volume already clears one million dollars, even when snapshot premium is smaller.Not includedIncludedIncludedIncluded
Dark Pool Index (DIX) A market wide DIX percent of dark pool volume labeled as buy-side, with Latest DIX, averages, and a 45% NEUTRAL chart line.DelayedDelayedIncludedIncluded
Largest Dark Pool By Ticker A leaderboard ranking every ticker by how much off exchange volume it has traded, so you can see where dark pool activity is concentrated market wide.DelayedIncludedIncludedIncluded
Largest Single Dark Pool Trades The single biggest individual dark pool prints of the day, ranked from largest to smallest regardless of ticker.DelayedIncludedIncludedIncluded
Dark Pool Sectors Off exchange volume rolled up by sector, showing which corners of the market are seeing the most dark pool activity.DelayedIncludedIncludedIncluded
Dark Pool Top Levels The specific price levels where a stock's dark pool volume has clustered, built by stacking individual prints on top of each other.DelayedIncludedIncludedIncluded
Daily Dark Pool Amount A per-ticker chart of daily off-exchange Amount (M) versus Price, loaded with Filter ticker and Go.DelayedIncludedIncludedIncluded
Dark Pool Movers and Shakers A session chart of SPY Price against running dark pool Buy Amount and Sell Amount.DelayedIncludedIncludedIncluded
Dark Pool Indicator (DPI) A market wide DPI ratio of dark pool volume intensity versus its recent average, with Latest DPI, averages, and a 1.0 neutral chart line.DelayedDelayedIncludedIncluded
Dark Pool Net Flow A per-ticker session chart of labeled Buy Amount versus Sell Amount, plus Volume bars by Time.DelayedIncludedIncludedIncluded
Dark Pool Sentiment A per-ticker chart of Cumulative Net Amount (M) by Date, with green bars above zero and red bars below zero.DelayedIncludedIncludedIncluded
Block Trades Sentiment A per-ticker daily chart of Buy Premium (M) versus Sell Premium (M), plus Buy Volume (M) versus Sell Volume (M).DelayedIncludedIncludedIncluded
Bullish Dark Pool Net Premium A leaderboard of tickers with the largest estimated net buying pressure in their off exchange volume, ranked from most bullish on down.DelayedIncludedIncludedIncluded
Bearish Dark Pool Net Premium A leaderboard of tickers with the largest estimated net selling pressure in their off exchange volume, ranked from most bearish on down.DelayedIncludedIncludedIncluded
DarkVol Leaders Stocks ranked by how large a share of their total volume is trading off exchange, rather than by raw dark pool dollar totals.DelayedIncludedIncludedIncluded
Shorts Short interest, short volume and squeeze screens.
Short Interest How many shares of a stock are currently sold short, and why it matters for both risk and potential squeezes.DelayedIncludedIncludedIncluded
ShortEx A short squeeze focused view that combines short interest, days to cover, and other pressure indicators into one place.DelayedDelayedIncludedIncluded
Short Volume The share of a stock's daily trading volume executed as short sales, reported separately from official short interest.IncludedIncludedIncludedIncluded
Short Volume Trends A chart of how a stock's daily short volume percentage has moved over time, making shifts in short selling activity easier to spot.IncludedIncludedIncludedIncluded
Exchange Volume Leaderboard A ranked view of stocks by how much of their trading volume executes away from the public exchanges rather than on them.IncludedIncludedIncludedIncluded
Exchange Volume A per stock breakdown of where trading volume is actually executing across individual exchanges and off exchange venues.IncludedIncludedIncludedIncluded
Short Interest Leaderboard A ranked view of stocks by short interest, useful for scanning the market for heavily shorted names rather than checking one ticker at a time.DelayedIncludedIncludedIncluded
Investing & Calendars Fundamentals, estimates, disclosures and the calendars around them.
Ticker Performance One stock at a glance: price returns, SMA and EMA moving averages, and 1 month to 52 week highs and lows on one screen.IncludedIncludedIncludedIncluded
Recommendation Trends How many Wall Street analysts rate a stock Strong Buy, Buy, Hold, Sell, or Strong Sell, tracked month by month.IncludedIncludedIncludedIncluded
Upgrade and Downgrade A running log of when research firms change or restate their rating on one stock, with the date, the action, and the From and To ratings.IncludedIncludedIncludedIncluded
Social Sentiment How the retail conversation about one stock leans, with positive, negative and neutral mention counts, average scores, and a score chart over time.IncludedIncludedIncludedIncluded
Congressional Trading Stock trades made by members of Congress, made public because federal law requires them to disclose it.IncludedIncludedIncludedIncluded
Price Target Where Wall Street analysts expect a stock's price to go, summarized as a High, Low, Mean, and Median across the analysts covering it.IncludedIncludedIncludedIncluded
Support and Resistance Price levels where a stock has historically had trouble breaking through, used by traders to anticipate where buying or selling pressure might show up next.IncludedIncludedIncludedIncluded
Earnings Surprises Whether a company beat or missed analyst EPS estimates each quarter, with year totals, a trend chart and a quarter by quarter table for one ticker.IncludedIncludedIncludedIncluded
Sector Metrics Financial metrics for a whole sector, each shown as an Actual reading beside its Median, so you can judge one company against a group.IncludedIncludedIncludedIncluded
Market News A newest-first list of general financial headlines with category, local time, publisher, summary, and a link to the full story.IncludedIncludedIncludedIncluded
Company Profile One table of identifying facts for a ticker: description, listing, size, industry classification, ownership readings, and NAICS codes.IncludedIncludedIncludedIncluded
Company News A table of recent headlines for one ticker, with category, local time, publisher, summary, related tickers, and a link to the full story.IncludedIncludedIncludedIncluded
Financial Statements Revenue, profit, debt, cash and 22 ratio columns for one ticker, by year or by quarter, with four charts of the latest ten periods.IncludedIncludedIncludedIncluded
Basic Financials One ticker's fundamentals on a single page: seven headline cards plus eight tables covering returns, valuation, profitability, growth, financial health, per share data, dividends, and efficiency.IncludedIncludedIncludedIncluded
Historical Market Cap One line that shows how a company's total market value has changed across any date range you choose.IncludedIncludedIncludedIncluded
Dividends Every dividend a company has paid or declared, with declaration, record and pay dates, amount and split adjusted amount, for one ticker.IncludedIncludedIncludedIncluded
Analyst Estimates What analysts collectively expect a company to report for revenue, EPS, EBITDA, and EBIT, with the high and low forecasts and how many analysts sit behind each period.IncludedIncludedIncludedIncluded
Economic Calendar A live list of scheduled economic releases by country, with each result beside its forecast and prior reading.IncludedIncludedIncludedIncluded
Earnings Calendar A weekday by weekday schedule of which public companies report quarterly results, with report timing and analyst estimates.IncludedIncludedIncludedIncluded
IPO Calendar A month by month table of filed and priced IPOs with date, exchange, share count, price, status, and total offering size.IncludedIncludedIncludedIncluded
FDA Calendar A schedule of upcoming FDA decision dates for drugs and treatments in development, which can move biotech and pharma stocks sharply.IncludedIncludedIncludedIncluded
Market Holidays The full year schedule of days U.S. markets are closed or close early, useful for planning around gaps in liquidity.IncludedIncludedIncludedIncluded
Schedule EZPZ's calendar of upcoming live sessions and events, shown in your own time zone, so you know when to show up.IncludedIncludedIncludedIncluded
AI & Indicators EZRA, AiPe, EZPZ Finn and the TradingView indicators.
EZPZ TradingView Indicators Custom Pine Script tools for your own TradingView chart, sorted into five category pages with a details page for each indicator.IncludedIncludedIncludedIncluded
EZRA (AI Research Analyst) EZRA is EZPZ's AI research analyst: ask about any ticker or the market in plain words and get a written answer with charts and tables built on EZPZ data.Not includedNot includedNot includedIncluded
AiPe Assistant AiPe is the AI analyst built into EZPZ chart and data pages. Click Ask AiPe in the bottom right corner and ask about the exact data on your screen.Not includedIncludedIncludedIncluded
AI TradingView Connector EZPZ Finn is a free desktop app that connects TradingView Desktop to AI, so you can control your chart in plain English and pull EZPZ market data beside it.IncludedIncludedIncludedIncluded
Community & support
Trading Discord Live trading sessions, workshops and strategy channelsNot includedIncludedIncludedIncluded
Video tutorials and recorded live tradingNot includedIncludedIncludedIncluded
Learn Center guides 138 guides, free to readIncludedIncludedIncludedIncluded
Help desk tickets For every signed-in memberIncludedIncludedIncludedIncluded
Support levelHelp deskPriority supportDedicated supportVIP dedicated support
Free trial First paid plan only—7 days7 days7 days

Ways to save

Pay less for the same tools

  • Annual billing

    Pay once a year and save up to 23% compared with paying monthly.

    See annual prices
  • Free trials

    Free trials are for your first paid plan only: 7 days on Pro, Premium and Elite. Cancel before the trial ends and you are not charged.

  • Retail Trader Grant

    One free month of a paid plan for approved applicants.

    Apply for the grant
  • Partner program

    Share EZPZ with other traders and earn a commission when they subscribe.

    Become a partner

Good to know

  • Real-time data on paid plans

    Pro and up get real-time options (OPRA) and stock data. Free shows delayed data: at least 15 minutes behind, and some pages show the prior session.

  • Learn Center

    138 guides explain how each tool is built and how to read it. Free to read.

  • Trading Discord

    Pro and up join the trading Discord: live trading sessions, workshops and recorded sessions.

  • Billing by Stripe

    Checkout and billing run on Stripe. Change or cancel your plan any time from your account.

  • Two-factor sign-in

    Protect your account with two-factor sign-in from an authenticator app.

Questions

Pricing questions, answered

Choosing

Which plan should I pick?

Start on Free to look around on delayed data. Pick Pro if you want options flow and dark pool data as it happens. Premium adds the strategy tools: Trader's FieldMap, Theta Farming, the custom strategy builder and the regime leaderboards. Elite adds EZPZ AI: the EZRA research analyst and the built-in AI in EZPZ Finn. You can change plans later.

What do I get on the Free plan?

Delayed options flow, dark pool and scanners, plus fundamentals, analyst estimates, Congress trades and calendars, Finn with your own AI key and 5 free EZRA questions a day. No card needed.

Is EZPZ a broker?

No. EZPZ Trading is a data and research platform. It does not place trades or hold funds, and nothing on it is investment advice.

Data

What is the difference between delayed and real-time data?

FREE (delayed data) pages run at least 15 minutes behind, the public flow feed about 30 minutes, and some pages show the prior session. Real-time data is part of the paid plans.

Why do I sign a market-data agreement?

Real-time options data comes from OPRA, the options exchanges' data feed. Before it opens, every member signs the OPRA subscriber agreement and says whether they are a non-professional trader. It takes a minute and happens once, before you choose a plan.

AI, Finn & Vox

Does EZPZ Finn cost extra?

Yes. The download is free for macOS, Windows and Linux, and the TradingView chart controls are free with your own AI key. EZPZ data tools need Pro or higher. Built-in AI with no key is part of Elite.

What does Finn need to run?

TradingView Desktop open on your computer (macOS, Windows and Linux). Finn draws, reads and sets alerts on your chart. It never places trades, and anything destructive waits for your click.

Does Elite include Vox?

Not the Vox plan itself. Elite includes EZPZ AI & Data in Vox, the TradingVox voice assistant. Add a Vox plan from $49/mo and skip the +$100 add-on. Vox is billed by TradingVox; link your EZPZ account in TradingVox settings.

Is EZRA financial advice?

No. EZRA is a research tool that reads and explains EZPZ data. It does not know your account or your risk, and it can be wrong. Check time-sensitive numbers on the live EZPZ page.

Billing

Is there a free trial?

Yes, on your first paid plan only: 7 days on Pro, Premium and Elite. Cancel before the trial ends and you are not charged.

How does annual billing work?

You pay for the year up front. The monthly figure shown with annual billing is that yearly price spread over 12 months.

Can I upgrade or downgrade?

Yes. Pick the new plan on this page and Stripe's billing portal opens to confirm the change. Stripe prorates the difference.

How do I cancel?

Cancel any time from the subscription page in your account. Your plan stays active until the end of the period you have paid for.

Can I get a refund?

Standard memberships are not refundable once a billing period has started. The full policy is in the Terms and Conditions.

More answers are in the full FAQ.

Every tool has a written guide in the Learn Center.

Start free. Upgrade when you're ready.

The Free plan needs no card. Paid plans add real-time data, strategy tools and EZPZ AI.