Volatility Surface 3D guideVolatility Surface 3D
Sample dataImplied volatility by strike and expiry
Options flow · Dark pool · AI
127 tools, each with a written guide, and 69 you can open FREE (delayed data). Tell us how you trade and see the ones that fit.
Charts show sample data. Research tools, not investment advice.
Implied volatility by strike and expiry
A chart of call premium, put premium and the SPY price across one trading session.
Calls Puts SPY
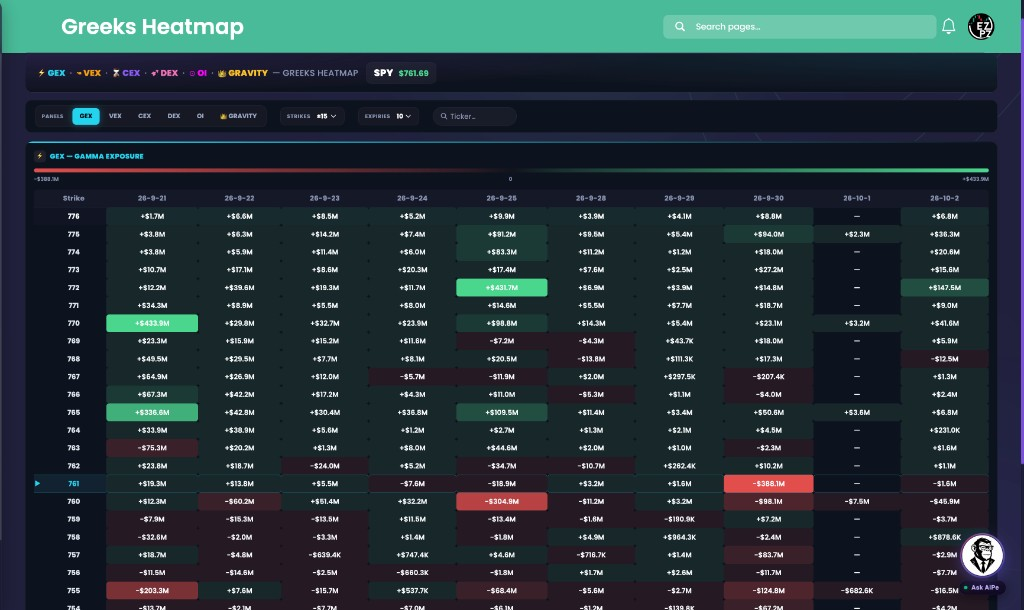
Greeks heatmap for SPY: largest gamma exposure at 770, October 26.
SPY 770 · Oct 26 · GEX −$896.0M
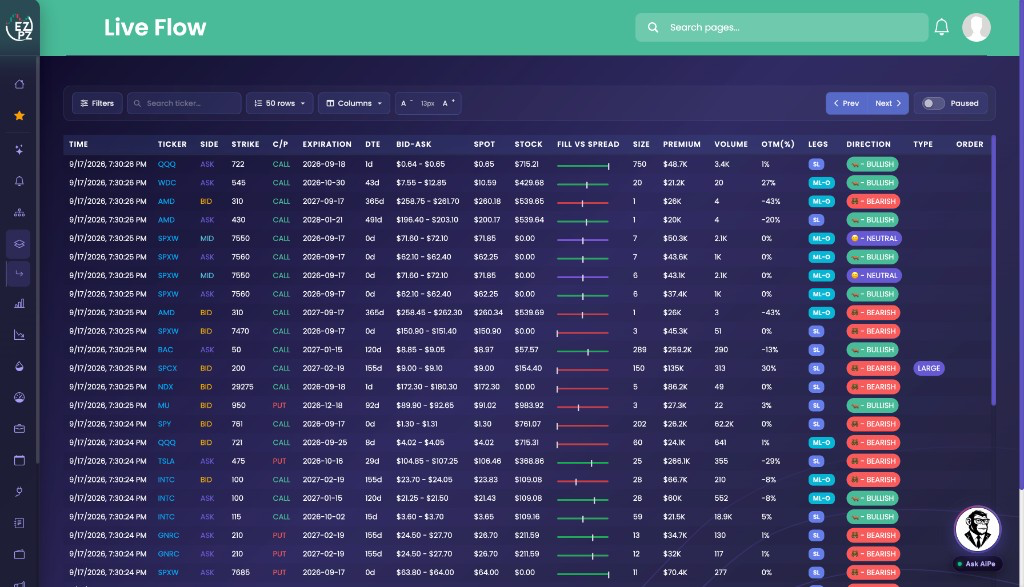
A list of options prints. Each row shows the time, the ticker, call or put, the strike and expiry, and the premium.
Large options prints, newest on top
Desk builder
Answer a few quick questions and the tools that match fill in your desk as you go.
EZPZ desk builder
Three quick questions
Pick one to go to the tools.
How it works
See EZPZ working, on sample data.
Finn · AI TradingView Connector
90 chart controls on every plan with your own AI key. Your plan unlocks EZPZ data, and Elite runs Finn on EZPZ AI with no key.
Every plan, Free included: bring your own AI key and Finn gets 90 chart controls. It draws, reads your chart and sets alerts.
Same chart, more power. Pro gives Finn EZPZ real-time data: live options flow, scanners and dark pool.
Same chart, more power. Premium adds Trader's FieldMap levels, drawn straight onto your chart.
Elite runs Finn on EZPZ AI, so no API key is needed, and adds setup analysis drawn on your chart, regimes, Greeks and news. Shown on QQQ.
Analyze QQQ's intraday setup and mark up the chart
 EZPZ AITrading Assistant
analyze_and_draw_intraday_trade_plan…Bias leans long above the trigger. Trigger and invalidation are on the chart, with 2 confirmations and 1 conflict to watch.
Vox is a TradingVox plan. Elite includes EZPZ AI & Data in Vox. About Vox
For TradingView Desktop on macOS, Windows and Linux. Sample data
The tool map
127 tools in 8 departments. Search by name, filter by department, then open any tool to see a real screenshot and its guide.
An interactive map of the same tools as the list below. Each point is one tool, grouped by department. Everything on the map is also in the list.
Drag to rotate. Click a point to open the tool.
No tools match that. Try a shorter word, or clear the filters.
Workflows
Each walkthrough takes one idea through several tools, from the broad picture down to one name, and says what to look for at each stop.
Walkthroughs of how the tools are read together. Not trade recommendations.
From the session backdrop to the prints that expire today, one screen at a time.
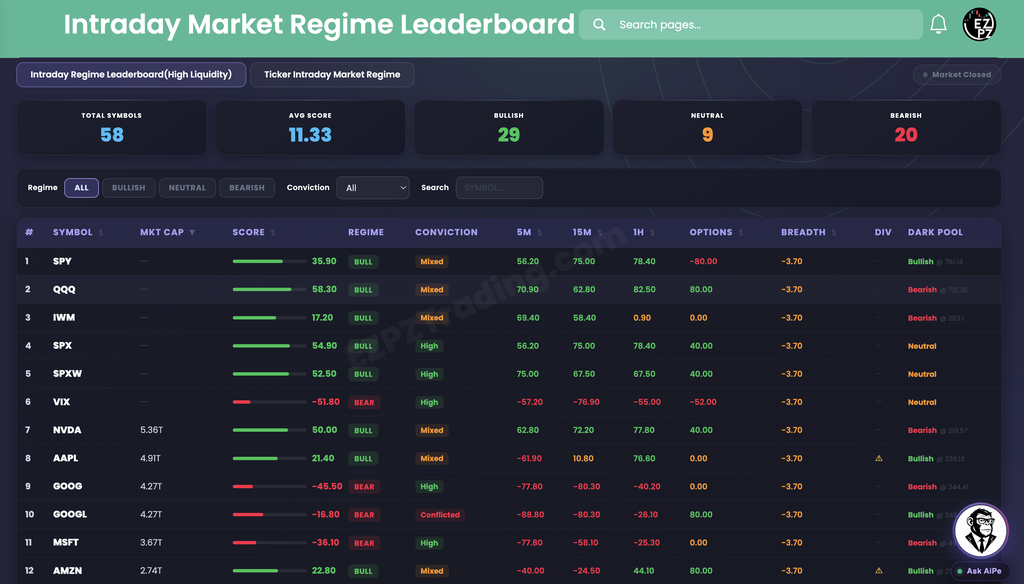
Intraday Regime Leaderboard Premium
A score labels each high-liquidity symbol Bullish, Neutral or Bearish for the current session, with a conviction level beside it. It describes the backdrop and is not a signal.
Look for: The label and Conviction on the index rows
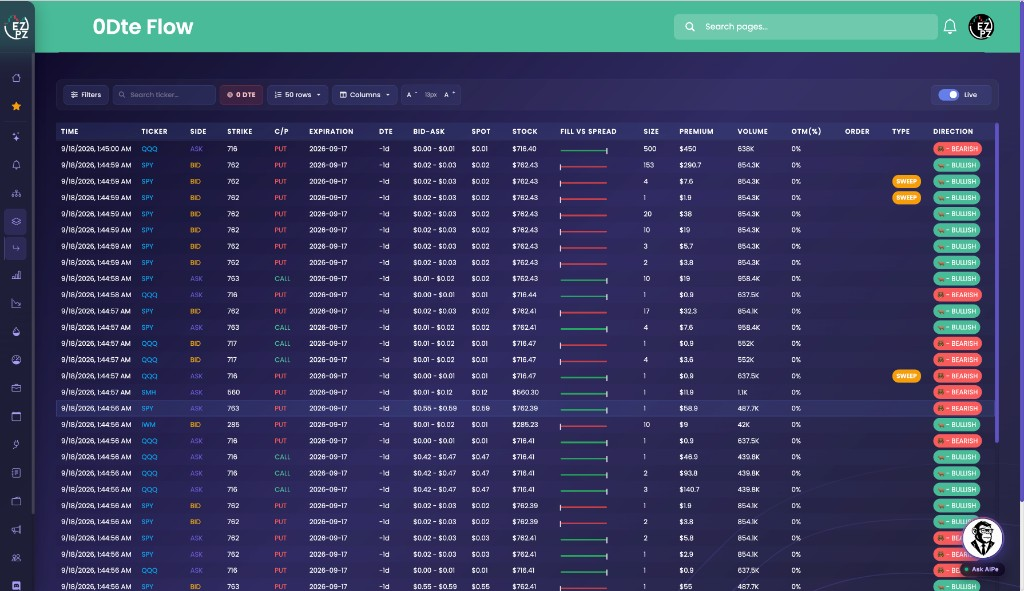
0DTE Flow Pro
The live tape of options prints that expire today, with side, premium, type and direction on every row. Same-day volume includes hedges and scalps, so a print is context, not a signal.
Look for: SIDE, PREMIUM and TYPE on the largest rows
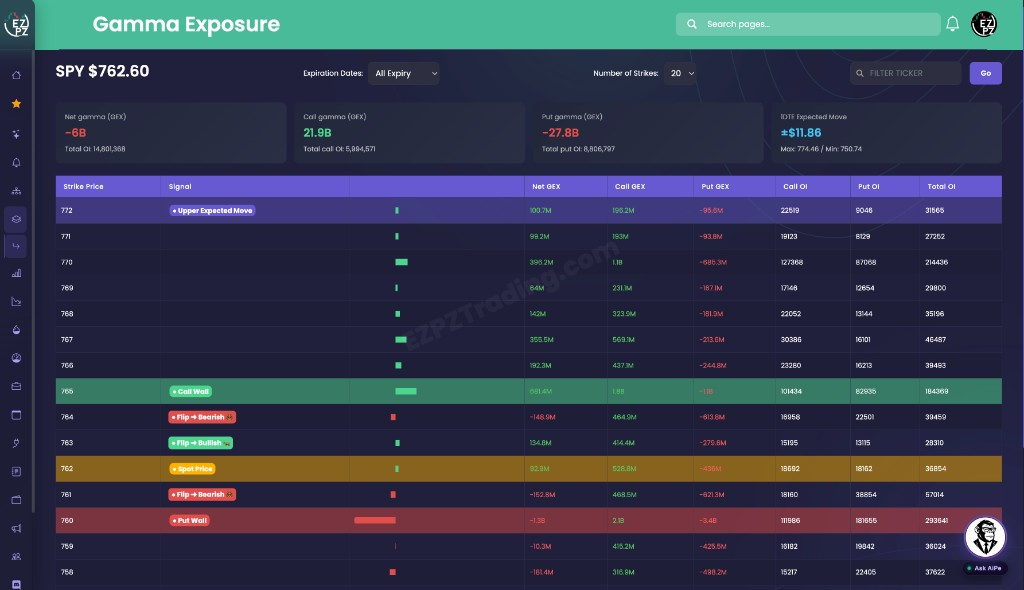
A strike map of net, call and put gamma exposure with the Call Wall, Put Wall and flip levels marked. It estimates how much dealers may need to buy or sell as price moves.
Look for: Call Wall, Put Wall and where Spot Price sits between them
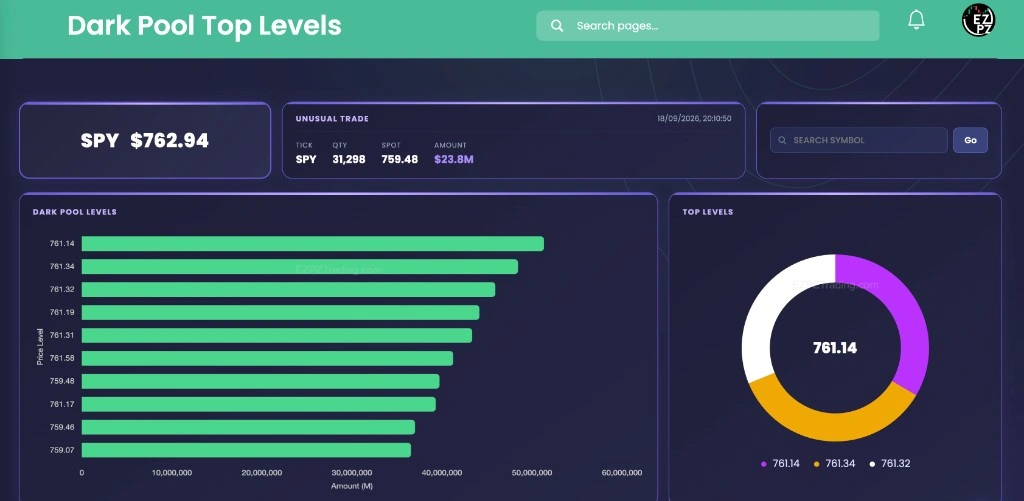
A per-ticker map of the price levels where dark pool volume has clustered, ranked by amount. It is a price map, not a buy list.
Look for: The busiest levels and how far price is from them
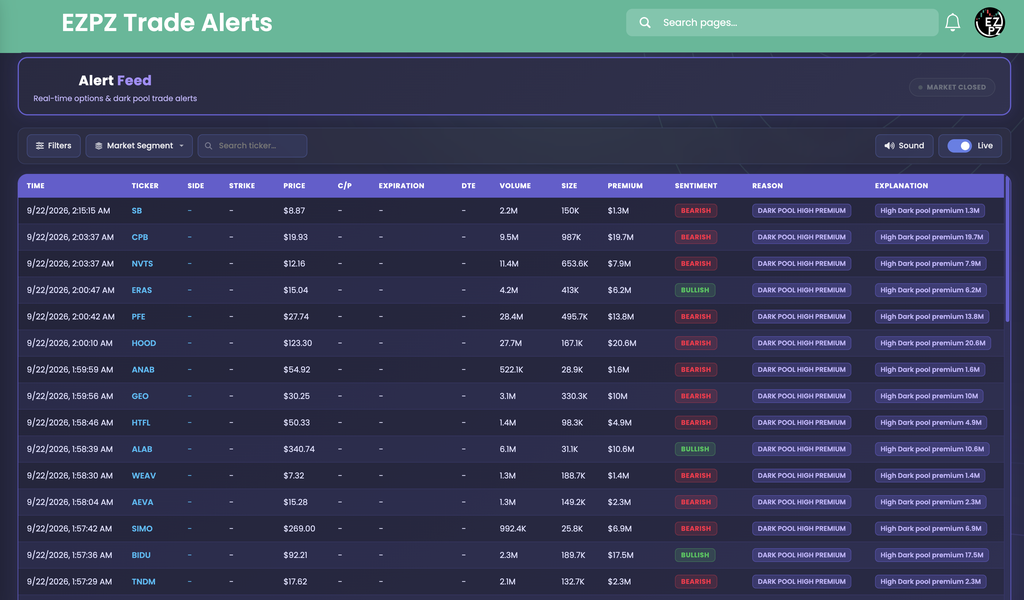
A live feed of notable options and stock activity, newest first, each row with a ticker, a time and the reason it fired. It is a scanning tool and a starting point for a closer look.
Look for: The Reason column
From a regime label to the options, dark pool and price levels behind one name.
Swing Regime Leaderboard Premium
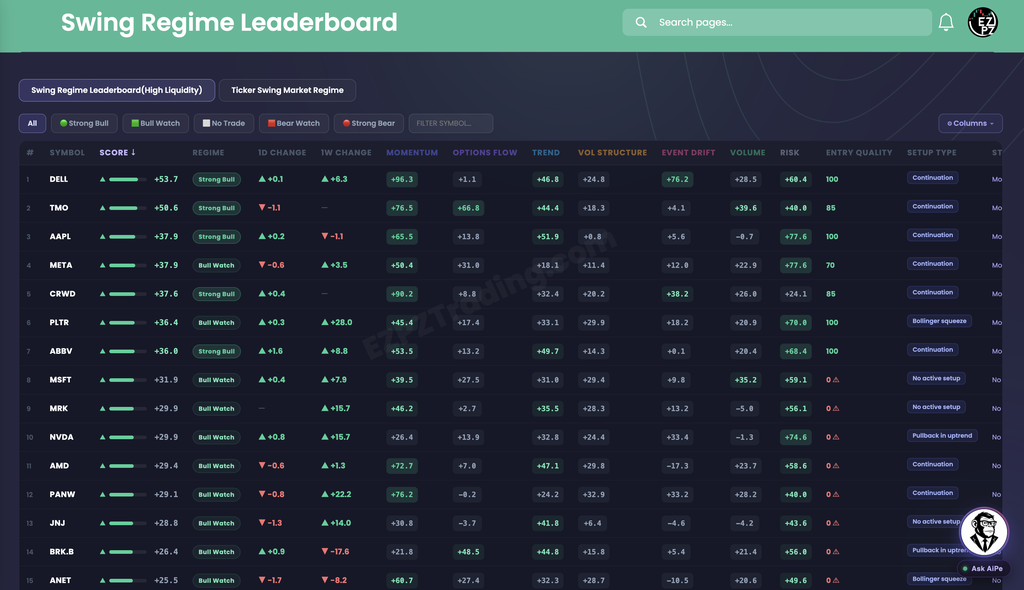
A score and a regime label from Strong Bull to Strong Bear for trades held several days to a few weeks, with Entry Quality and Setup Type beside it. The label describes a setup's condition and is not a buy signal.
Look for: Regime, Entry Quality and Setup Type on the same row
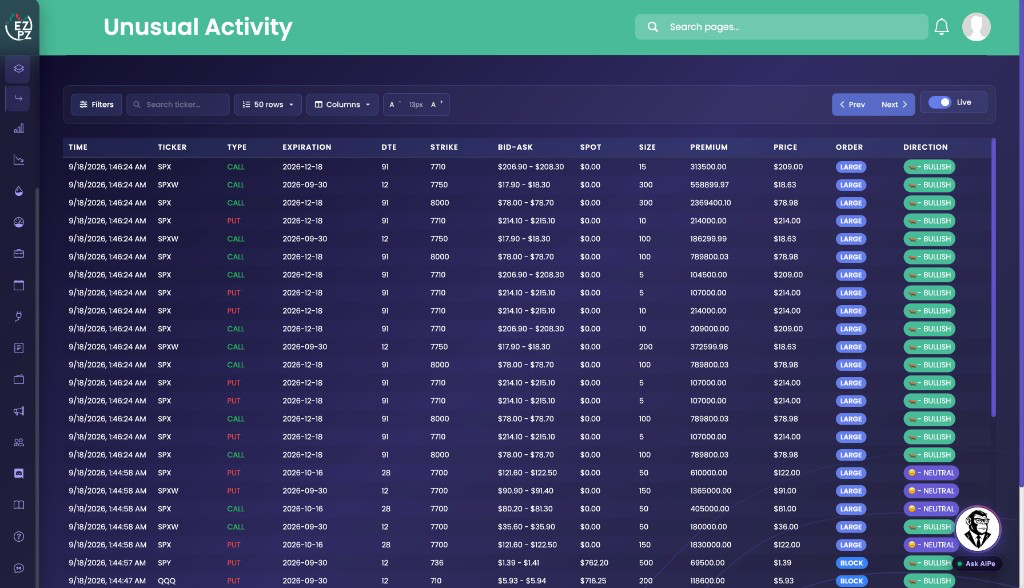
The live feed of Large, Sweep and Block options trades that stand out from ordinary flow. Size alone does not tell you the motivation.
Look for: ORDER and DIRECTION on the rows for your ticker
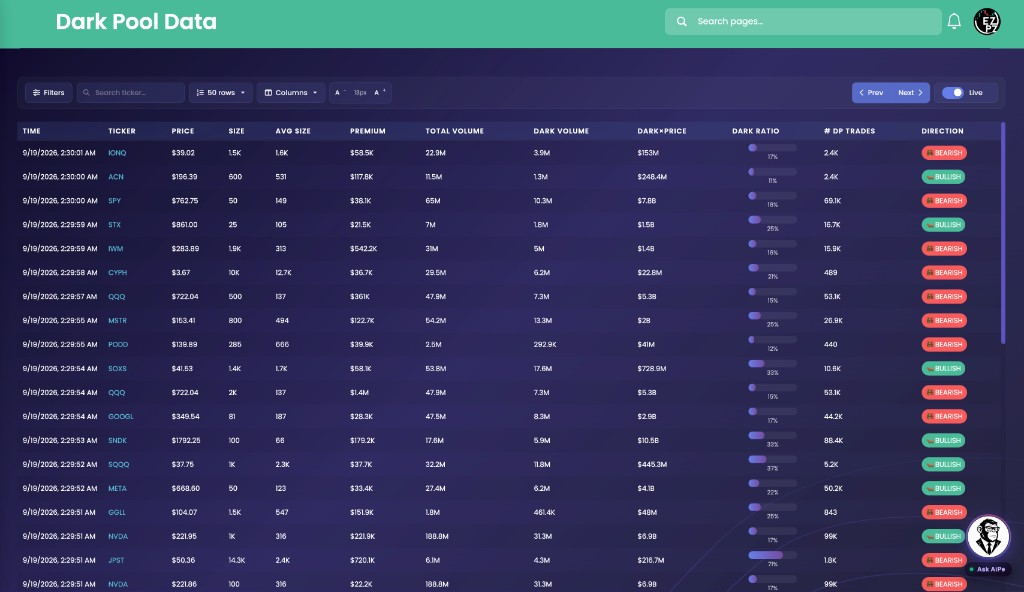
Dark Pool Flow Pro
The tape of equity trades executed away from public exchanges, with premium, dark volume, dark ratio and a direction label. A print shows size traded at a price, not who was on each side.
Look for: DARK RATIO next to PREMIUM
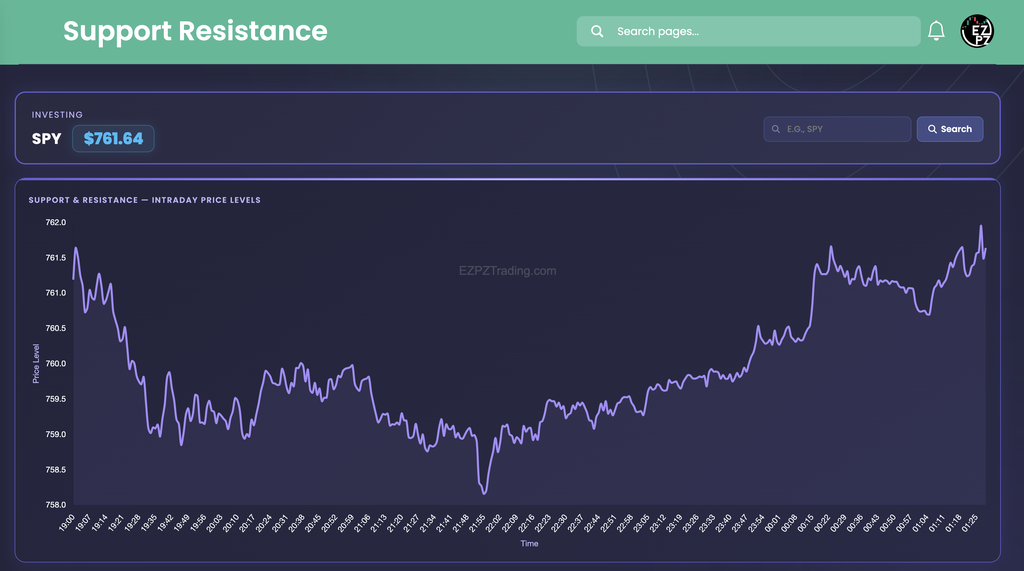
A session price line and a table of levels, marked green when price is above them and red when it is below. Price can pause at a level or run straight through it.
Look for: The nearest level above and below the current price
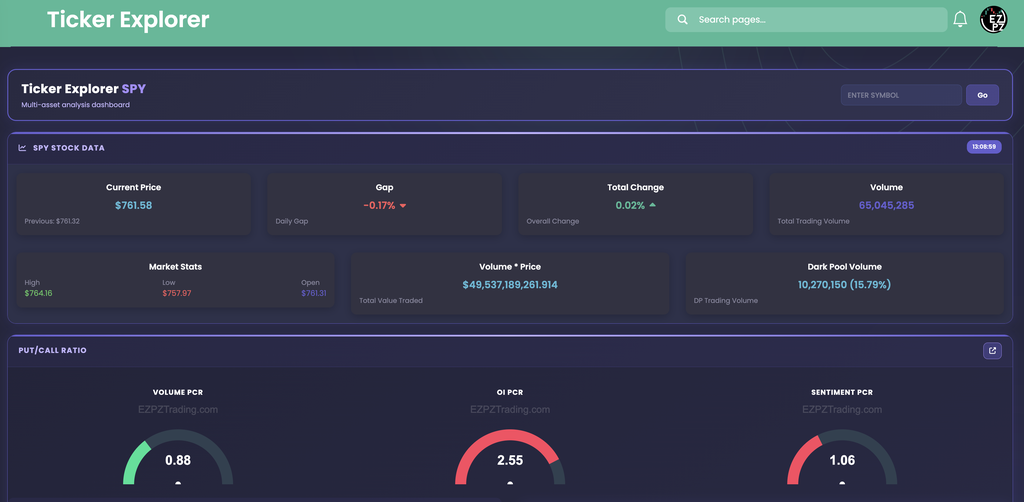
Ticker Explorer Pro
A one-symbol dashboard with quote stats, put/call gauges, options metrics, max pain, GEX and DEX, alerts and unusual activity on one scroll. It is the same data as the dedicated pages, kept on one name.
Look for: Put/Call Ratio, then the max pain row
From how volatility is priced to where the max pain strikes sit for one expiration.
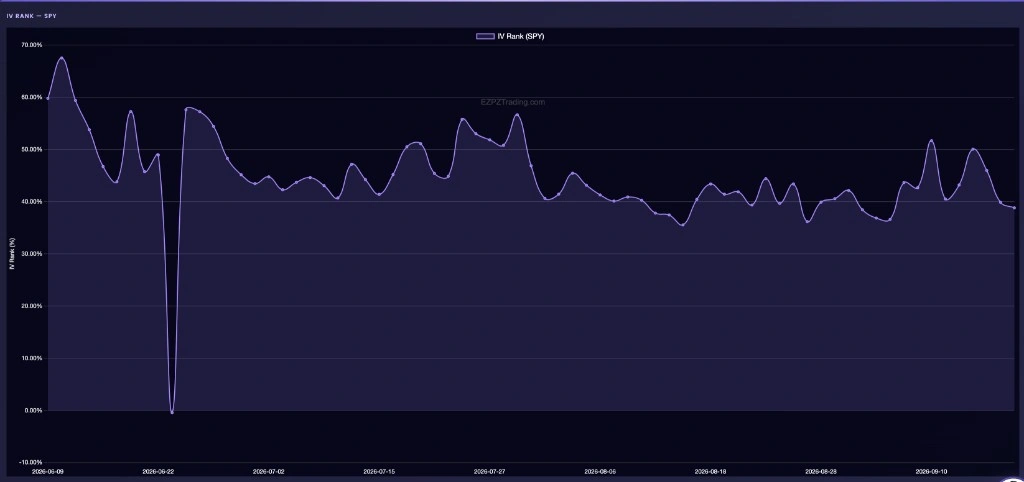
IV Rank Explorer Pro
Where current implied volatility sits against the ticker's own history, shown as Current IV, IV Rank and IV Percentile. The cards describe the ticker's past range and are not a forecast.
Look for: IV Rank next to IV Percentile
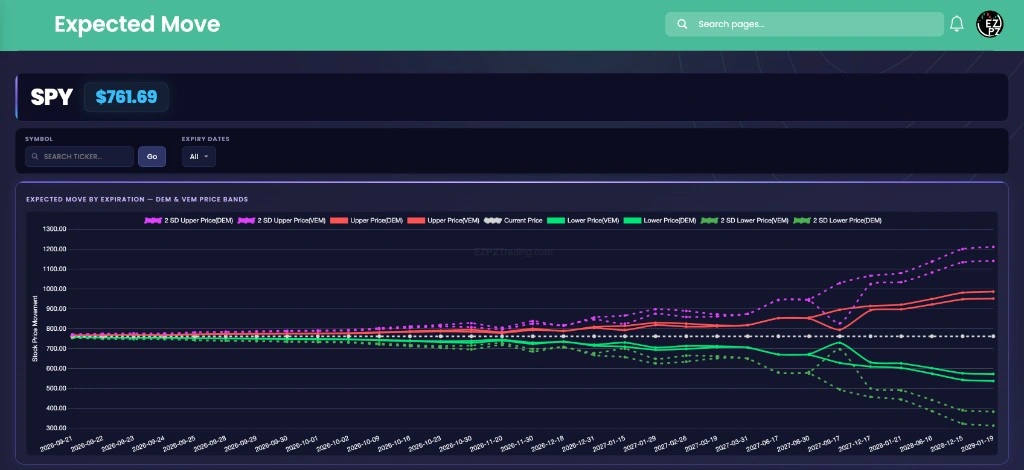
Expected Move Pro
Price bands by expiration, derived from options premiums, with a table for each date. They are priced ranges, and the stock can finish outside either band.
Look for: The upper and lower bands on the first expiration
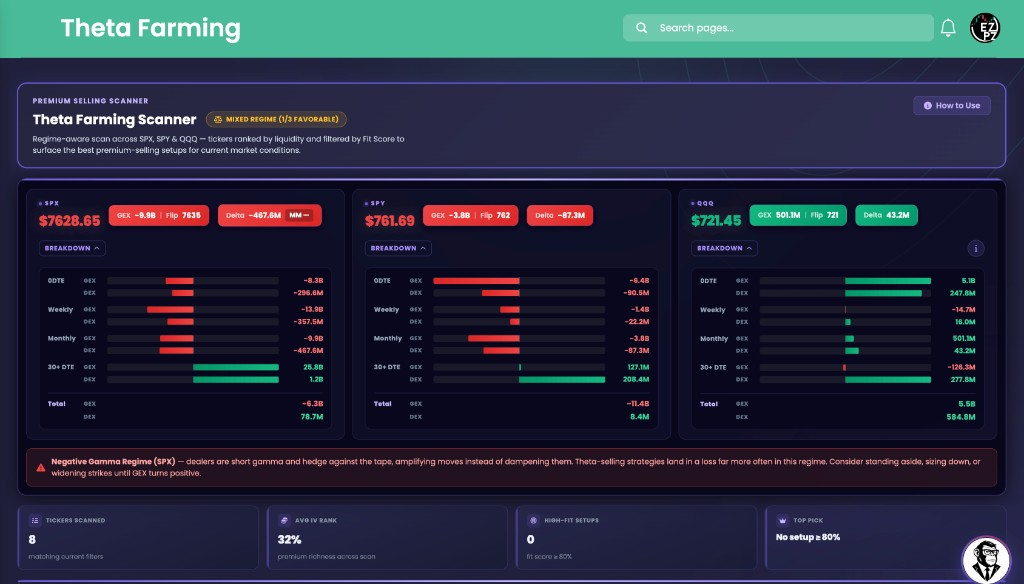
Theta Farming Premium
A scanner that shows the gamma backdrop for SPX, SPY and QQQ, then lists candidate structures with a Fit Score on each badge. A badge is a candidate, not a trade, and size and risk stay your decision.
Look for: Fit Score and the GEX regime cards
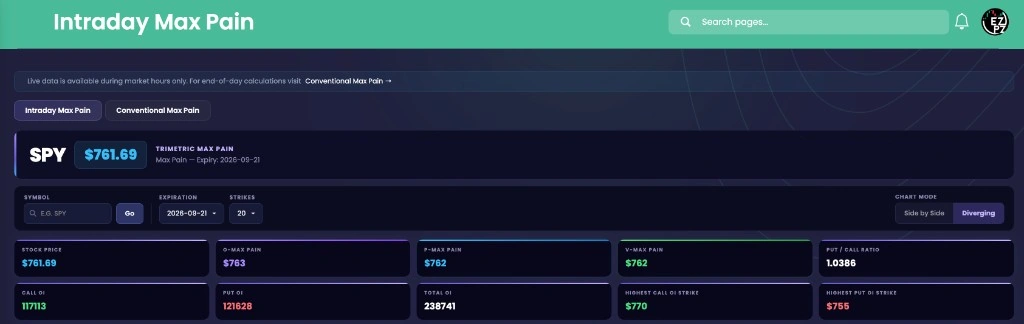
Max Pain Pro
Three max pain readings for one ticker and expiration, charted against the last price. The three strikes can disagree, and none of them is a target.
Look for: O-Max Pain, P-Max Pain and V-Max Pain against the Price line
From a holding-period score to the fundamentals, estimates and dates behind one company.
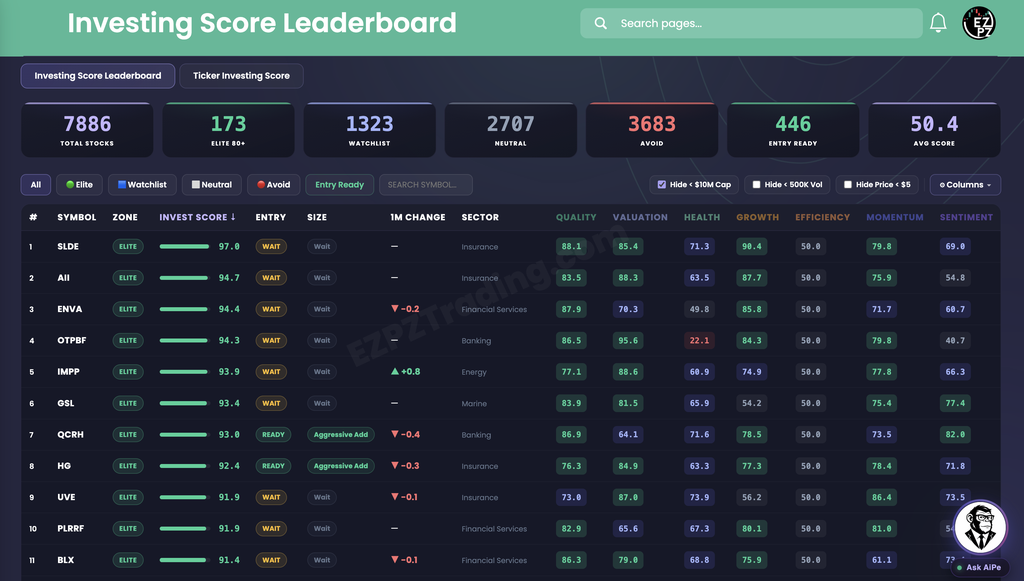
Investing Regime Leaderboard Premium
A score with a zone label for stocks you might hold for weeks to months, rolled up from seven category scores, with Entry and Size labels. It is a report card for a longer holding period, not a price forecast.
Look for: The category cells behind the total score
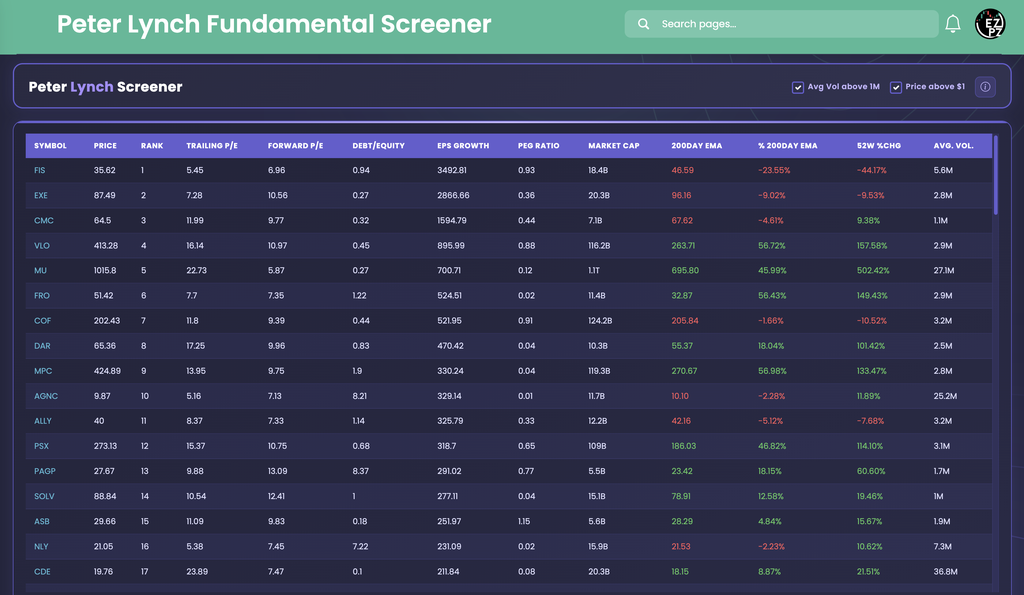
Peter Lynch Fundamental Screener Pro
A table of stocks that pass six fixed fundamental cutoffs, with price, trend and average volume beside them. Passing the screen is a reason to research a name, nothing more.
Look for: The trend columns beside the fundamentals
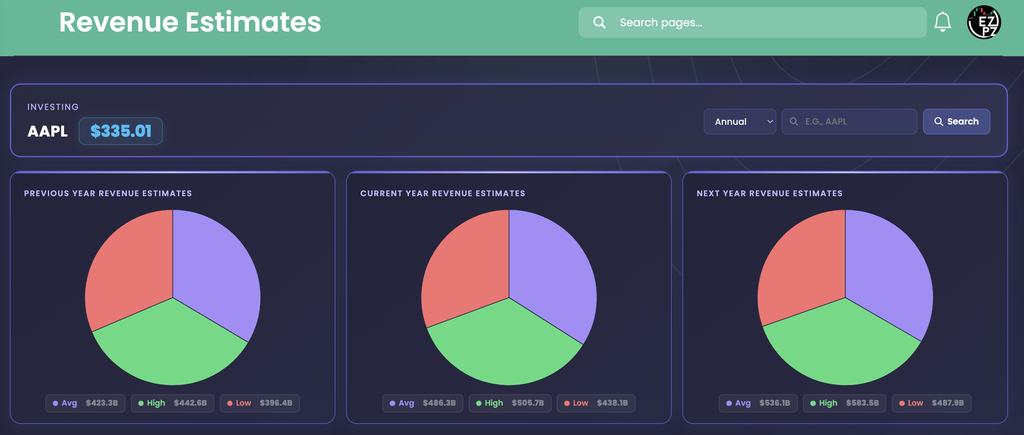
Analyst Estimates Free
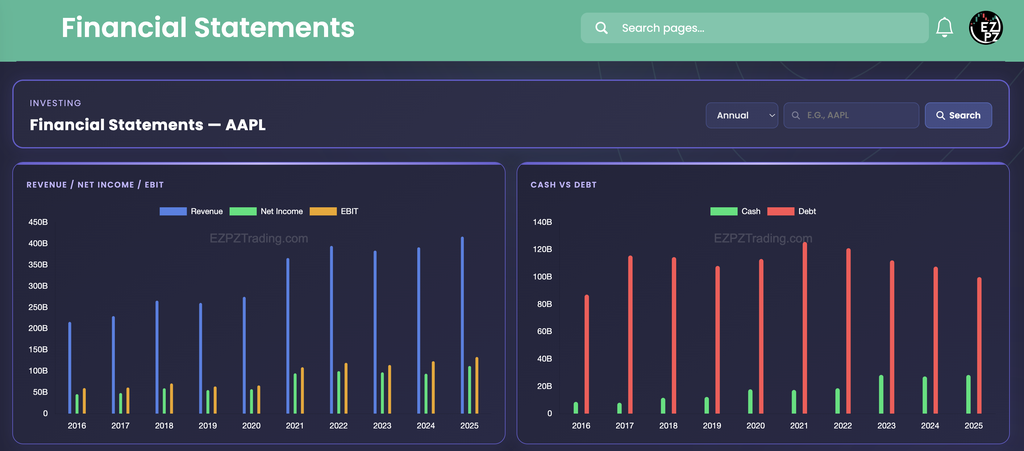
The average, high and low analyst forecasts for revenue, EPS, EBITDA and EBIT by period, with the number of analysts behind each. They are expectations, not results.
Look for: The gap between High and Low
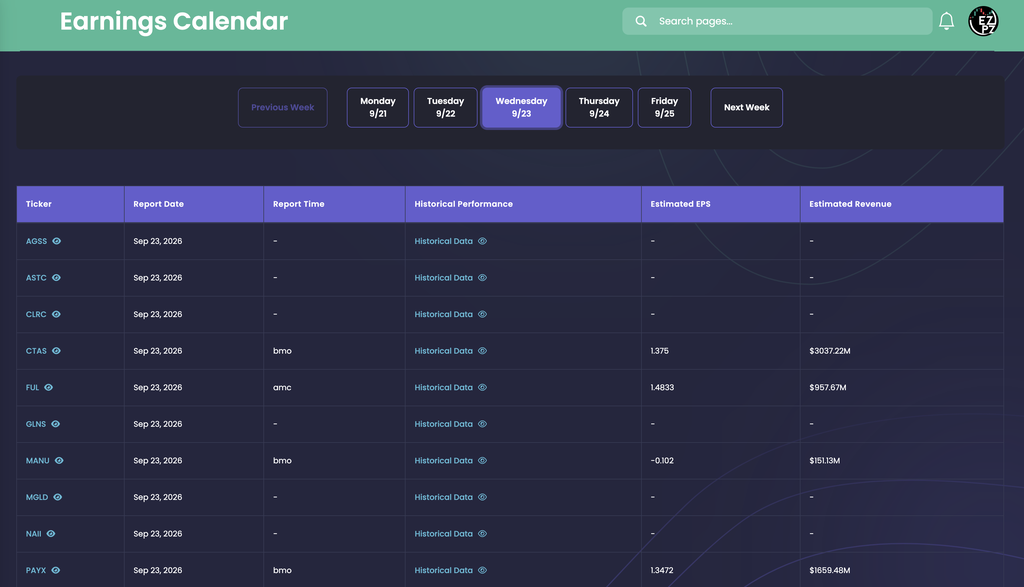
Earnings Calendar Free
A weekday by weekday schedule of companies reporting quarterly results, with report time and analyst estimates. Dates listed weeks ahead can move.
Look for: Report Time, before the open or after the close
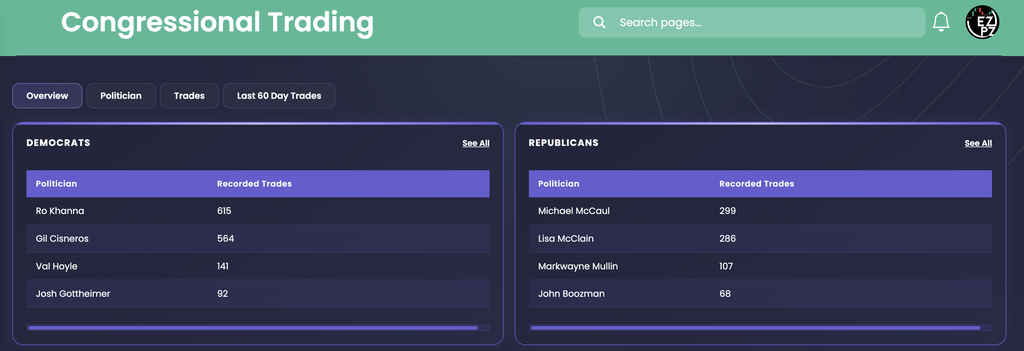
Stock trades that members of Congress are required to disclose, by politician and by ticker. Filings arrive after the trade and show nothing about intent.
Look for: The Date column, which is the trade date and not the filing date
From a short interest rank to the pressure readings and the daily short volume on one name.
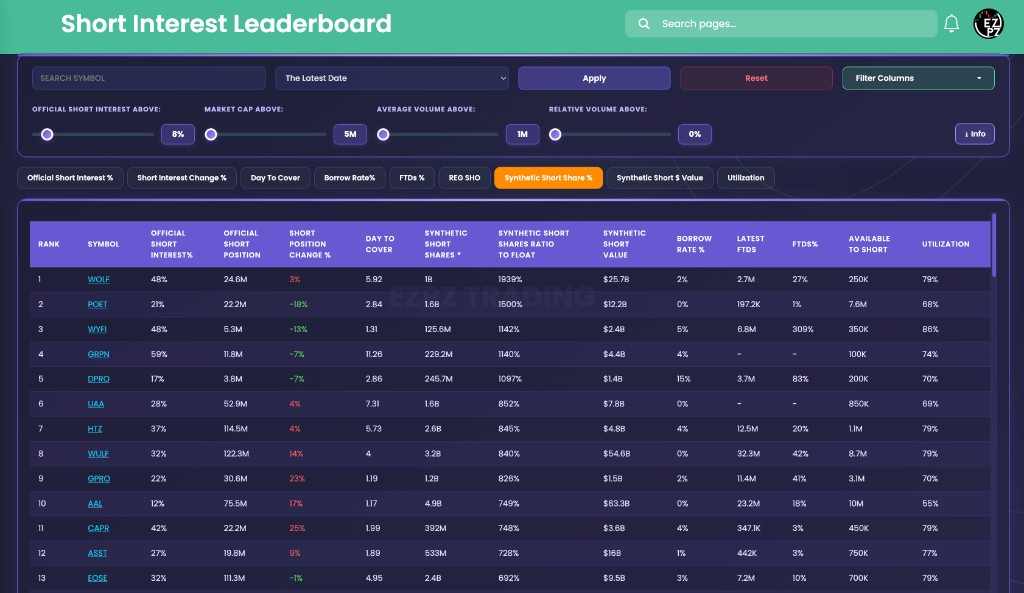
Short Interest Leaderboard Pro
A ranked table of stocks by official short interest as a percent of float, with Day To Cover and Utilization on each row. It is a rank, not a squeeze list.
Look for: Official Short Interest % with Day To Cover
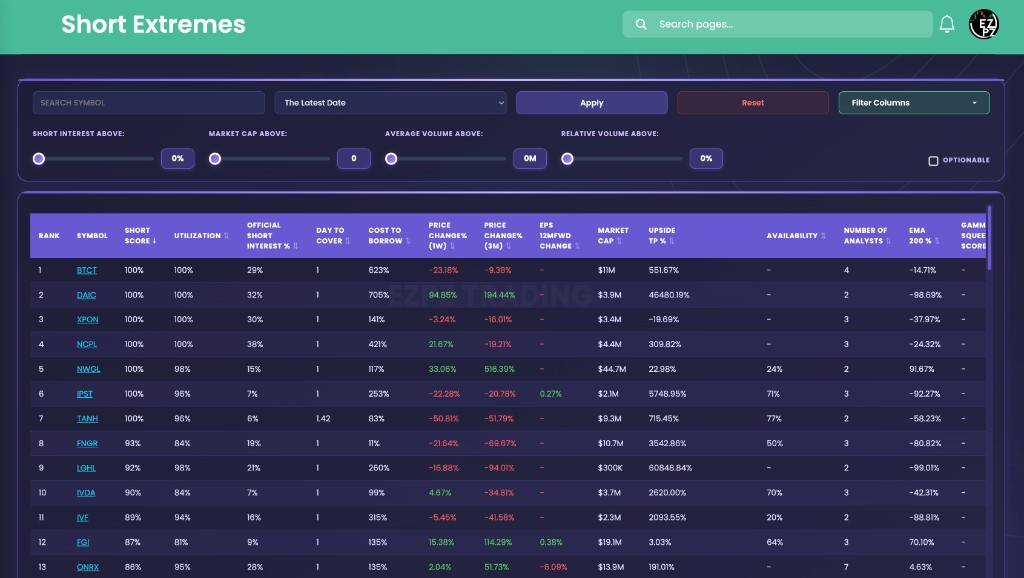
ShortEx Premium
A ranked table by Short Score that puts utilization, short interest, days to cover and cost to borrow on one row. The top rank is the highest score on that load and does not mean a squeeze is starting.
Look for: Short Score next to Cost To Borrow
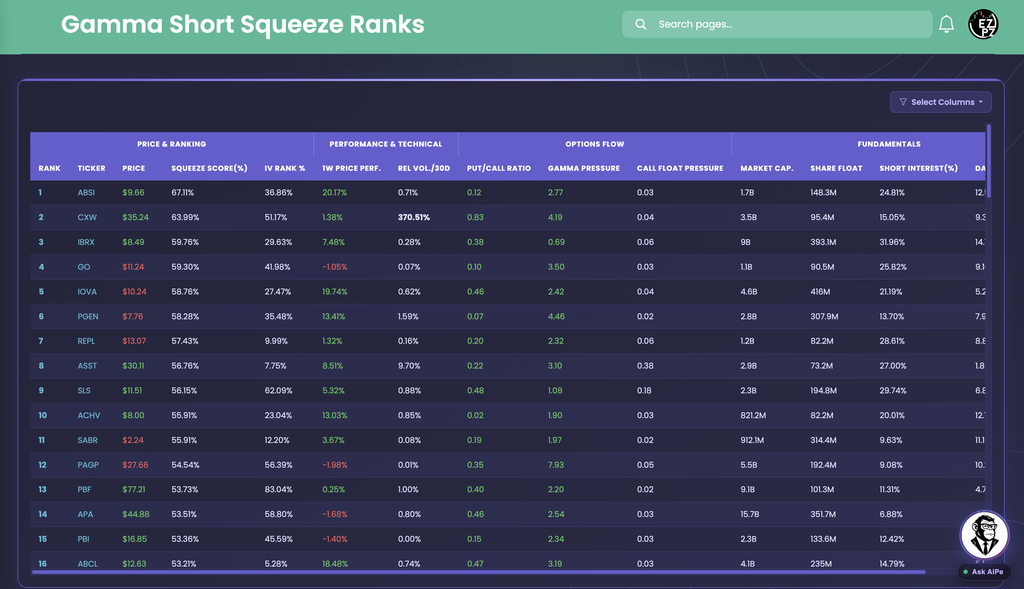
A ranked list where Squeeze Score sits next to gamma pressure, short interest and days to cover. The readings describe the row and do not confirm that covering has started.
Look for: Gamma Pressure and Call Float Pressure
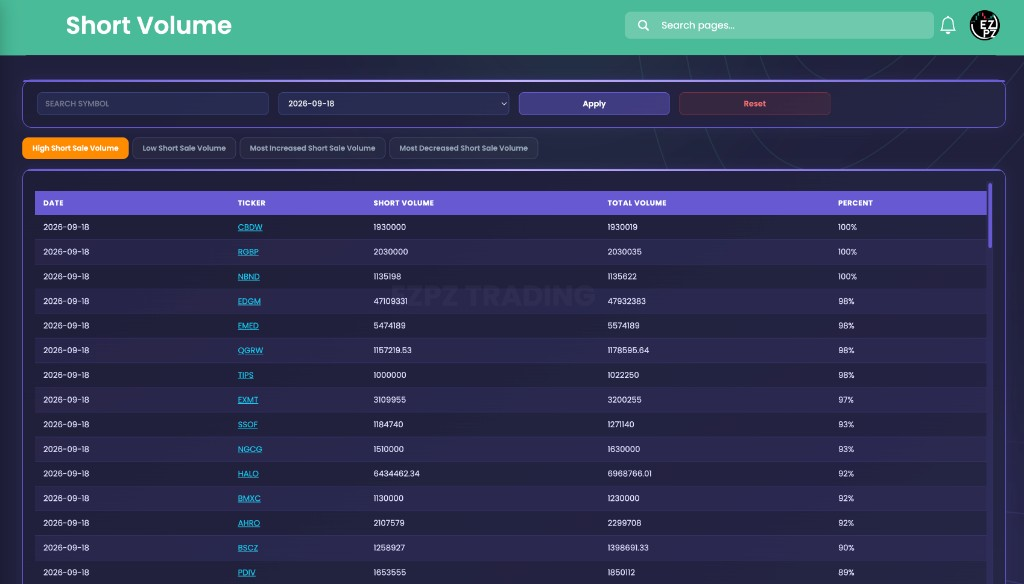
Short Volume Free
Short sales as a share of each day's total volume, by ticker. It is a daily tape share that includes market making and hedges, not official short interest.
Look for: Percent, and Percent Change on the Most Increased tab
Departments
The tools are organized into departments. Pick a tool in any of them to see what it looks like, then open the full list in the map.
The options tape as it prints: live flow, unusual activity and alerts.
Gamma, open interest, volatility and max pain, by strike and by expiration.
Scanners and screens built around one way of trading.
Scanners, regime scores and analytics for individual stocks.
Off-exchange prints, the levels they cluster at and what they can and cannot tell you.
Short interest, short volume and squeeze screens.
Fundamentals, estimates, disclosures and the calendars around them.
EZRA, AiPe, EZPZ Finn and the TradingView indicators.
Hands on
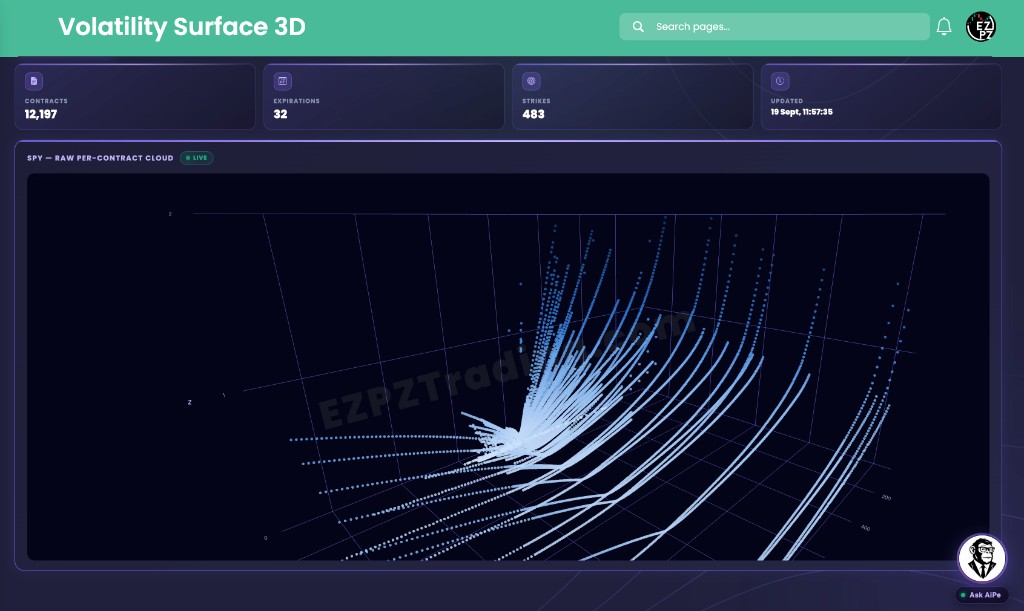
One of the member tools draws implied volatility as a 3D surface. This is a miniature of it, running on sample data.
A volatility surface shows implied volatility across every strike and every expiration at once. Reading along the strikes shows the smile and the skew, and reading from near expirations to far ones shows the term structure.
Read the Volatility Surface 3D guide Pro
Drag to turn the surface. Hover a point to read it.
AI
The assistants read the same data as the tools and answer in plain language. They are research tools, not advisers. They do not know your account or your risk, and they can be wrong.
AI research analyst
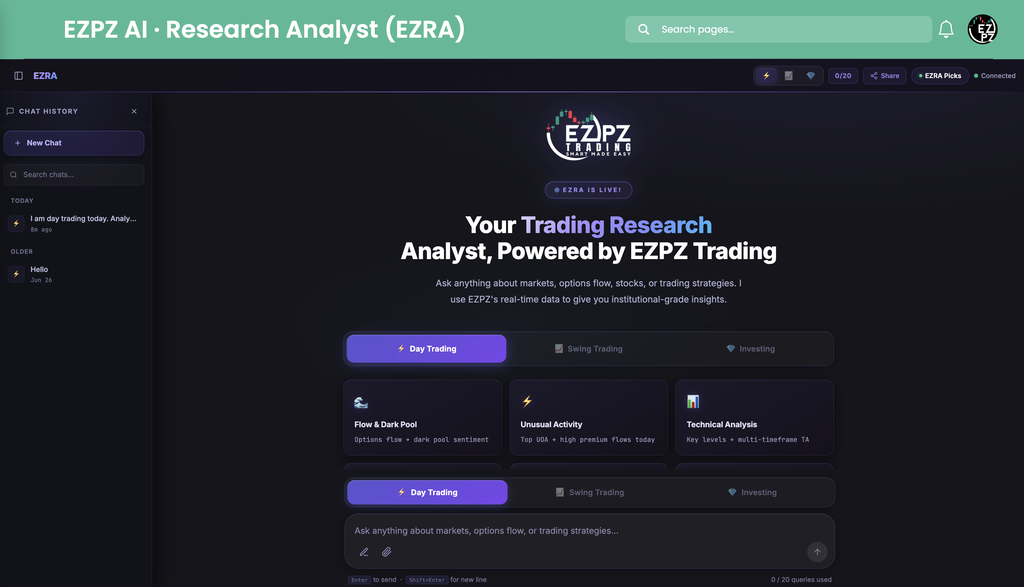
EZRA is EZPZ's AI research analyst: ask about any ticker or the market in plain words and get a written answer with charts and tables built on EZPZ data.
Illustrative
Question: What stands out in options flow and dark pool activity for a ticker I am watching?
Pulls options flow, dark pool, gamma and regime data for that ticker into one written answer.
Adds charts and tables, and points to the EZPZ page behind each reading.
Research, not advice. Check time-sensitive numbers on the live page.
On-page AI analyst
AiPe is the AI analyst built into EZPZ chart and data pages. Click Ask AiPe in the bottom right corner and ask about the exact data on your screen.
See how AiPe works (AiPe)AI agent for TradingView
EZPZ Finn is a free desktop app that connects TradingView Desktop to AI, so you can control your chart in plain English and pull EZPZ market data beside it.
Get EZPZ Finn (EZPZ Finn)The demo runs on delayed data with a daily question limit. Full EZRA works on live data.
Ecosystem
EZPZ Trading is the data platform. These are the products around it, each marked live, waitlist, launching or roadmap.
 EZPZ Trading
You are here
EZRA
EZPZ Trading
You are here
EZRA
AI research analyst
Ask about a ticker or the market in plain words and get a written answer built on EZPZ data.
 AiPe
AiPe
On-page AI analyst
An AI analyst built into EZPZ chart and data pages that reads the data on your screen.
EZPZ Finn
AI agent for TradingView
A free desktop app that connects TradingView Desktop to AI and brings EZPZ data beside your chart.
 TradingVox
Voice AI companion
Ask about the market out loud and hear answers from EZPZ data. It never places trades.
Portfolio
Trade journal
Journal, track and analyze every trade.
 EZPZ Trader
Order automation
Routes TradingView alerts or your own signals to broker orders. Open by waitlist.
 ZPZ Coin
Utility token
The ecosystem token, designed to connect EZPZ products through access and governance.
 EZPZ Investing
AI portfolio layer
Planned to turn EZPZ research into portfolios. It is on the roadmap and not available yet.
Around the tools
A Discord for members, a written guide for every tool, a grant for traders who cannot pay, and a plain account of the data you get.
A Discord for members: live sessions, workshops and indicator reviews.
138 guides across 17 categories explain how each tool is built and how to read it. Free to read.
Open the Learn Center (Learn Center)One free month of a paid plan for approved applicants.
Read about the grant (Retail Trader Grant)FREE (delayed data) pages run at least 15 minutes behind or show end-of-day data. Real-time options data is for paid, non-professional members who sign a market-data agreement.
Explore the tools (How the data works)Not Financial Advice. The information provided by EZPZ Trading LLC is not financial advice and should not be interpreted as a buy or sell signal. Investing and trading in options are inherently risky, with potential losses often exceeding profits. Any trading decision should be based on your own research. Ensure you have read and understood our full terms, including the risks involved in trading, before subscribing. We strongly advise against trading based solely on the information provided.
Questions
Unusual options activity is options volume that stands out from a contract's recent baseline: large prints, sweeps, blocks, or volume that outruns typical size or open interest. On EZPZ it is the live feed of those standouts, not the full tape.
No. Large trades happen for a lot of reasons, including hedges, rebalancing, and market making. Size alone does not tell you the motivation.
No. A print tells you size traded at a price, not who was on each side. DIRECTION is a bullish, bearish, or neutral label on the row. It is not proof of accumulation or distribution.
Gamma exposure estimates how much options dealers may need to buy or sell the underlying as price moves. It combines open interest with each contract's gamma. Positive GEX is usually read as a calmer backdrop. Negative GEX is usually read as a faster, trend-prone one.
No. An alert flags that something crossed a threshold for that Alert Type, not that it is a recommendation. Treat it as a starting point, then follow up on the dedicated flow, dark pool, or options pages for more context.
No. EZRA is a research tool that reads and explains EZPZ data. It does not know your account or your risk, and it can be wrong. Check time-sensitive numbers on the live EZPZ page.
AiPe is included with Pro, Premium, and Elite. The Ask AiPe button does not appear for Free members or for visitors who are not signed in. If you are on Pro or higher and a page has no button, that page does not have AiPe yet.
Yes. The download is free for macOS, Windows and Linux, and the TradingView chart controls are free with your own AI key. EZPZ data tools need Pro or higher. Built-in AI with no key is part of Elite.
FREE (delayed data) pages run at least 15 minutes behind, the public flow feed about 30 minutes, and some pages show the prior session. Real-time data is part of the paid plans.
No. EZPZ Trading is a data and research platform. It does not place trades or hold funds, and nothing on it is investment advice.
More answers, and a guide for every tool, are in the Learn Center.
69 tools are FREE (delayed data), and signing up needs no card. Pick the tools that fit how you trade.