
Estimating Synthetic Share Exposure -Naked Shorting


Estimating Synthetic Share Exposure -Naked Shorting
Beneath the surface of official short interest reports, float statistics, and broker confirmations lies an architecture of layered financial obligations, borrowed and re-borrowed collateral, derivative positions that mimic equity exposure without creating it, and settlement processes that routinely allow trades to go undelivered for days, weeks, or even months.
A Methodological Framework for Detecting Structural Imbalances in Equity Markets
EZPZTrading Research | March 2026
Abstract
Synthetic shares — which are also referred to in the literature as phantom shares — may be the least understood but most impactful structural components of modern stock markets. The mechanism of creation is complex, as there are at least four distinct elements to the creation of phantom shares, including the use of derivative structures, exchange traded funds (ETFs) and their ability to short sell, securities lending programs and the subsequent rehypothecation of borrowed stocks and finally recurring settlement fails, or Fails-to-deliver (FTD), which ultimately result in an increase in the effective number of shares available in the marketplace for trading purposes, thereby impacting price formation, governance and potentially creating conditions for violent short squeezes. In this paper, we will describe the methodologies used to construct the Synthetic Share Percentage (SSP) metric by EZPZTrading — a composite structural pressure indicator — using broker data, options flow data, historical FTD records, historical records of the Reg SHO threshold levels and lending utilization signal data. We will not reveal the proprietary methodology used to create the SSP metric; however, we will provide an adequate description of the theoretical underpinnings of the SSP metric so that readers can understand the purpose and significance of the SSP metric. Using existing peer reviewed academic research, SEC regulatory history and recent market events, we assert that although estimating the amount of phantom shares present in a stock market is imprecise due to the inherent lack of transparency in these markets, providing retail traders with a means to estimate phantom shares prior to stress events creates a unique opportunity for these traders to identify structurally pressured equities.
1. Introduction: The Gap Between Reported and Real
Every investor who opens a brokerage account receives a statement reflecting shares held. That statement, clean and numerical, implies a certain solidity — that the share shown is a real, discrete, deliverable unit of ownership. The mechanics of modern markets, however, tell a more complicated story.
Synthetic Leaderboard: Synthetic Short Share Percent of the Float
 Beneath the surface of official short interest reports, float statistics, and broker confirmations lies an architecture of layered financial obligations, borrowed and re-borrowed collateral, derivative positions that mimic equity exposure without creating it, and settlement processes that routinely allow trades to go undelivered for days, weeks, or even months. The aggregate result of these mechanisms is what researchers, regulators, and market practitioners have come to call synthetic shares — equity equivalents that circulate in markets without a corresponding, unencumbered physical claim on the underlying company.
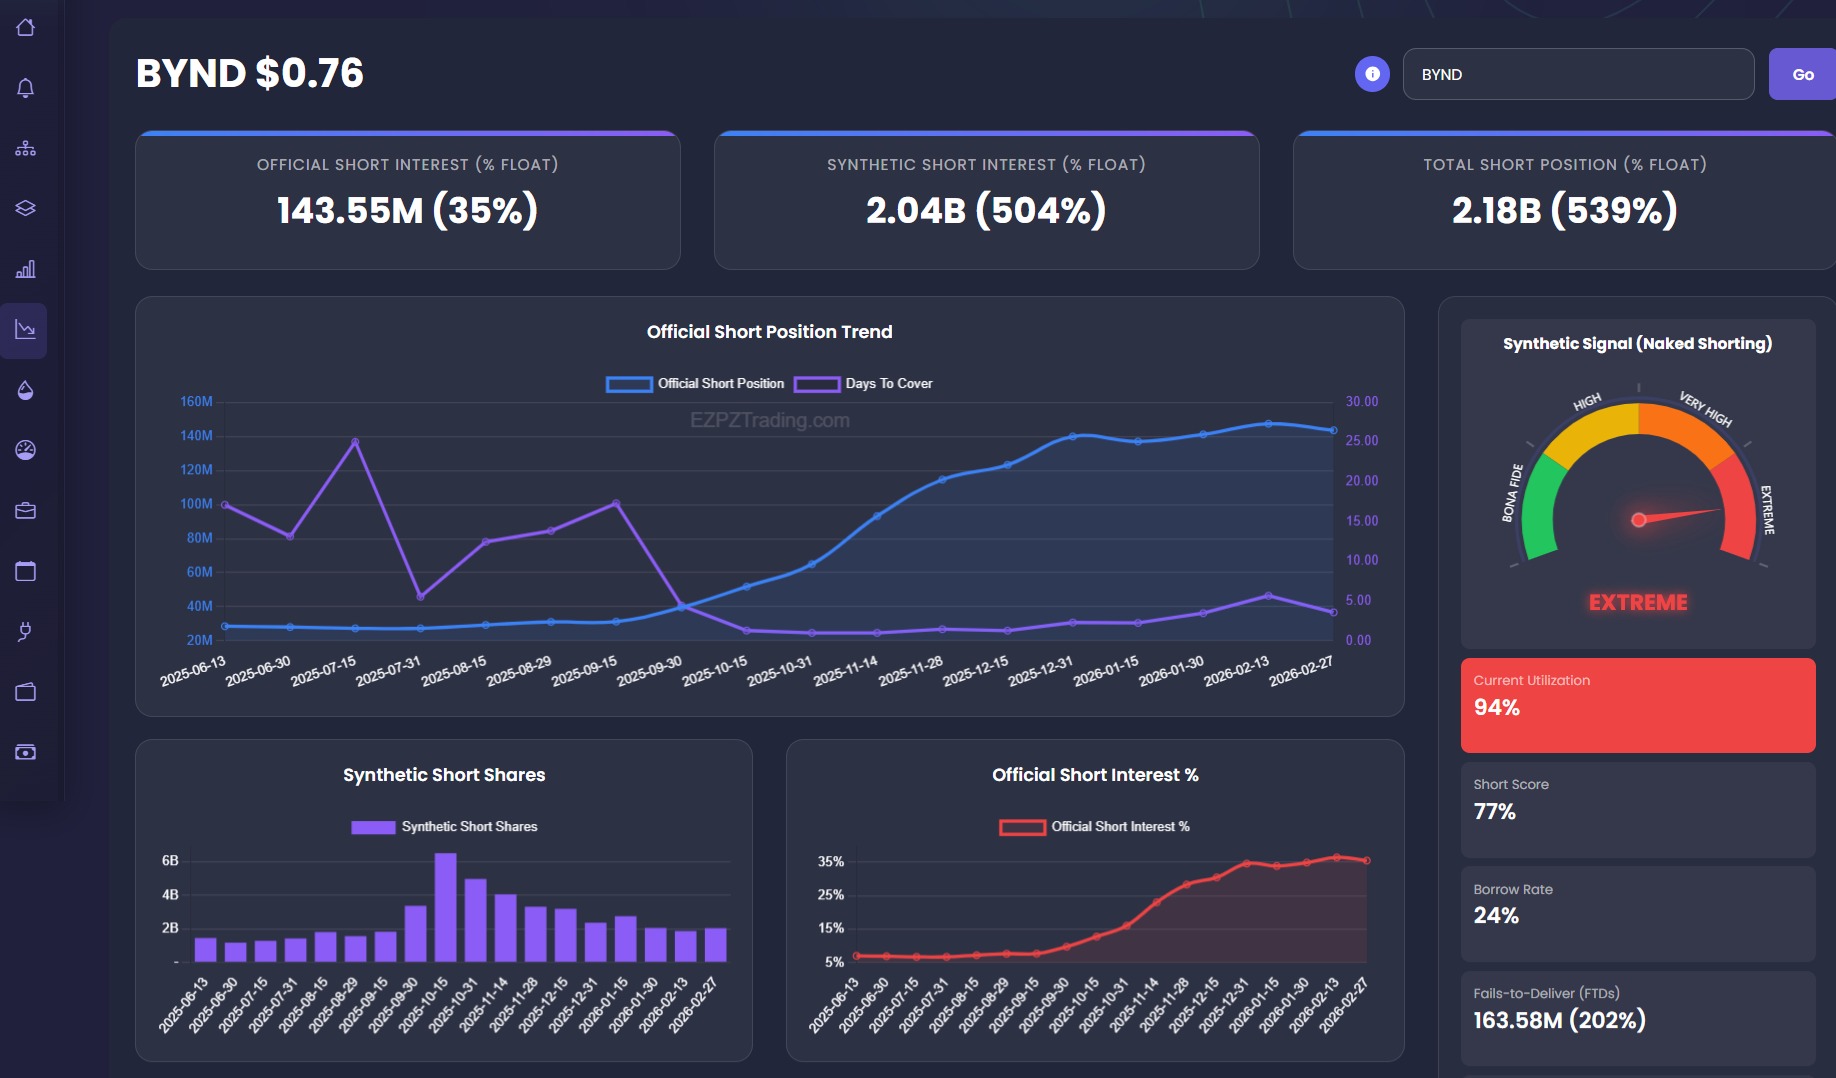
The practical consequences are significant. When synthetic exposure concentrates in a given security, it compresses the cost of maintaining short pressure, can suppress prices beyond what the fundamental short thesis warrants, and creates conditions under which a forced-covering event — a short squeeze — can be explosive. The 2021 GameStop episode, in which short interest as a percentage of float exceeded 140% before the stock rose nearly 1,800% in fifteen days, remains the most visible modern illustration of what happens when synthetic supply concentration unwinds rapidly.
For retail traders, the challenge has always been visibility. Institutional participants have proprietary access to prime brokerage data, securities lending desks, and real-time settlement intelligence. Retail platforms historically offered little more than lagged FINRA short interest reports, published bimonthly, which themselves significantly understate true synthetic exposure due to off-balance-sheet activities, OTC reporting gaps, and the inherent difficulty of capturing derivative-embedded short positions.
EZPZTrading's Synthetic Share Percentage metric was developed to partially close this visibility gap — not by claiming forensic precision, but by constructing a composite signal that draws on all publicly accessible data streams, normalizes them against float and market structure, and surfaces the securities where structural imbalances are most extreme. This article explains the intellectual foundations of that framework. Earlier efforts by Reddit and X users, such as @userofintellect, led to platforms such as LogTheFloat, which created estimates of retail ownership of certain stocks far beyond the number of issued shares. The data was later corroborated against leaked Apex clearinghouse data on those same retail stocks, reaffirming earlier studies that bona fide rules are constantly violated and that there are effectively infinite loops used to maintain rehypothecation.
2. Defining Synthetic and Phantom Shares: A Review of the Literature
2.1 Synthetic Positions in Derivatives Theory
In classical options theory, a "synthetic long stock" is constructed by simultaneously holding a long call and a short put at the same strike and expiration — a position that economically replicates share ownership without requiring the direct purchase of shares. Conversely, a synthetic short involves a long put and short call. These constructions, well-documented in practitioner literature and exchange curricula, are entirely legal and serve legitimate hedging purposes.
However, their aggregate market effect matters. When large institutional participants construct synthetic short exposure through deep in-the-money puts or through options combinations, the resulting short pressure may not appear in standard short interest reports compiled from securities lending data. The reported short interest — derived from borrowed shares — captures only one vector of directional selling. Derivative-embedded shorts exist in parallel, influencing the same underlying price without appearing in the same statistics. This is not a loophole so much as a feature of how financial reporting has been structured: lending-based shorts are tracked; derivatives-based equivalents are not consolidated into the same metric.
2.2 Phantom Shares and the ETF Creation/Redemption Mechanism
Perhaps the most academically rigorous treatment of phantom shares in the recent literature comes from Evans, Karakas, Moussawi, and Young, whose paper "Phantom of the Opera: ETF Shorting and Shareholder Voting" was published in Management Science in 2025. The short-selling of ETFs creates "phantom" ETF shares, trading at market prices, with cash flow rights but no associated voting rights. Unlike standard ETF shares, which are backed by underlying securities held and voted according to sponsor direction, phantom ETF shares are typically hedged by the underlying basket as part of market-making activities and result in a significant number of sidelined votes of underlying securities.
The mechanism works as follows. When an investor short-sells an ETF share, they borrow it from a lender and sell it to a buyer on the open market. The buyer now holds a real ETF share with full economic rights. But the lender who provided the share for borrowing also still shows it on their books — as collateral. The authorized participant (AP) or market maker who holds the underlying securities as a hedge for that borrowed position typically abstains from voting those securities. The result is that increases in phantom shares for the corresponding underlying securities are associated with decreases in the number of proxy votes cast and increases in broker non-votes.
From a market structure standpoint, what matters is that ETF shorting effectively creates additional synthetic supply of the underlying securities. A security that is a significant component of a widely-shorted ETF can face downward structural pressure from two directions simultaneously: direct short selling of its own shares, and indirect synthetic supply from ETF-related mechanisms.
Research into ETF-related FTDs reinforces this picture. ETF-related FTDs are disproportionately larger than in equities markets and represent over 80% of all FTDs in U.S. financial markets. This is a striking figure. While equity-level fails have declined since the post-2009 regulatory reforms, ETF-level failures have grown, and their effect cascades into underlying securities through the creation/redemption mechanism.
2.3 Naked Short Selling and Fails-to-Deliver: The Phantom Share Infrastructure
The most direct mechanism for creating synthetic shares is naked short selling — the practice of selling shares without first borrowing them or confirming their availability for borrow. When the seller does not obtain the asset and deliver it to the buyer within the required settlement period, the result is known as a "failure to deliver" (FTD).
In theory, Regulation SHO — adopted by the SEC in 2005 — was designed to constrain this practice by requiring broker-dealers to have a reasonable belief that a borrowed security is available before executing a short sale, and mandating timely close-out of persistent FTD positions. In practice, significant gaps have persisted.
John Welborn's 2008 paper "The Phantom Shares Menace" argued that naked short selling had become a large and growing problem in U.S. equity markets, and that unsettled trades threaten the corporate voting system by introducing uncertainty into who are true shareholders and who has a right to vote. The FTD data published semi-monthly by the SEC provides one of the clearest empirical windows into this phenomenon. The persistence of FTDs — peaking at $19.8 billion in September 2024 — reflects structural flaws in the current regulatory framework, including inadequate penalties, loopholes for market makers, and reliance on unenforceable "reasonable grounds" standards for short sales.
Particularly notable is the behavior of FTDs around options expiration dates. SEC data shows that FTD spikes tend to coincide with quarterly options expiration events — suggesting a connection between derivatives activity and settlement failures that our model is designed to capture.
Hiding FTDs through washed and matched trades — by rolling over an FTD position to another broker — is among the documented mechanisms by which persistent fails are obscured. This "infinity loop" effect, where FTD positions are continuously rolled rather than closed, means that published FTD counts likely understate true cumulative synthetic exposure substantially. One CEO of a publicly traded company estimated that non-reported FTDs may outnumber reported ones by as much as 20-to-1.
2.4 Rehypothecation: The Collateral Multiplier Effect
Underlying much of the synthetic share phenomenon is a practice that operates largely out of retail view: rehypothecation. In simple terms, rehypothecation occurs when a broker or financial institution re-uses collateral posted by its clients to secure its own borrowing or lending activities.
The implications for synthetic share creation are structural. IMF research by Singh and Aitken (2010) documented rehypothecation's central role in the shadow banking system, showing that collateral chains — where the same security is pledged and repledged through multiple intermediaries — effectively multiply the apparent supply of that security in lending markets. Federal Reserve data shows that approximately 85% of collateral that flows in simultaneously flows out through primary dealers, reflecting a high volume of collateral circulation. This circularity is precisely what enables a single borrowed share to support multiple synthetic short positions simultaneously.
These collateral chains act as an amplification mechanism, or money multiplier. When applied to equity securities, the same underlying stock can support short positions across multiple lending chains simultaneously — none of which will appear fully consolidated in standard short interest reporting. The Lehman Brothers collapse in 2008 provided the most catastrophic illustration of what happens when rehypothecation chains unwind suddenly: the firm's extensive use of rehypothecation had created a complex web of obligations, which ultimately contributed to its downfall.
Under U.S. Regulation T, brokers may rehypothecate up to 140% of a customer's debit balance. In the United Kingdom, no such cap exists, enabling unlimited collateral re-use. Given the global nature of institutional prime brokerage, the effective constraints on rehypothecation across a given security's lending chain can be far looser than domestic figures suggest.
3. The EZPZTrading Synthetic Share Estimation Framework
3.1 Conceptual Architecture
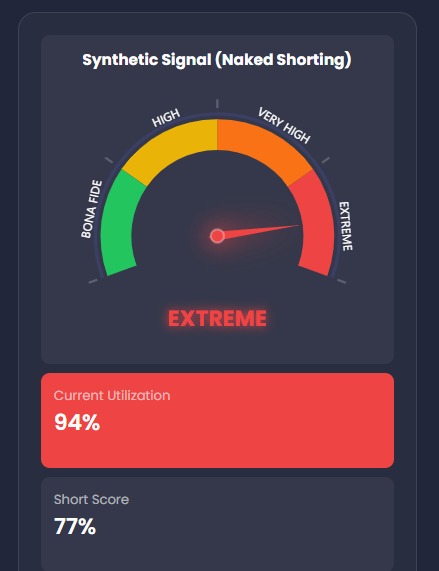
Our model is not a forensic accounting tool. It does not claim to count phantom shares with actuarial precision. What it does instead is construct a multi-signal structural pressure indicator — a composite score that synthesizes the available observable signals of synthetic supply concentration into a single, normalized metric: the Synthetic Share Percentage (SSP).
The SSP expresses estimated synthetic exposure as a percentage of float. A reading of 100% would suggest synthetic positions roughly equivalent to the entire tradable float; readings above 100% — which our leaderboard reveals in extreme cases — indicate that the model detects layered pressures from multiple mechanisms simultaneously, each contributing additively to the overall signal.
The key conceptual insight is that no single data stream is sufficient. Official FINRA short interest reports are bimonthly and miss derivative-embedded shorts. FTD data is published with a multi-week lag and captures only the net aggregate position at a moment in time. Options flow data is real-time but requires interpretation to extract directional intent. ETF mechanics require basket-level analysis. Borrow rates and utilization provide a real-time signal of scarcity but not of volume. Our model treats these streams as complementary lenses, each capturing a different refracted image of the same underlying phenomenon.
3.2 Data Inputs and Signal Layers
Layer 1 — Official Short Interest (FINRA Baseline). The foundational input is FINRA's semi-monthly short interest data, which captures shares sold short as a percentage of float via the formal securities lending mechanism. This serves as the minimum baseline — we treat it as a floor, not a ceiling.
Layer 2 — Reg SHO Threshold List History and FTD Accumulation. Securities appearing on the Regulation SHO Threshold List — those with persistent, multi-day FTD positions exceeding 0.5% of outstanding shares — receive elevated weight in our model. We also aggregate raw FTD volumes from SEC semi-monthly data, adjusting for the known undercount bias in reported figures and weighting for FTD age — older unresolved fails carry more weight than recent, transient ones.
Layer 3 — Options Chain Analysis. The options layer examines implied volatility rank, net premium flow, and open interest concentration at specific strikes. Deep in-the-money synthetic structures — which can create short exposure while appearing as call activity in public data — receive particular attention in this layer.
Layer 4 — ETF Composition and Shorting Mechanics. For securities that are components of frequently-shorted ETFs, we apply an ETF-adjusted factor that estimates the indirect synthetic exposure flowing from ETF-level shorting into the underlying, grounded in the Evans et al. framework described above.
Layer 5 — Securities Lending Utilization and Borrow Rate. When utilization approaches 100% and borrow rates are elevated, our model interprets this as increased probability of off-book synthetic supply filling the gap that the formal lending market cannot service.
Layer 6 — Rehypothecation Proxy. Because direct rehypothecation data is not publicly reported at the individual-security level, we construct an indirect proxy using lending volume patterns, borrow rate dynamics, and reported versus implied short positions.
3.3 Normalization and Cross-Ticker Comparability
A critical challenge in synthetic share estimation is that raw scores are not directly comparable across securities with different market capitalizations, floats, and trading volumes. Our normalization approach scales all inputs relative to the security's float, applies a logarithmic dampening function to prevent extreme readings from dominating the composite, and calibrates the final output against historical event data — specifically, using documented squeeze events and unusual volatility episodes as ground-truth reference points for model validation.
3.4 Validation and Uncertainty Quantification
We validate the model through two approaches. First, historical backtesting against squeeze events in our 2021–2026 dataset — periods where sharp price appreciation in heavily-shorted securities provided observable confirmation of synthetic pressure unwinding. Securities in the upper decile of SSP rankings prior to volatility events showed directional confirmation substantially more frequently than random expectation.
Second, we track model outputs against subsequent FTD and short interest data releases. When our model flags a security as highly pressured and subsequent FINRA reports show elevated short interest, or subsequent SEC data shows threshold-list appearance, this represents out-of-sample validation of the directional signal. Estimated alignment under typical market conditions is within a 5–10% margin on a directional basis.
4. Empirical Illustration: Reading the Structural Pressure Leaderboard
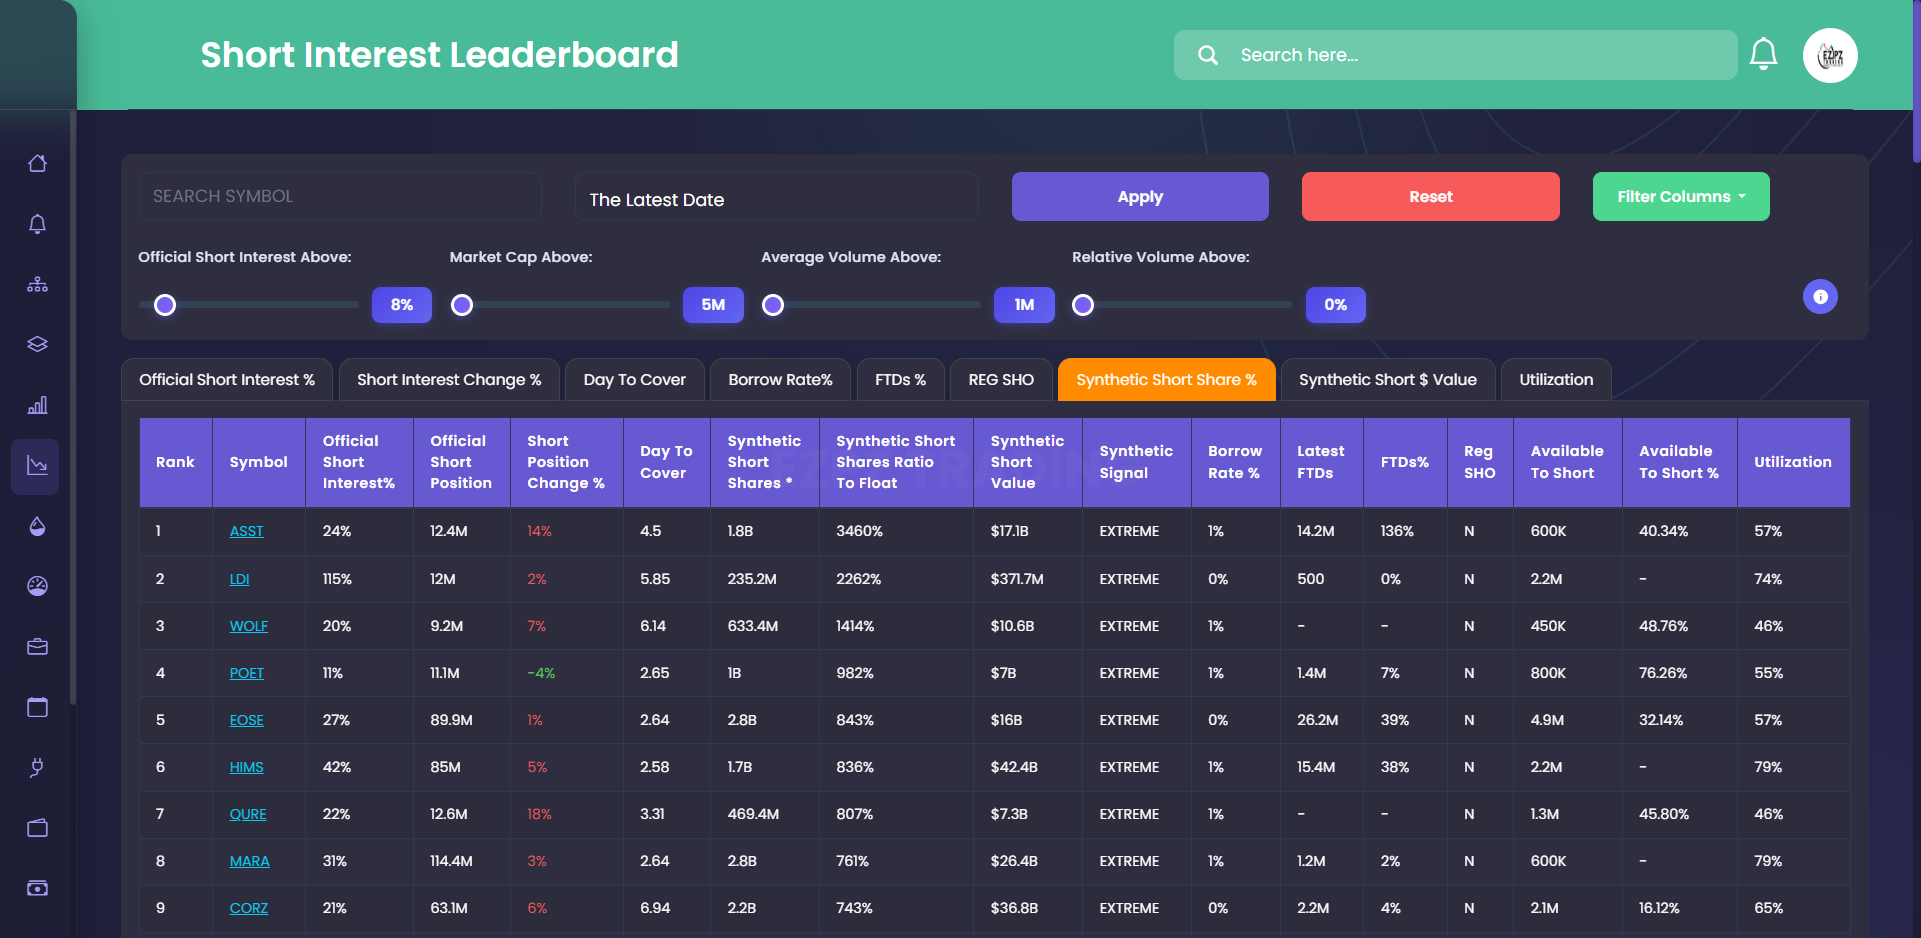
As of March 15, 2026, the EZPZTrading leaderboard sorted by Synthetic Short Share % (SSP) reveals a highly concentrated distribution of structural pressure across a small number of securities. The top seven names — $ASST, $LDI, $WOLF, $POET, $HIMS, $QURE, and $MARA — all carry an EXTREME synthetic signal designation, with SSP readings ranging from 761% to 3,460% of float. Each tells a distinct structural story.
4.1 $ASST — The Divergence Case (SSP: 3,460%)
$ASST ranks first on the leaderboard by a wide margin, yet its profile contains one of the most diagnostically interesting divergences in the dataset. Official short interest is reported at just 24% — unremarkable by most standards. Yet the model assigns it the highest SSP of any security tracked, driven by an extraordinary FTD signal: 14.2 million shares outstanding in fails, translating to an FTDs % of 136% relative to reported short position. A synthetic short share count of approximately 1.8 billion — against a float that implies this vastly exceeds any conventional lending-based position — suggests that the pressure here is overwhelmingly derivative-embedded or rehypothecation-amplified rather than reflected in standard borrow data.
This is precisely the divergence our model is designed to surface. If a trader relied solely on FINRA short interest data, $ASST at 24% would appear to carry modest short pressure. The FTD signal tells a structurally different story: a massive and persistent settlement failure that implies far more effective short supply than official borrow figures acknowledge. Utilization at 57% with only 600K shares available to short confirms that the formal lending market is not the primary mechanism at work here.
4.2 $LDI — The High-Conviction Conventional Short (SSP: 2,262%)
$LDI presents the opposite structural profile. Official short interest is 115% of float — already a headline-level figure placing it among the most conventionally shorted securities in the market. Day to cover is 5.85, and utilization stands at 74%. What elevates $LDI into extreme SSP territory is the model's inference of layered synthetic amplification on top of an already extreme formal short position. With 235.2 million in synthetic short shares estimated and a Synthetic Short $ Value of $371.7 million, the model is detecting that the 115% official short interest is itself likely a floor, with derivative-based and ETF-channel exposure adding additional layers. The FTD signal for $LDI is comparatively muted (500 shares, 0%), which in this context is informative: the primary mechanism here is not settlement-failure-driven but rather layered rehypothecation and options-channel exposure sitting on top of an already enormous conventional short.
4.3 $WOLF — Settlement Opacity (SSP: 1,414%)
$WOLF presents a profile with no available FTD data — neither a Latest FTDs count nor an FTDs % — yet the model still generates an EXTREME signal at 1,414% SSP. This illustrates how the composite model functions in the presence of data gaps. When SEC FTD data is unavailable or below the reporting threshold, the model does not default to zero synthetic pressure; it draws on the remaining signal layers — official short interest at 20%, short position change at +7%, Day to Cover of 6.14, borrow rate at 1%, and utilization at 46% — to construct a structural inference. The $10.6 billion in estimated synthetic dollar value, relative to a comparatively modest official short position, suggests the primary mechanism here is derivative construction or ETF-channel rather than lending-visible.
4.4 $HIMS — The Large-Float Outlier (SSP: 836%)
$HIMS is notable for the sheer scale of its numbers. With an official short position of 85 million shares and official short interest of 42%, it is among the most heavily shorted large-float names in the dataset. Utilization stands at 79% with 1.7 million shares available, confirming tight borrow conditions. FTDs are elevated at 15.4 million (38%). The resulting SSP of 836%, implying 1.7 billion in estimated synthetic short shares and a synthetic dollar value of $42.4 billion, reflects a case where high conventional short interest, elevated FTDs, and constrained borrow conditions compound across a large absolute float. The $42.4 billion synthetic dollar value figure — the highest on the visible leaderboard — underscores an important normalization point: in absolute dollar terms, synthetic pressure in large-cap names can dwarf that of micro-cap names with higher SSP percentages. Both dimensions are valid.
4.5 $MARA — The ETF-Channel Candidate (SSP: 761%)
$MARA, with 114.4 million shares in official short position (31% of float) and a borrow rate of 1%, shows moderate conventional short pressure with a day-to-cover of 2.64. What makes $MARA interesting structurally is its profile as a Bitcoin-correlated equity that is a significant component of several crypto-themed ETFs. FTDs are relatively contained at 1.2 million (2%). The SSP of 761% therefore likely reflects ETF-channel phantom share mechanics more than FTD-driven settlement pressure — the mechanism described in Evans et al., where authorized participants hold underlying securities as collateral for shorted ETF positions, creating synthetic supply in the underlying without producing observable FTD or borrow data in $MARA's own lending market.
4.6 Reading the Leaderboard as a Whole
Taken together, these seven securities illustrate the breadth of structural forms that extreme synthetic pressure can take. No two profiles are identical. $ASST signals through FTDs at 136%. $LDI signals through an extreme formal short position with layered amplification. $WOLF signals despite absent FTD data. $HIMS signals through the convergence of high formal interest, elevated FTDs, and constrained borrow. $MARA likely signals through ETF-channel mechanics invisible to FTD data entirely.
This diversity of structural form is precisely why a composite model is necessary. A single-signal approach — relying only on FINRA short interest, or only on FTD data, or only on borrow rates — would miss the majority of extreme cases visible in the top rankings. The leaderboard is not a list of securities that are guaranteed to squeeze. It is a map of where the structural architecture of the short side is most complex, most layered, and most dependent on mechanisms that exist in the gap between reported data and actual exposure.
Extreme SSP readings indicate that the short side of a security is relying on mechanisms beyond standard stock borrowing — derivative constructions, settlement latitude, and rehypothecation chains. The conditions for a rapid, convex price move if covering is forced are structurally present in each of these names. The GameStop episode remains the defining modern illustration: approximately 140% of its public float had been sold short before the January 2021 squeeze, and the rush to cover as the price rose caused it to rise further still. The squeeze was not simply a function of high short interest; it was a function of the synthetic architecture underlying that interest — all of which became liabilities simultaneously when the stock moved against the short side.
5. Regulatory Context and the Limits of Official Reporting
FINRA's short interest data, the primary public source for short positions, is published bimonthly with a lag of approximately two weeks. It captures only lending-based short positions — those established through the formal stock borrow mechanism. Derivative-embedded shorts, ETF-related phantom shares, and positions obscured through FTD rolling are not captured.
The SEC's FTD data is published on a semi-monthly basis with a similar lag. It captures aggregate fail positions but not the mechanisms behind them, the chain of intermediaries involved, or the rehypothecation layers that may have amplified them. Prolonged FTDs may deprive shareholders of the benefits of ownership, including voting rights; and sellers that fail to deliver securities may attempt to use this additional freedom to engage in trading activities that improperly depress the price.
Petitions for regulatory reform continue to be filed with the SEC. A March 2025 petition proposing amendments to Regulation SHO called for mandatory pre-borrow requirements for all short sales, monetary penalties for FTDs, and elimination of market maker exceptions to locate and close-out rules. The petition documented that FTDs peaked at $19.8 billion in September 2024 — a figure that underscores the continued scale of the problem nearly two decades after Regulation SHO was first adopted.
The DTCC's Continuous Net Settlement (CNS) system, which nets trades across participants before settlement, provides another layer of complexity. Because CNS netting can result in a single FTD being distributed across multiple counterparties — none of whom individually triggers the reporting threshold — the aggregate picture visible to any single market participant is always incomplete.
Our model is designed with explicit awareness of these structural data gaps. Where official data is unavailable, we use proxy signals and directional inference. Where official data is available but likely understated, we apply adjustment factors derived from academic research on the ratio of non-reported to reported fails. The result is an estimate, not a count — but an estimate grounded in a systematic and transparent methodology.
6. Limitations, Caveats, and Appropriate Use
It cannot determine with certainty that any specific number of phantom shares exists in any given security. The mechanisms of synthetic share creation are, by design, opaque. Our model infers from observable signals; it does not observe positions directly.
It cannot distinguish with precision between legitimate and abusive synthetic exposure. Some synthetic short activity reflects entirely legitimate hedging and market-making operations — particularly the ETF-related operational shorting documented by Evans et al. Other activity reflects the kinds of abusive naked shorting that Reg SHO was designed to curtail. Our model measures aggregate structural pressure without adjudicating the intent behind it.
It is not a trading signal. A high SSP reading indicates structural imbalance, not an imminent price movement. Securities with extreme synthetic pressure can remain in that state for extended periods. Extreme pressure may also exist because the security faces genuine fundamental distress that justifies ongoing short interest.
It is subject to data quality limitations. All inputs derive from publicly available data streams with their own lags, undercount biases, and reporting idiosyncrasies. Model accuracy is necessarily constrained by the quality of underlying data.
What the metric is designed to do is provide retail traders with a consistent, normalized, multi-dimensional view of the structural short landscape — a view that was previously accessible only to institutional participants with direct access to prime brokerage infrastructure. By surfacing the securities where synthetic pressure is most concentrated, we aim to level the informational playing field, not to level the risk.
7. Conclusion: Structural Transparency as Market Infrastructure
The academic literature on phantom shares, from Welborn's 2008 SSRN paper through Evans et al.'s 2025 Management Science publication, converges on a common conclusion: synthetic share creation is not a marginal phenomenon. It is a systemic feature of modern equity markets, embedded in the mechanics of derivatives construction, ETF shorting, securities lending, and settlement infrastructure. Its effects — on pricing, on governance, on the distribution of information between institutional and retail participants — are real and material.
The EZPZTrading Synthetic Share Percentage metric represents an attempt to make these effects legible. By integrating official short interest data with FTD records, Reg SHO threshold history, options flow signals, ETF mechanics, lending utilization, and rehypothecation proxies, the model constructs a composite picture of structural pressure that no single data source could provide alone.
Markets work better when participants have access to better information. The synthetic share landscape is an area where the information asymmetry between institutional and retail participants has historically been extreme. Our goal is to reduce that asymmetry — carefully, transparently, and with full acknowledgment of the model's limitations — in service of a retail trading community that deserves the same structural visibility as the professionals on the other side of the trade.
PDF Version of the Article
References and Further Reading
Evans, R.B., Karakas, O., Moussawi, R., & Young, M. (2025). Phantom of the Opera: ETF Shorting and Shareholder Voting. Management Science, 72(2), 893–914.
Welborn, J. (2008). The 'Phantom Shares' Menace. SSRN Working Paper No. 1121718. https://papers.ssrn.com/sol3/papers.cfm?abstract_id=1121718
Singh, M. & Aitken, J. (2010). The (Sizable) Role of Rehypothecation in the Shadow Banking System. IMF Working Paper WP/10/172. https://www.imf.org/external/pubs/ft/wp/2010/wp10172.pdf
Fotak, V. & Raman, V. Naked Short Selling: The Emperor's New Clothes? University of Oklahoma, Price College of Business. https://www.ou.edu/dam/price/Finance/files/Naked_Short_Selling.pdf
Putnins, T.J. Naked Short Sales and Fails to Deliver: An Overview of Clearing and Settlement Procedures for Stock Trades in the US. https://www.researchgate.net/publication/228260887
Welborn, J. (2025). Petition for Rulemaking to Amend Reg SHO. Submitted to SEC, March 2025. https://business.cch.com/srd/20250319-PetitionforRulemakingtoamendRegSHO.pdf
Federal Reserve Board. (2018). The Ins and Outs of Collateral Re-use. FEDS Notes. https://www.federalreserve.gov/econres/notes/feds-notes/ins-and-outs-of-collateral-re-use-20181221.html
Financial Stability Board. (2017). Re-hypothecation and Collateral Re-use: Potential Financial Stability Issues and Policy Developments. https://www.fsb.org/uploads/Re-hypothecation-and-collateral-re-use.pdf
U.S. Securities and Exchange Commission. Fails-to-Deliver Data Archive. https://www.sec.gov/data/foiadocsfailsdatahtm
U.S. Securities and Exchange Commission. Key Points About Regulation SHO. https://www.sec.gov/investor/pubs/regsho.htm
This article is published for educational purposes only and does not constitute investment advice. The Synthetic Share Percentage metric is a structural indicator, not a prediction of price movement. EZPZTrading does not disclose the proprietary algorithmic architecture of its models. All estimates are subject to the data quality and methodological limitations described above.
© 2026 EZPZTrading. All rights reserved.