






Multi Timeframe Volume Profile & FVGs FREE
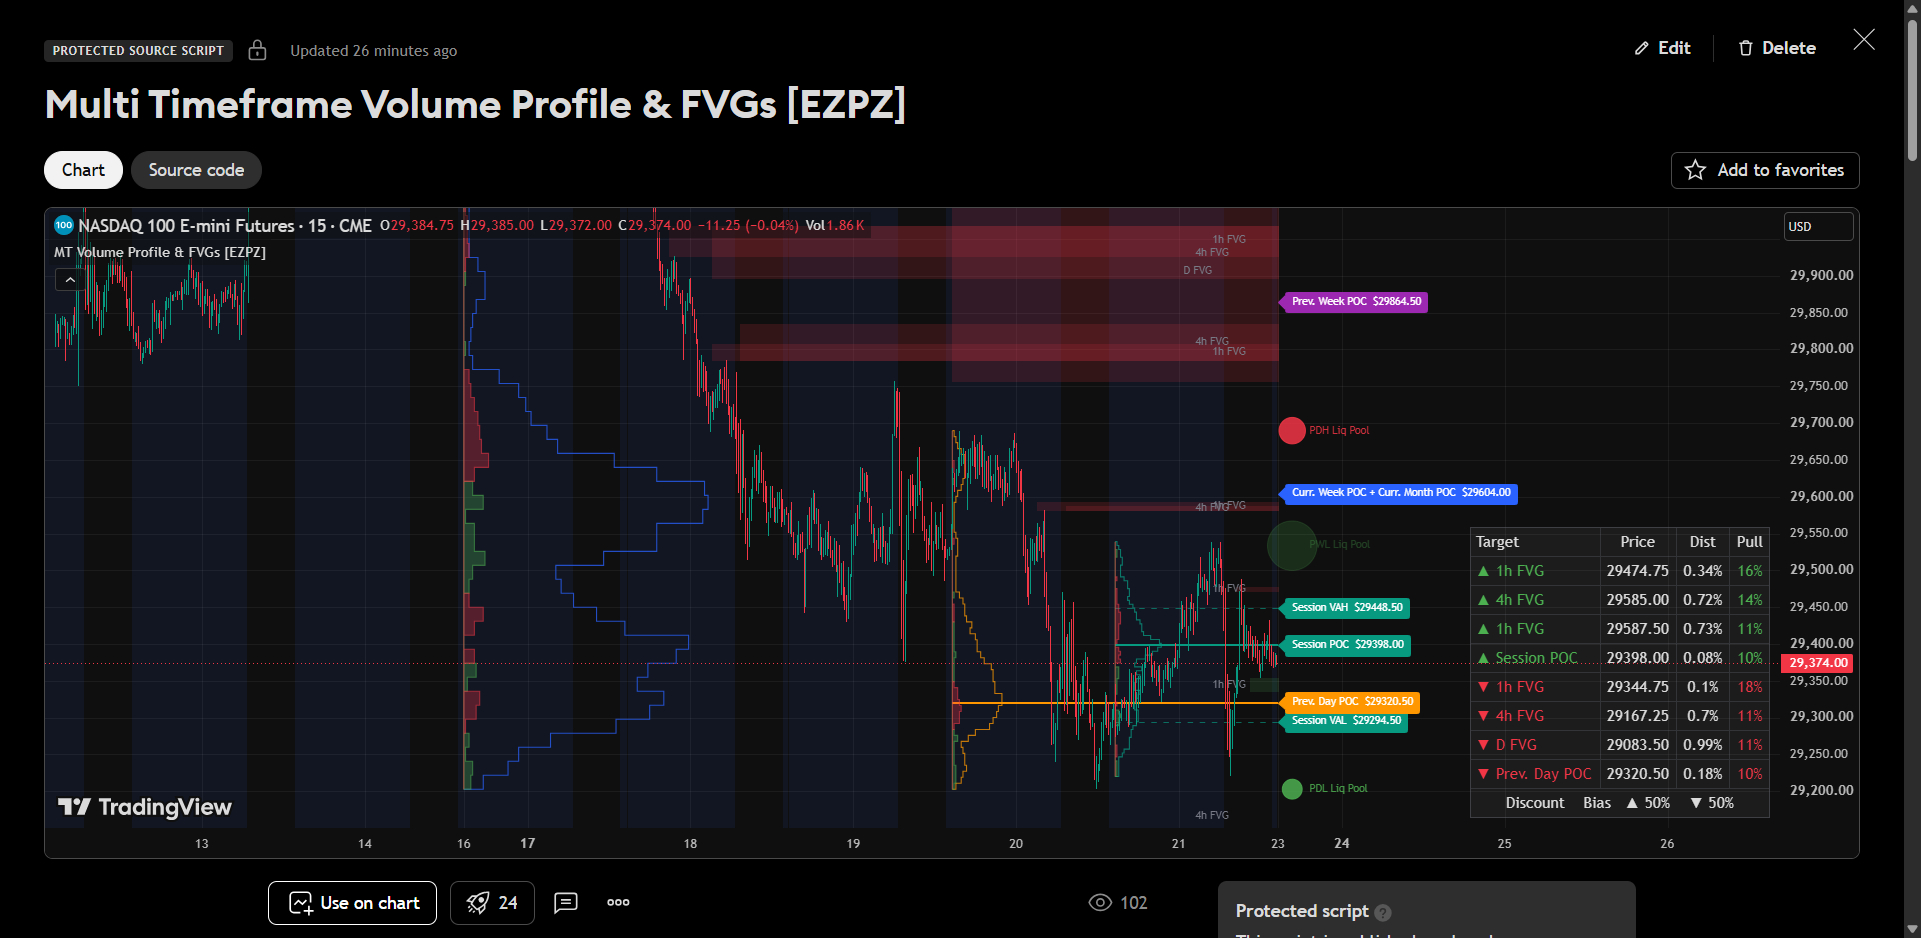
Multi Timeframe Volume Profile & FVGs — Sessions / Prev. Day / Weekly / Monthly / YTD + Delta + Targets Table
What this indicator does
This indicator combines three tools that traders commonly use together but rarely find in one script: a multi-anchor volume profile suite with volume-delta sentiment, a multi-timeframe Fair Value Gap tracker, and a targets table that ranks the nearest of these levels as price magnets. The combination is deliberate: volume profile levels (POC, VAH, VAL) describe where the market accepted price, volume delta shows who was in control at each price, and Fair Value Gaps mark where price moved too fast to trade. The built-in level merging and the targets table then tie all of it together by highlighting where levels from different periods stack into confluence and which of them sit closest to current price.
It draws volume profiles for any combination of:
Up to 5 custom trading sessions (e.g. Asia, London, New York), each with its own on/off checkbox, editable name, time window and individual Value Area toggle. Checked sessions can be drawn individually or merged into ONE composite session profile.
Previous Day (fixed range)
Current Week and Previous Week
Current Month and Previous Month
Year-To-Date
Each profile renders a horizontal volume histogram over its range, plus its Point of Control (POC) and optional Value Area High / Low (VAH / VAL) lines extended to the right edge of the chart, each ending in a price label (e.g. "Prev. Day POC $766.50"). Value areas can be enabled or disabled per profile, including per individual session.
Key features
Volume sentiment (delta). A display dropdown offers three modes. "Volume" is the classic profile. "Delta" replaces the histogram with per-price-row net delta bars — green rows where estimated buying dominated, red where selling dominated. "Both" draws the volume outline with the color-coded delta bars inside it, so each profile shows how much traded at every price AND who was in control there. Delta is estimated from candle structure (the position of the close within each bar's range: close at the high counts as buying, at the low as selling); it does not use bid/ask tick data, so treat it as a sentiment approximation.
Level merging (confluence detection). When POCs (or, optionally, any levels) from different profiles land within an adjustable percentage of each other, they are drawn as a single, slightly thicker line with a combined label such as "Curr. Week POC + Prev. Month POC $769.25". Tolerance and merge mode (POC-only or all levels) are settings.
Developing POC. Optional developing Daily, Weekly and Monthly POC lines, plotted bar by bar and resetting at each period boundary, showing how the period's point of control migrated intraperiod.
Multi-timeframe Fair Value Gaps. Tracks gaps on the chart timeframe plus up to four higher timeframes, each with its own checkbox, editable FVG / iFVG label text, and an individual label distance (in bars, measured inward from the box's right edge) so that labels from overlapping timeframes do not sit on top of each other. Detection: a bullish FVG forms when a candle's low is above the high two candles back; bearish when the high is below the low two candles back. Options include wait-for-candle-close confirmation, fill detection by Close or Wick, partial-fill shrinking (boxes trim to the unfilled remainder as price wicks into them), delete-on-fill, or conversion of filled gaps into inverted FVG zones (iFVG) that remain until price closes through their far side. FVG label size and color are configurable. Alerts are provided for new bullish and bearish gaps on the chart timeframe.
Nearest Targets table (off by default). An optional table that lists the strongest nearby upside and downside levels — POCs and live FVGs — with their price, distance, and a "Pull %" ranking, plus an overall up/down bias row. Important: the Pull % is a CONFLUENCE SCORE, not a statistical probability. Each level is scored as timeframe weight × magnet bonus × proximity: higher-timeframe levels (Prev. Day, Week, Month, YTD) carry more weight than session levels; unfilled bullish FVGs below price and bearish FVGs above price receive a gap-fill magnet bonus (price tends to return and fill such gaps); POCs receive a value-magnet bonus; and closer levels outscore distant ones, with the falloff controlled by a distance-sensitivity setting. Every weight and bonus is exposed in settings so the scoring can be tuned per instrument. The score is then normalized across the displayed targets so they sum to 100%. It is a consistent way of ranking confluence — it does not predict that price will reach any level.
How it works
Volume profiles are built by distributing each bar's volume proportionally across the price rows its high–low range overlaps (adjustable row count); delta is distributed the same way using each bar's estimated buy/sell split. The Value Area expands outward from the POC row, always absorbing the larger neighboring row, until the configured percentage of total volume (default 70%) is covered. All profiles are computed only on the last bar and each histogram is drawn as a single polyline, keeping the script far below Pine's drawing-object limits even with every profile and delta mode enabled. Profiles spanning very long ranges (Monthly, YTD on low timeframes) are automatically downsampled — consecutive bars are aggregated into chunks before binning — so computation stays within Pine's runtime limits with negligible visual difference. Higher-timeframe FVGs are detected with request.security on each enabled timeframe and drawn as boxes anchored at the detection bar.
How to use it
In "Session Profiles", check the sessions you trade, set their times and per-session VA toggles (session timezone is an input; default America/New_York). Choose whether to combine them into one composite profile.
In "Period Profiles", toggle the periods you want. Each row has its own VA checkbox and color.
Pick a profile display mode in "Volume Sentiment (Delta)": Volume, Delta, or Both.
Set the merge tolerance to something meaningful for your instrument (default 0.15% of price).
Optionally enable developing POCs, the FVG timeframes you want (with staggered label distances such as 0 / 10 / 20 / 30 to keep overlapping labels readable), and the Nearest Targets table.
Typical uses: treating merged multi-period POCs as high-interest support/resistance, reading delta inside a profile to judge whether a high-volume node was accumulation or distribution, fading moves into prior value areas, watching the developing POC for acceptance shifts, using higher-timeframe FVGs as retracement targets, and using the targets table as a quick confluence scan of the nearest magnets above and below price.
Limitations and notes
The volume distribution within each bar is an approximation based on the bar's range, and delta is estimated from candle structure; neither uses tick or bid/ask data.
The targets table's Pull % and Bias are heuristic confluence rankings derived from the user-configurable weights described above. They are not probabilities and carry no predictive guarantee.
Long-range profiles (Monthly, YTD) are limited by the chart history your TradingView plan provides on low timeframes; on 1m–5m charts they may cover only part of the intended period. Use 15m or higher for complete monthly/YTD profiles.
The indicator requires a symbol with volume data.
Without "wait for candle close", FVGs on the developing higher-timeframe candle can adjust until that candle closes.
This indicator is a charting tool for analysis only. It does not generate buy/sell signals and nothing about it constitutes financial advice. Past behavior of price around these levels does not guarantee future results.