How to read the Dark Pool Index (DIX): latest reading, 7-day vs 30-day average and the history table
The latest DIX reads 49.938%, above both its 7-day average of 47.8% and 30-day average of 48.6%. The Trend (7D) pill still shows ▼ -0.8%. Here is how to read every panel of the Dark Pool Index tab.
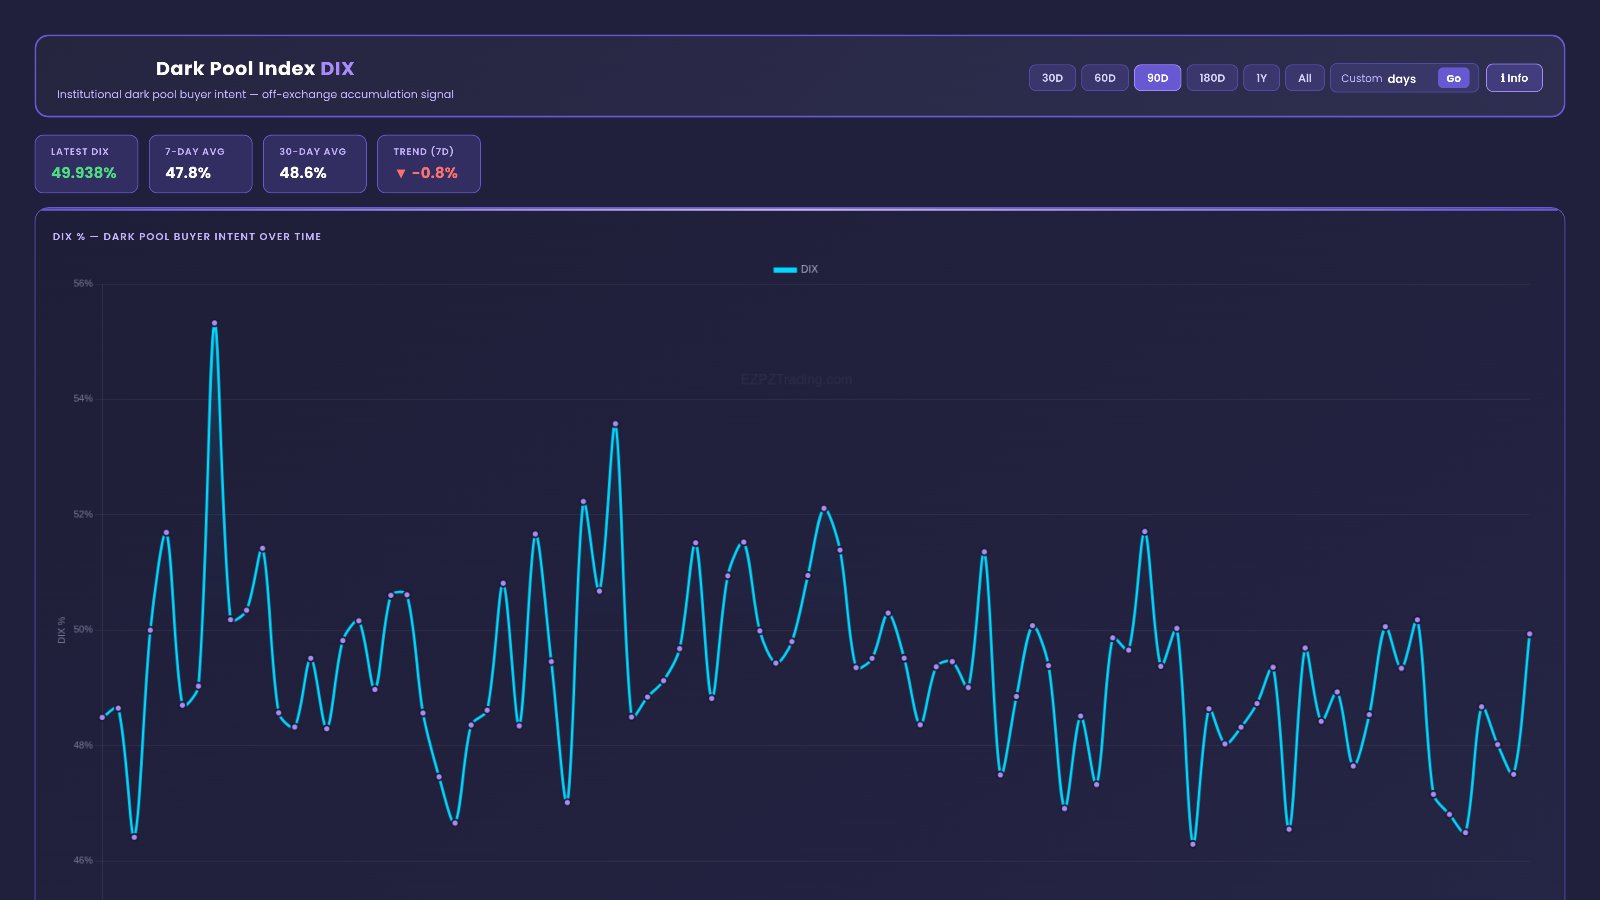
In the latest data, the Dark Pool Index reads 49.938%. That beats its 7-day average of 47.8% and its 30-day average of 48.6%, yet the Trend (7D) pill still shows ▼ -0.8%. One strong day sits on top of a soft week. Telling those two apart is the whole skill this tab teaches.
You can follow along on the live Dark Pool Index (DIX) page. No account? The free delayed DIX page shows the same layout.
Quick definition first. A dark pool is a private place where big orders trade away from the public order book. The Dark Pool Index (DIX) is one number per trading day for the whole market. It shows what share of dark pool volume was marked as buy-side. Buy volume is the buy-side part. Total volume is all the dark pool volume that day. DIX % is the buy-side share, shown as a percentage. A higher reading means buyers took a bigger slice of the hidden tape. EZPZ's method is proprietary.
49.938%
47.8%
-0.8%
The idea behind the Dark Pool Index
Most dark pool pages show single prints or single tickers. DIX zooms all the way out. It answers one question each day: across the whole market, did buyers take a large or small share of dark pool volume?
Why a market-wide number helps
Big funds often work orders slowly and out of sight. One print tells you little. A daily share of buy-side volume, tracked over weeks, shows whether that hidden buying is broad and steady or thin and fading. Swing traders use it as a backdrop. It tells you what kind of tide the big names are swimming in.
Levels versus direction
The tab gives you two kinds of reading:
- Level: how high or low DIX is on a given day. A reading near half means buyers and sellers split dark pool volume about evenly.
- Direction: whether recent days run above or below the past month. The 7-day and 30-day averages and the Trend pill show this.
A change of direction is often more useful than the level. A slow slide in the 7-day average says something different from one loud day.
Confirmation and divergence
DIX works best next to price. If DIX climbs while the market drifts lower, buy-side share is rising under a weak tape. If DIX sinks during a rally, buy-side share is thinning while prices rise. Those gaps are readings, not signals of what comes next.
Walking through the tab, top to bottom
The tab has two parts. The top panel holds the range controls, four stat pills and the chart. Below it sits the historical data table.
Dark Pool Index DIX
The header reads "Institutional dark pool buyer intent — off-exchange accumulation signal." Everything in this panel follows the date range you pick.
Range controls. A row of buttons sets how much history the chart and table show:
- 30D, 60D, 90D, 180D, 1Y – show the last 30, 60, 90 or 180 days, or one year. The latest data is set to 90 days.
- All – shows the full history the page holds.
- Custom and Go – pick your own start and end dates, then press Go to apply them.
- ℹ Info – opens a short explainer about the page.
Short ranges help you see the last few weeks in detail. Long ranges show whether the latest level is normal or unusual for the series.
The four stat pills.
- LATEST DIX – the most recent daily reading. Now: 49.938%.
- 7-DAY AVG – the average DIX over the last week of readings. Now: 47.8%.
- 30-DAY AVG – the average over the last month. Now: 48.6%.
- TREND (7D) – compares the 7-day average with the 30-day average. Now: ▼ -0.8%. A down arrow means the week runs below the month. An up arrow means the reverse.
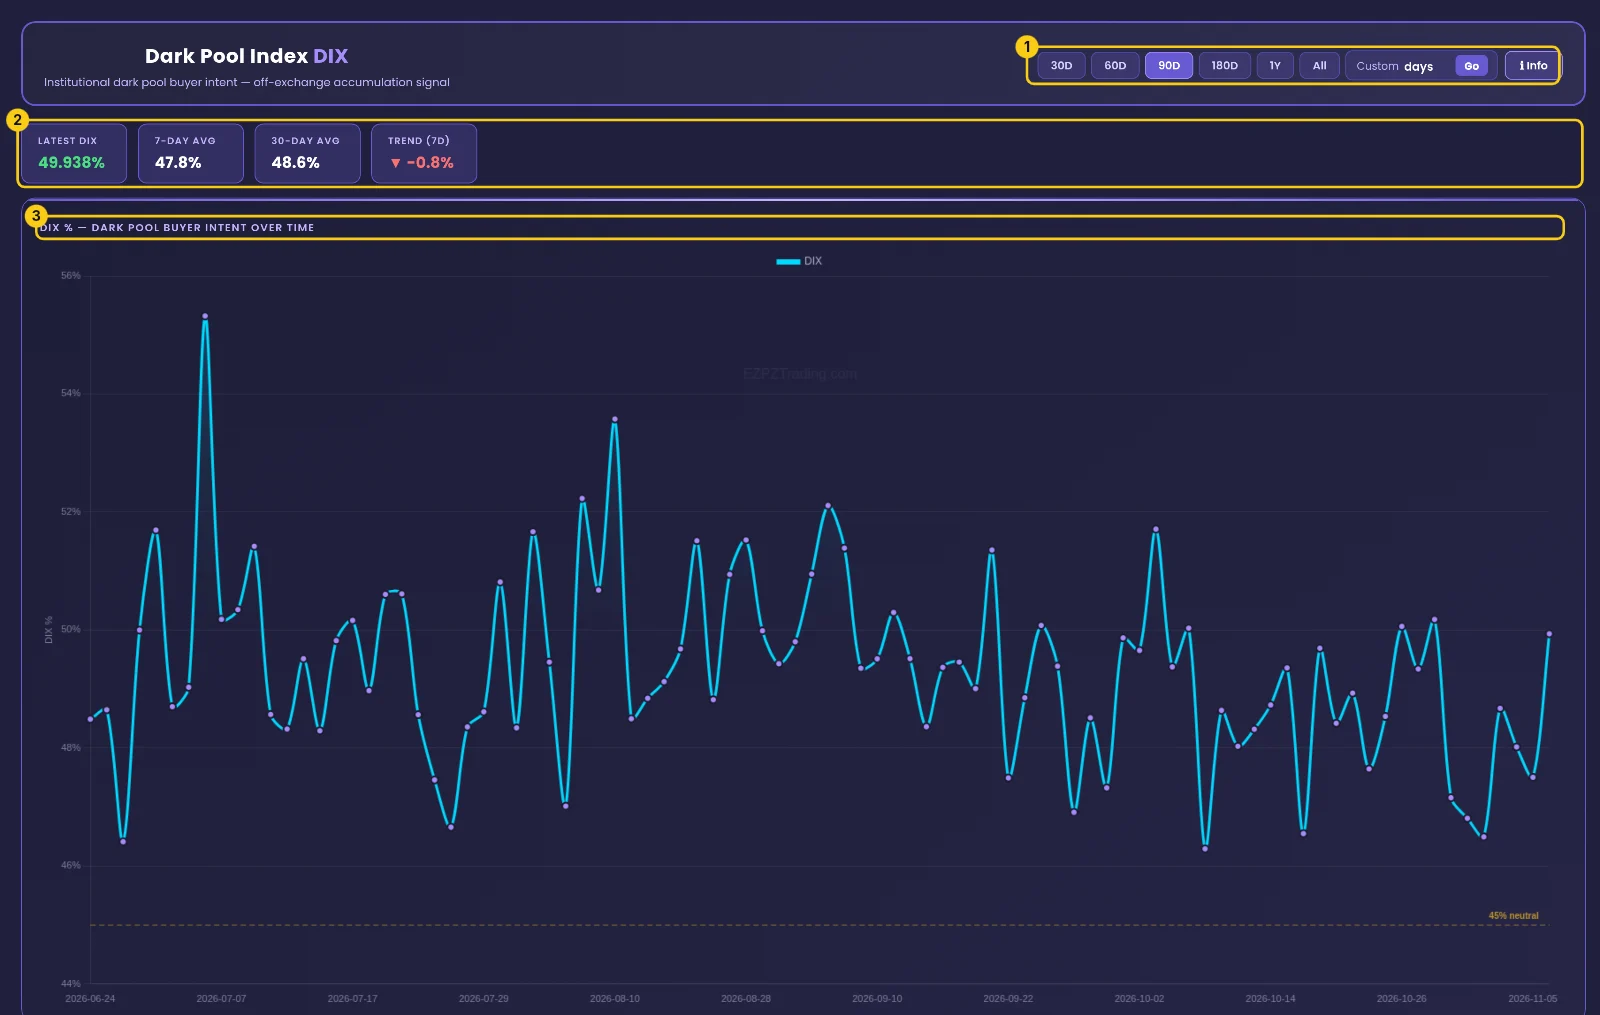
Read the four together. In the latest data, the newest day is the strongest of the three readings. But the week as a whole sits under the month. So the Trend pill stays red even after a strong day. One day can lift Latest DIX fast. The averages move slower, which is why they matter for direction.
DIX % — DARK POOL BUYER INTENT OVER TIME. This line chart plots DIX % by date across your chosen range. Look at the shape, not single points. A run of days stepping higher or lower tells you more than one spike. Change the range and the chart redraws.
Here are the ten newest daily readings from the table below the chart:
DIX % by day
The story in these bars is easy to read. Late October opened with readings like 50.0628% and 50.1811%. Then DIX slipped, with the low of these ten rows at 46.4953% on 2026-11-02. The newest row bounced to 49.938%. That pattern of strong, then soft, then a bounce is exactly what the averages and Trend pill sum up.
HISTORICAL DATA
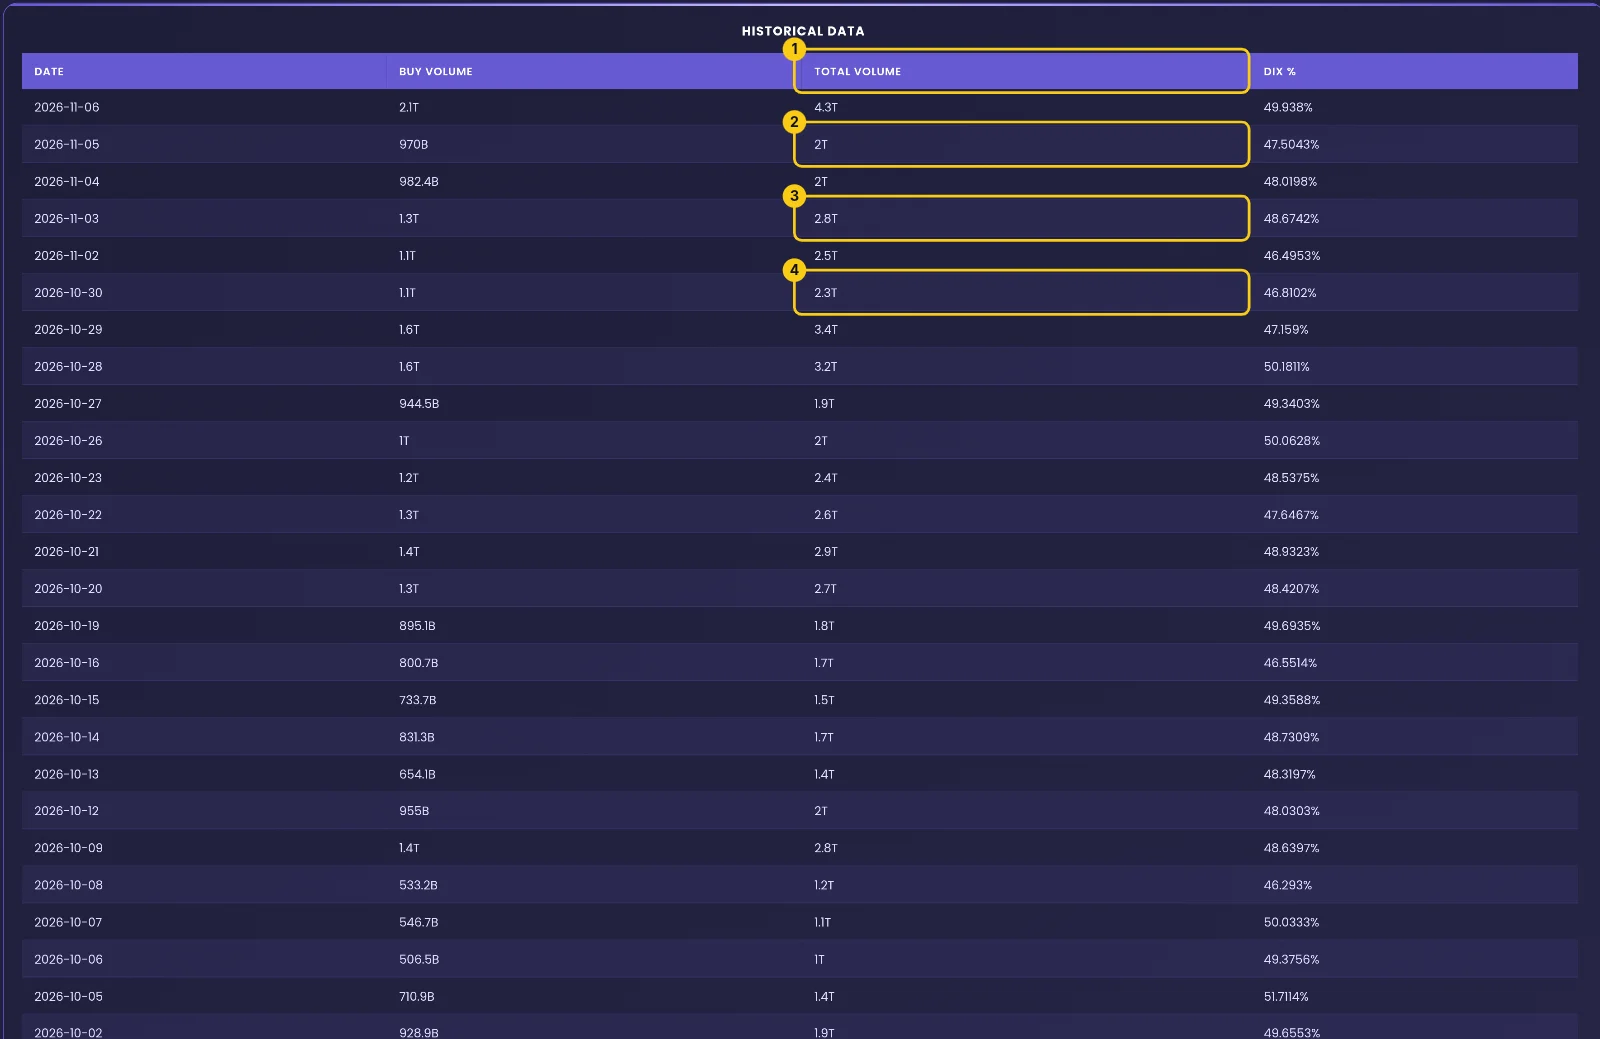
The table lists one row per trading day, newest first. It follows the same range as the chart. Four columns:
- DATE – the trading day. Weekends do not appear, so 2026-10-30 is followed by 2026-11-02.
- BUY VOLUME – the dark pool volume marked as buy-side that day, in short form (B for billions, T for trillions). Bigger means more buy-side activity in raw size.
- TOTAL VOLUME – all the dark pool volume that day. This shows how busy the day was.
- DIX % – the buy-side share of the day's dark pool volume. This is the number the chart plots.
Now read two rows across.
2026-11-06: BUY VOLUME 2.1T, TOTAL VOLUME 4.3T, DIX % 49.938%. This is the busiest day in the visible rows by a wide margin. Total volume is more than double that of 2026-11-05. Buyers also took a solid share. A high DIX on a heavy day carries more meaning than the same DIX on a quiet day.
2026-11-05: BUY VOLUME 970B, TOTAL VOLUME 2T, DIX % 47.5043%. A lighter day with a softer share. Compare it with 2026-10-28: 1.6T of buy volume on 3.2T total and a DIX % of 50.1811%, the highest reading among the visible rows. Volume and share were both stronger then.
The habit is simple. Always read DIX % next to TOTAL VOLUME. The share tells you who led. The volume tells you how much was at stake.
How to use the Dark Pool Index on EZPZ: a 3-minute routine
This is the exact routine, with the real screens from the latest data. The yellow numbers show where to look.
Set the range and read the four pills
Open the Dark Pool Index page. Use the range buttons (1) to choose your window: 30D, 60D, 90D, 180D, 1Y, All, or Custom with Go. Then read the stat pills (2): LATEST DIX 49.938%, 7-DAY AVG 47.8%, 30-DAY AVG 48.6% and TREND (7D) ▼ -0.8%. The newest day is strong, but the week still runs below the month. Finally, scan the chart (3), DIX % — DARK POOL BUYER INTENT OVER TIME, for runs higher or lower rather than single spikes.
Check how heavy each day was
Scroll to the HISTORICAL DATA table and look at the TOTAL VOLUME column (1). Two recent days show 2T (2), on 2026-11-05 and 2026-11-04. 2026-11-03 shows 2.8T (3) and 2026-10-30 shows 2.3T (4). Next to these, the 4.3T on 2026-11-06 stands out as the heaviest day in view. That tells you the latest 49.938% came on real size, not a quiet tape.
Check again before the close
Come back after a new row posts. Check whether the Trend pill arrow has flipped and whether the 7-DAY AVG has moved closer to the 30-DAY AVG. A flip in the arrow is the change of direction swing traders care about most.
Reading the page in plain English
Put the pills, chart and table together and the tab reads like a short sentence about hidden buying across the market. In the latest data it says: "Buyers took a solid share on a very heavy day, but the past week ran softer than the past month."
- If Latest DIX is above both averages but the Trend pill is down, the page reads as one strong day inside a cooler week. That is the current picture.
- If the 7-DAY AVG climbs above the 30-DAY AVG and the arrow turns up, the page reads as buy-side share picking up recently.
- If DIX % stays high for several rows on large TOTAL VOLUME, the page reads as broad, heavy buy-side activity.
- If DIX % spikes on a light TOTAL VOLUME day, the page reads as a strong share on thin size, worth less on its own.
- If DIX rises while the broad market falls, the page reads as a divergence: buy-side share growing under a weak tape.
What this data cannot tell you
- Direction. A high DIX describes who led dark pool volume. It does not say where prices go next.
- Timing. The tab shows one reading per day. It cannot tell you when within a day the buying happened or when any move might start.
- Which stocks. DIX is a single market-wide number. It does not show which tickers drew the buying. For that, use the per-ticker and per-print dark pool pages.
Common mistakes
- Reading one day as a trend. 49.938% looks strong, but the Trend pill still shows ▼ -0.8%. Check the averages first.
- Ignoring total volume. The same DIX % means more on a 4.3T day than on a 1.9T day.
- Treating DIX as a ticker signal. It covers the whole market, not SPY, NVDA or any one name.
- Using only one range. A 30D view can hide whether the current level is normal over 1Y or All.
- Reading it alone. DIX is most useful next to price action, as confirmation or divergence.
Tools used in this post
These EZPZ tools pair well with the Dark Pool Index, from the market-wide reading down to single tickers and prints.
Which plan you need
| Tool | Plan | Free delayed page |
|---|---|---|
| Dark Pool Index (DIX) | Premium | Yes |
| $1M+ Premium Dark Pool Flow | Pro | None |
| $1M+ DP Volume Flow | Pro | None |
| Bearish Dark Pool Net Premium | Pro | Yes |
| Block Trades Sentiment | Pro | Yes |
| Bullish Dark Pool Net Premium | Pro | Yes |
FAQ
What does DIX measure?
The share of dark pool volume marked as buy-side each trading day, across the whole market. The latest reading is 49.938%.
Why is the Trend pill down when the latest DIX is high?
The Trend (7D) pill compares the 7-day average (47.8%) with the 30-day average (48.6%). One strong day does not lift a soft week above the month, so it still reads ▼ -0.8%.
Is DIX about one stock?
No. It is a single market-wide series. For individual tickers or prints, use the other dark pool pages, such as Block Trades Sentiment.
What do the T and B mean in the table?
They shorten large volumes: T for trillions and B for billions. For example, 2026-11-05 shows 970B of buy volume on 2T of total volume.
Which range should I use?
Use 30D or 60D for recent detail and 1Y or All for context. Custom with Go lets you pick exact dates.
Can I see DIX without an account?
Yes. The free delayed DIX page shows the same panels on a delay.