
Learn Center
Bearish Dark Pool Net Premium
A leaderboard of tickers with the largest estimated net selling pressure in their off exchange volume, ranked from most bearish on down.
What is bearish dark pool net premium?
Bearish dark pool net premium is a session leaderboard of names with the largest negative Net Premium in off-exchange activity. Each row is one Symbol with Total Premium, Buy Premium, Sell Premium, Net Premium, Price, and DP Vol. The table starts sorted by Net Premium, low to high. It is a rank, not a tape and not a short list.
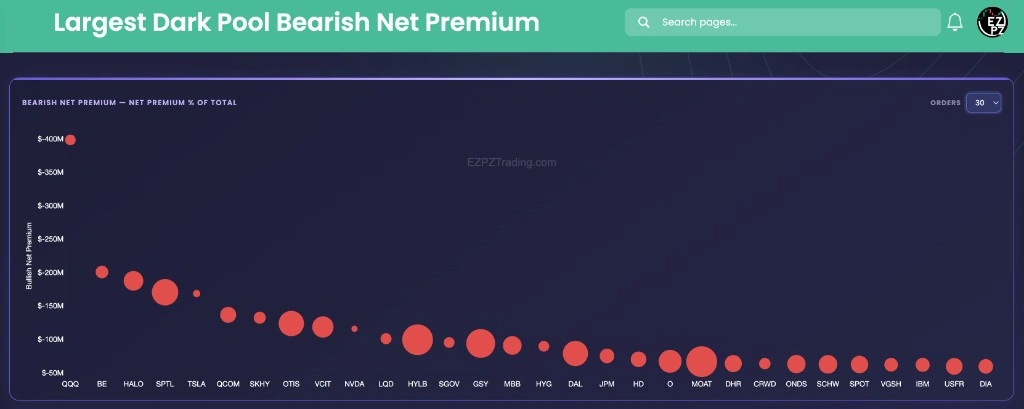
Dark pool prints still hit the public tape after the fill. This page does not show those prints one by one. It ranks symbols by Net Premium so you can see which names have the largest leftover after Buy Premium. The chart card is labeled Bearish Net Premium, Net Premium % of Total. The left axis still says Bullish Net Premium. Each red dot is a Symbol. Dot size is that Net Premium share of Total Premium. Hover a dot for Bullish Net Premium and the percent. Use Orders to keep 5, 10, 15, 20, 30, or All names on the chart. The page starts at 20. The table still holds the full rank. Total Premium can be huge on a busy product while Net Premium is small. Buy Premium and Sell Premium sit on the same row so you can see both sides. Red Net Premium is a lean, not proof of distribution.
On EZPZ, the live chrome titles the page Largest Darkpool Bearish Net Premium. The Learn title is Bearish Dark Pool Net Premium. The table starts sorted by Net Premium, most negative first. There is no ticker search on this page. Largest Dark Pool By Ticker is one row per symbol sorted by Total Premium, not Net Premium. Largest Single Dark Pool Trades ranks one print at a time. Dark Pool Sectors rolls those names into industry-group bars. Dark Pool Top Levels groups one ticker's prints by price. Daily Dark Pool Amount plots one ticker's Amount (M) against Price by Date. Dark Pool Movers and Shakers is SPY Price versus running Buy Amount and Sell Amount. Dark Pool Net Flow is one ticker's Buy Amount versus Sell Amount plus Volume bars. Dark Pool Sentiment is Cumulative Net Amount (M) bars by Date. Block Trades Sentiment is Buy Premium (M) versus Sell Premium (M) by Date, plus Volume Sentiment. Dark Pool Index (DIX) is a market-wide gauge, not a ticker list. Dark Pool Indicator (DPI) is pressure versus the 20-day average, not a ticker rank. Bullish Dark Pool Net Premium is the buy-side rank of the same Net Premium figure. Dark Pool Flow is the all-ticker off-exchange tape. SPY Flow locks that tape to SPY. DarkVol Leaders ranks names by DarkVol Ratio %. Live Flow is listed options prints.
How Bearish Dark Pool Net Premium works on EZPZ
Each row is one ticker's session total. It is not a score. Most people start with Symbol and Net Premium, then read Sell Premium against Buy Premium. If a name looks large only because Total Premium is always busy, click another header. Use the chart when you want Net Premium and Net Premium % of Total in one picture. Change Orders if the chart is crowded. Then open a tape page if you want the prints behind the total.
How this differs from the bullish rank and Total Premium boards
Bullish Dark Pool Net Premium ranks the same session by Net Premium, high to low, and plots only green dots. This page sorts Net Premium low to high and plots only red dots. Use the bullish board when you want the buy-side leftover. Use this page when you want the sell-side leftover. Largest Dark Pool By Ticker ranks the same session by Total Premium. A busy product can lead Total Premium while sitting lower here. Largest Single Dark Pool Trades keeps the biggest individual prints. A name can lead Net Premium here with many smaller prints and never appear on that list. Dark Pool Sectors is Highest Premium Inflow and Highest Volume Inflow, then Premium vs Volume bars, not a Net Premium rank. Dark Pool Top Levels stays on one ticker and stacks that name's prints by price. Daily Dark Pool Amount is Amount (M) versus Price by Date on one ticker. Dark Pool Movers and Shakers is SPY Price versus running Buy Amount and Sell Amount. Dark Pool Net Flow is one ticker's Buy Amount versus Sell Amount plus Volume bars. Dark Pool Sentiment is Cumulative Net Amount (M) bars by Date. Block Trades Sentiment keeps buy and sell as two bars per Date. Dark Pool Index (DIX) rolls the market into one number. Dark Pool Indicator (DPI) is pressure versus the 20-day average. Dark Pool Flow is the live tape. Live Flow is options, not equity dark pool totals.
Anatomy of a ticker row
Read a row left to right: the symbol, then how large the session was, then the buy versus sell split. You do not need every column on every name. Click a header to change the sort. Net Premium is the starting rank, most negative first.
These columns answer which name you are looking at, and at what price.
| Column | What you are looking at |
|---|---|
| Symbol | The ticker. There is no search box on this page. Scan or sort the list instead. |
| Price | The price shown on the row. Use it to judge whether Net Premium came from expensive shares or from lots of cheaper ones. |
These columns help you decide if the sell-side leftover is large enough to spend time on.
| Column | What you are looking at |
|---|---|
| Total Premium | Session off-exchange notional for that ticker. A huge Total Premium with a small Net Premium is a busy name, not a lopsided one. |
| Buy Premium | Labeled buy-side notional on the row. |
| Sell Premium | Labeled sell-side notional on the row. |
| Net Premium | The leftover after Buy Premium. This is the default sort, low to high, and the Y axis on the chart. The table draws it in red. |
These columns help you judge how the notional was built.
| Column | What you are looking at |
|---|---|
| Total Size | Share size added up for the session. |
| Total Trade Count | How many dark pool trades went into the total. A huge Net Premium with a small count is chunkier than the same net across many prints. |
| DP Vol | Dark pool volume on the row. Compare it to how large Net Premium looks so you are not reading dollars alone. |
Bearish Net Premium chart
The chart card is labeled Bearish Net Premium, Net Premium % of Total. It uses the same session totals as the table. It does not add a second dataset. The left axis and hover label still say Bullish Net Premium. The dots are red on this page.
- Orders: How many names the chart keeps. Choices are 5, 10, 15, 20, 30, and All. The page starts at 20.
- Bullish Net Premium: The left axis label. On this page the values sit below zero, with the most negative names on the left.
- Dot size: Net Premium % of Total. A larger dot means more of that name's Total Premium is leftover as Net Premium.
- Dot color: Red on this page. It is a tag for the bearish rank, not a thesis.
How people actually use it
Scan the Net Premium rank first
Leave Net Premium as the sort, most negative first. Note which names you already expect at the top. Then look for a name that does not belong in that company.
Check Net Premium versus Total Premium
A high Total Premium with a small Net Premium can be routine two-sided flow. A smaller Total Premium with a large Net Premium percent is often the row worth a second look.
Use Orders on the chart
Drop to 10 or 15 when you only want the most negative Net Premium leaders. Switch to 30 or All when you want more of the list on one chart.
Open the tape next
This page is a rank, not a setup. Open Dark Pool Flow for prints, or Bullish Dark Pool Net Premium if you want the buy-side list.