How to read short interest, synthetic shares and Short Score (real GME example)
GME had 10% of its float sold short at the Sep 30, 2026 FINRA settlement. Our estimated synthetic short interest read 717%. Here's what each number means and how to read the whole short interest page, one screen at a time.

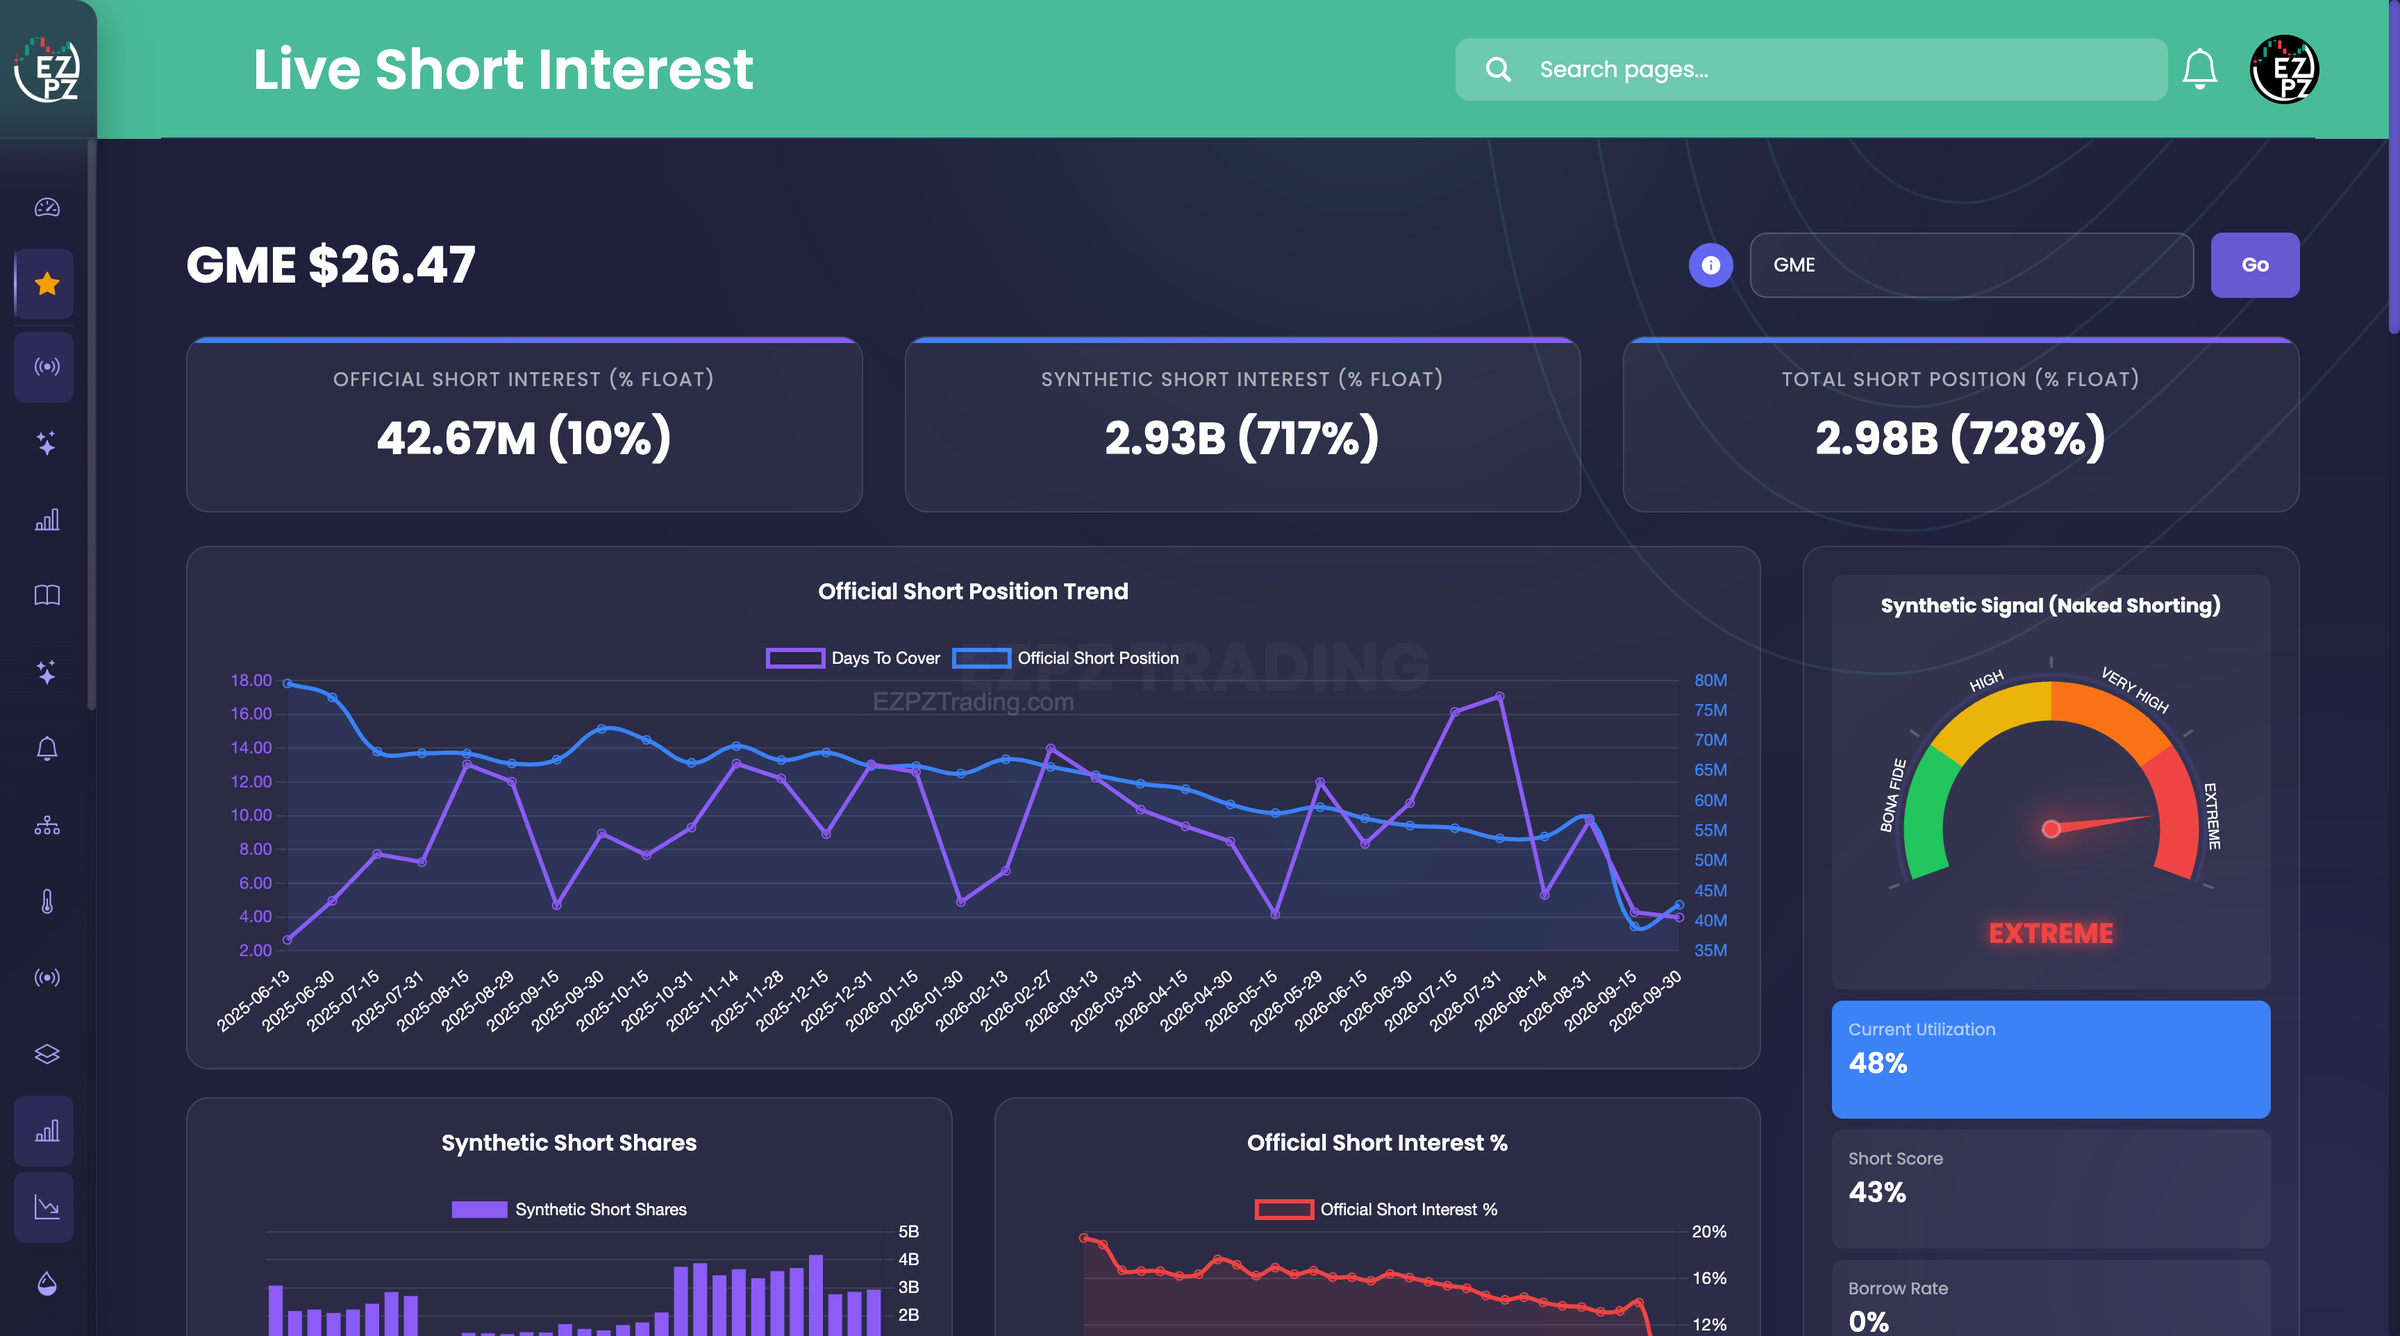
GME had 42.67M shares sold short at the Sep 30, 2026 FINRA settlement. That's 10% of its float. Our estimated synthetic short interest put the figure at 717% of float. Those two numbers measure different things, and mixing them up is the fastest way to misread a short interest page. Below, we define each number, then walk the GME page screen by screen.
The terms, in plain English
- Short interest is the number of shares sold short and not yet bought back. The official figure is FINRA's consolidated short interest.
- Settlement date is the day the count describes. FINRA runs two settlement dates a month and publishes each one about seven business days later. As of this guide, the latest is Sep 30, 2026, first published Oct 9, 2026. Next up is Oct 15, 2026, published about Oct 26.
- Short interest % of float is the short position divided by the float, meaning the shares available to trade.
- Days to cover is FINRA's figure for how many days of average trading volume it would take every short to buy back.
- Estimated Synthetic Short Interest is EZPZ's estimate of short exposure beyond reported borrows. More on that below.
- Short Score on Short Extremes (ShortEx) is EZPZ's composite estimate of short pressure. It updates every trading day.
What synthetic short interest actually measures
The official count only sees shares that someone borrowed, sold short and reported. You can get short exposure without borrowing a single share, mostly through options. Buy puts, sell calls or combine the two, and you're positioned for the stock to fall. None of that lands in the official count.
Estimated Synthetic Short Interest is our attempt to size that extra exposure. It combines several market data sources, including options activity, securities lending and borrow data, fails-to-deliver, Reg SHO status and short interest trends. The model and its weights are proprietary, so we publish the result and keep the recipe in-house.
Keep three things in mind:
- It's an estimate. We call it a structural pressure indicator. It isn't an accounting of shares, and nobody can audit it against a filing.
- It can run far above 100% of float. GME's 717% says the modelled exposure, mostly from options, is big relative to the float. Nobody sold seven times the float short.
- The signal bands describe the estimate. Bona Fide, High, Very High and Extreme tell you where the estimate sits. They aren't a price call.
The GME walkthrough (settlement Sep 30, 2026, page read Oct 21, 2026)
Every number below comes from the EZPZ Short Interest page for GME. Short interest values are as of the Sep 30, 2026 settlement. We read the price and the cards on the right on Oct 21, 2026.
- Price: $26.47.
- Official short interest: 42.67M shares, 10% of float.
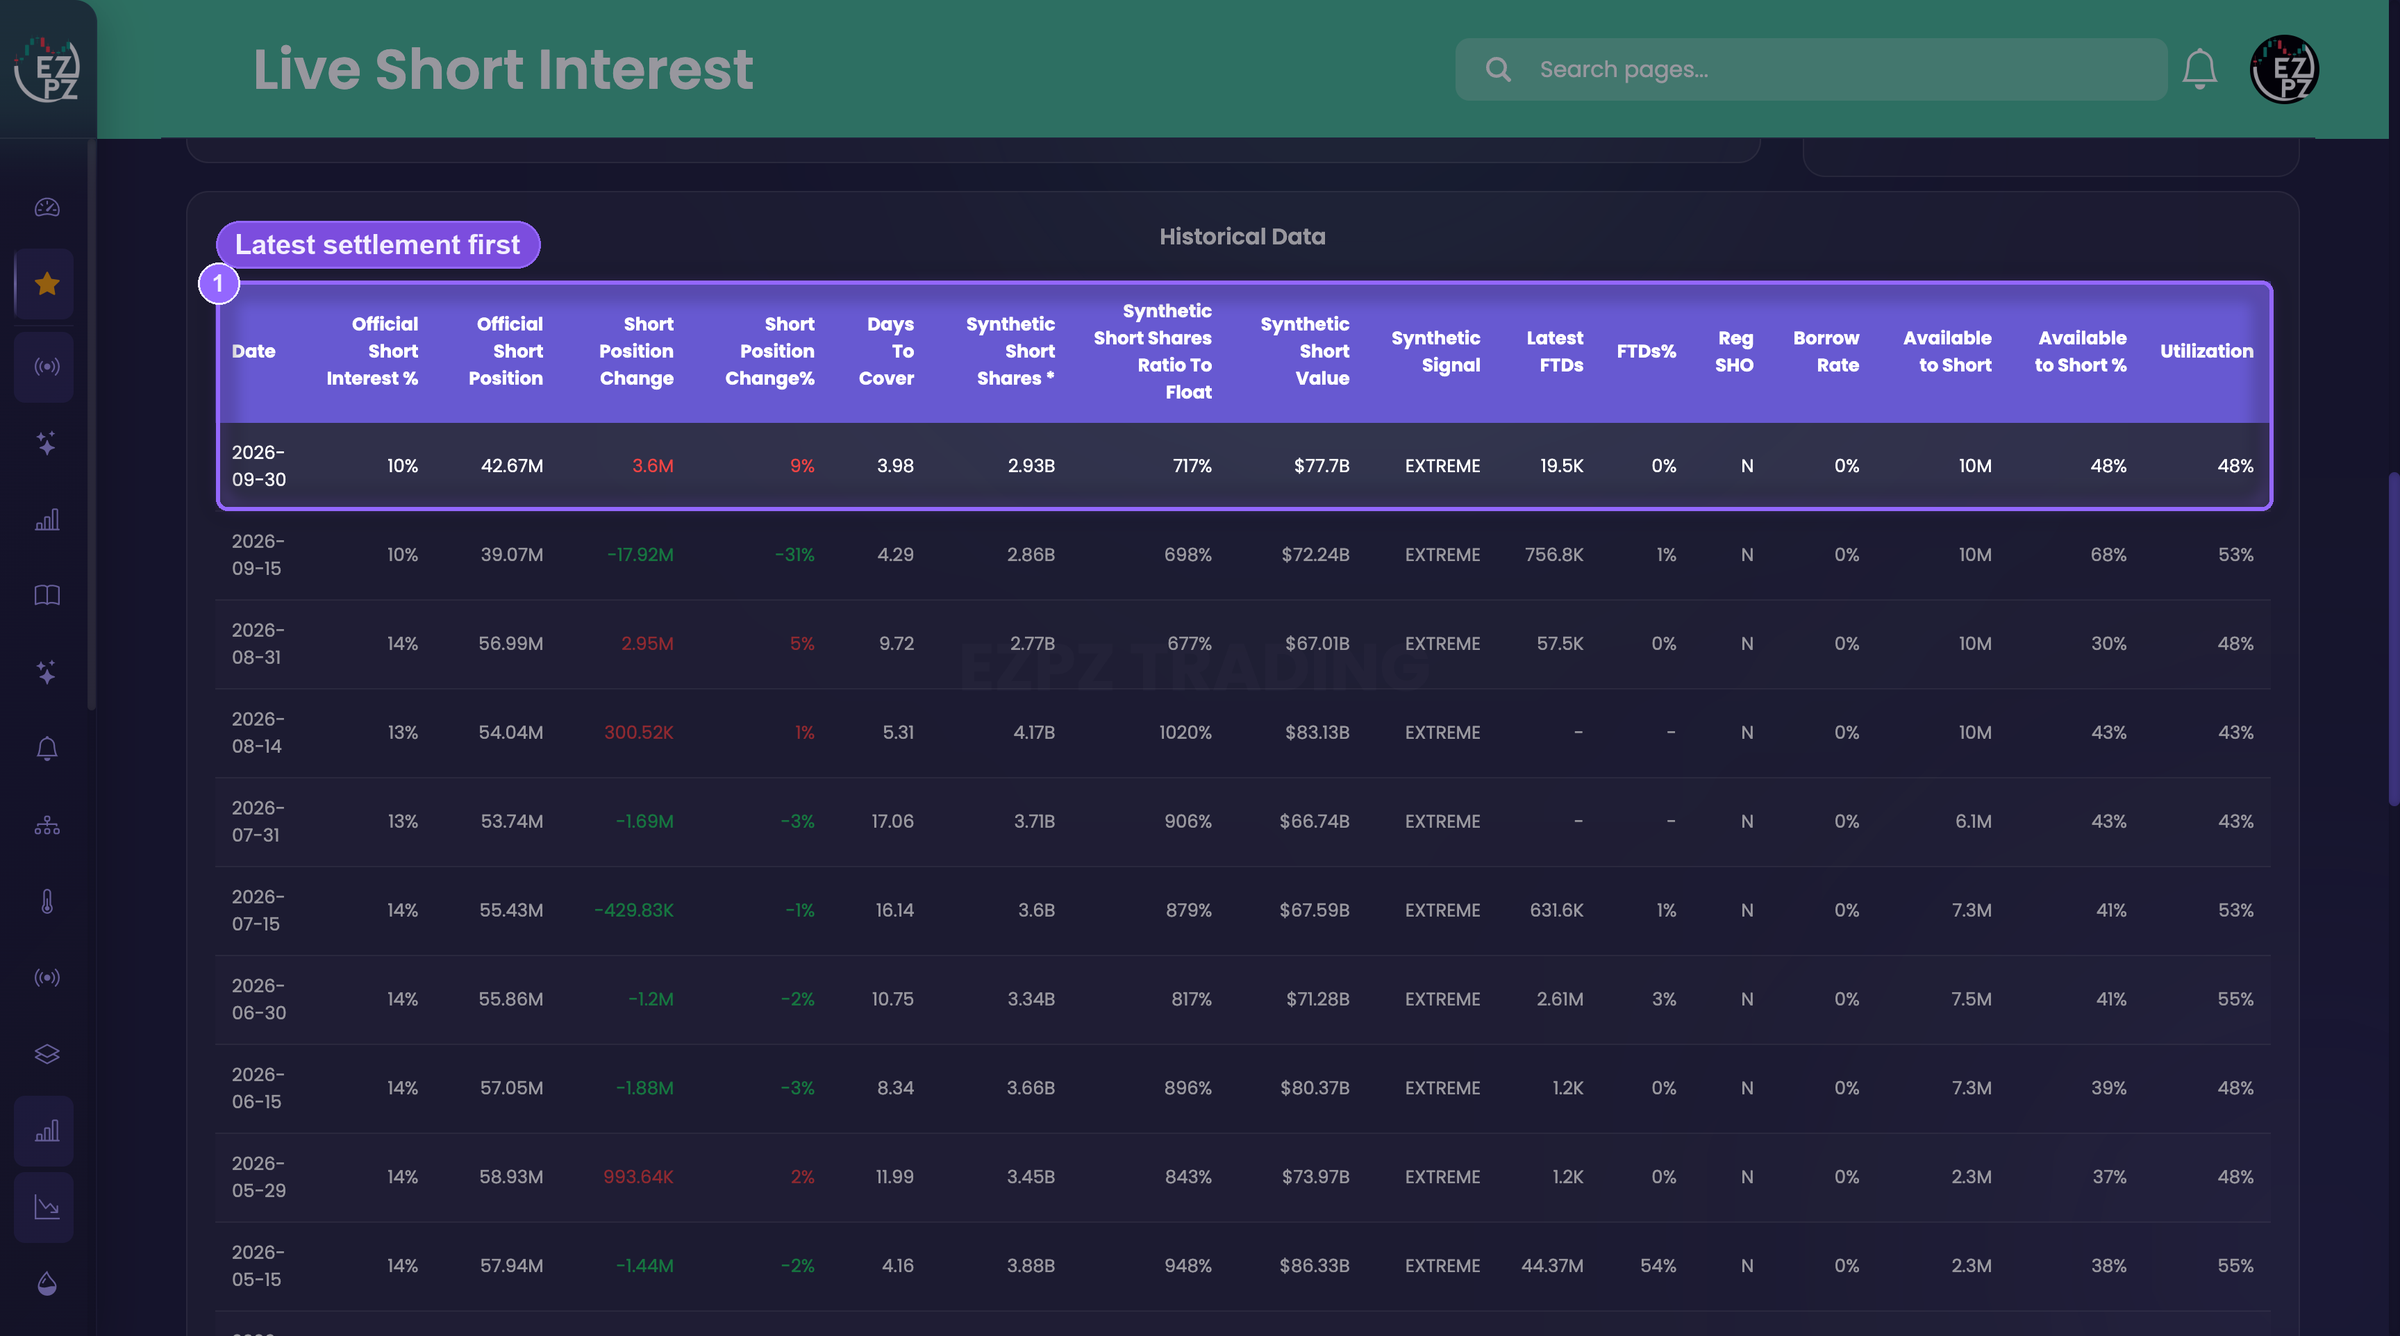
- Change since the Sep 15 settlement: up 3.6M shares, or 9%, from 39.07M.
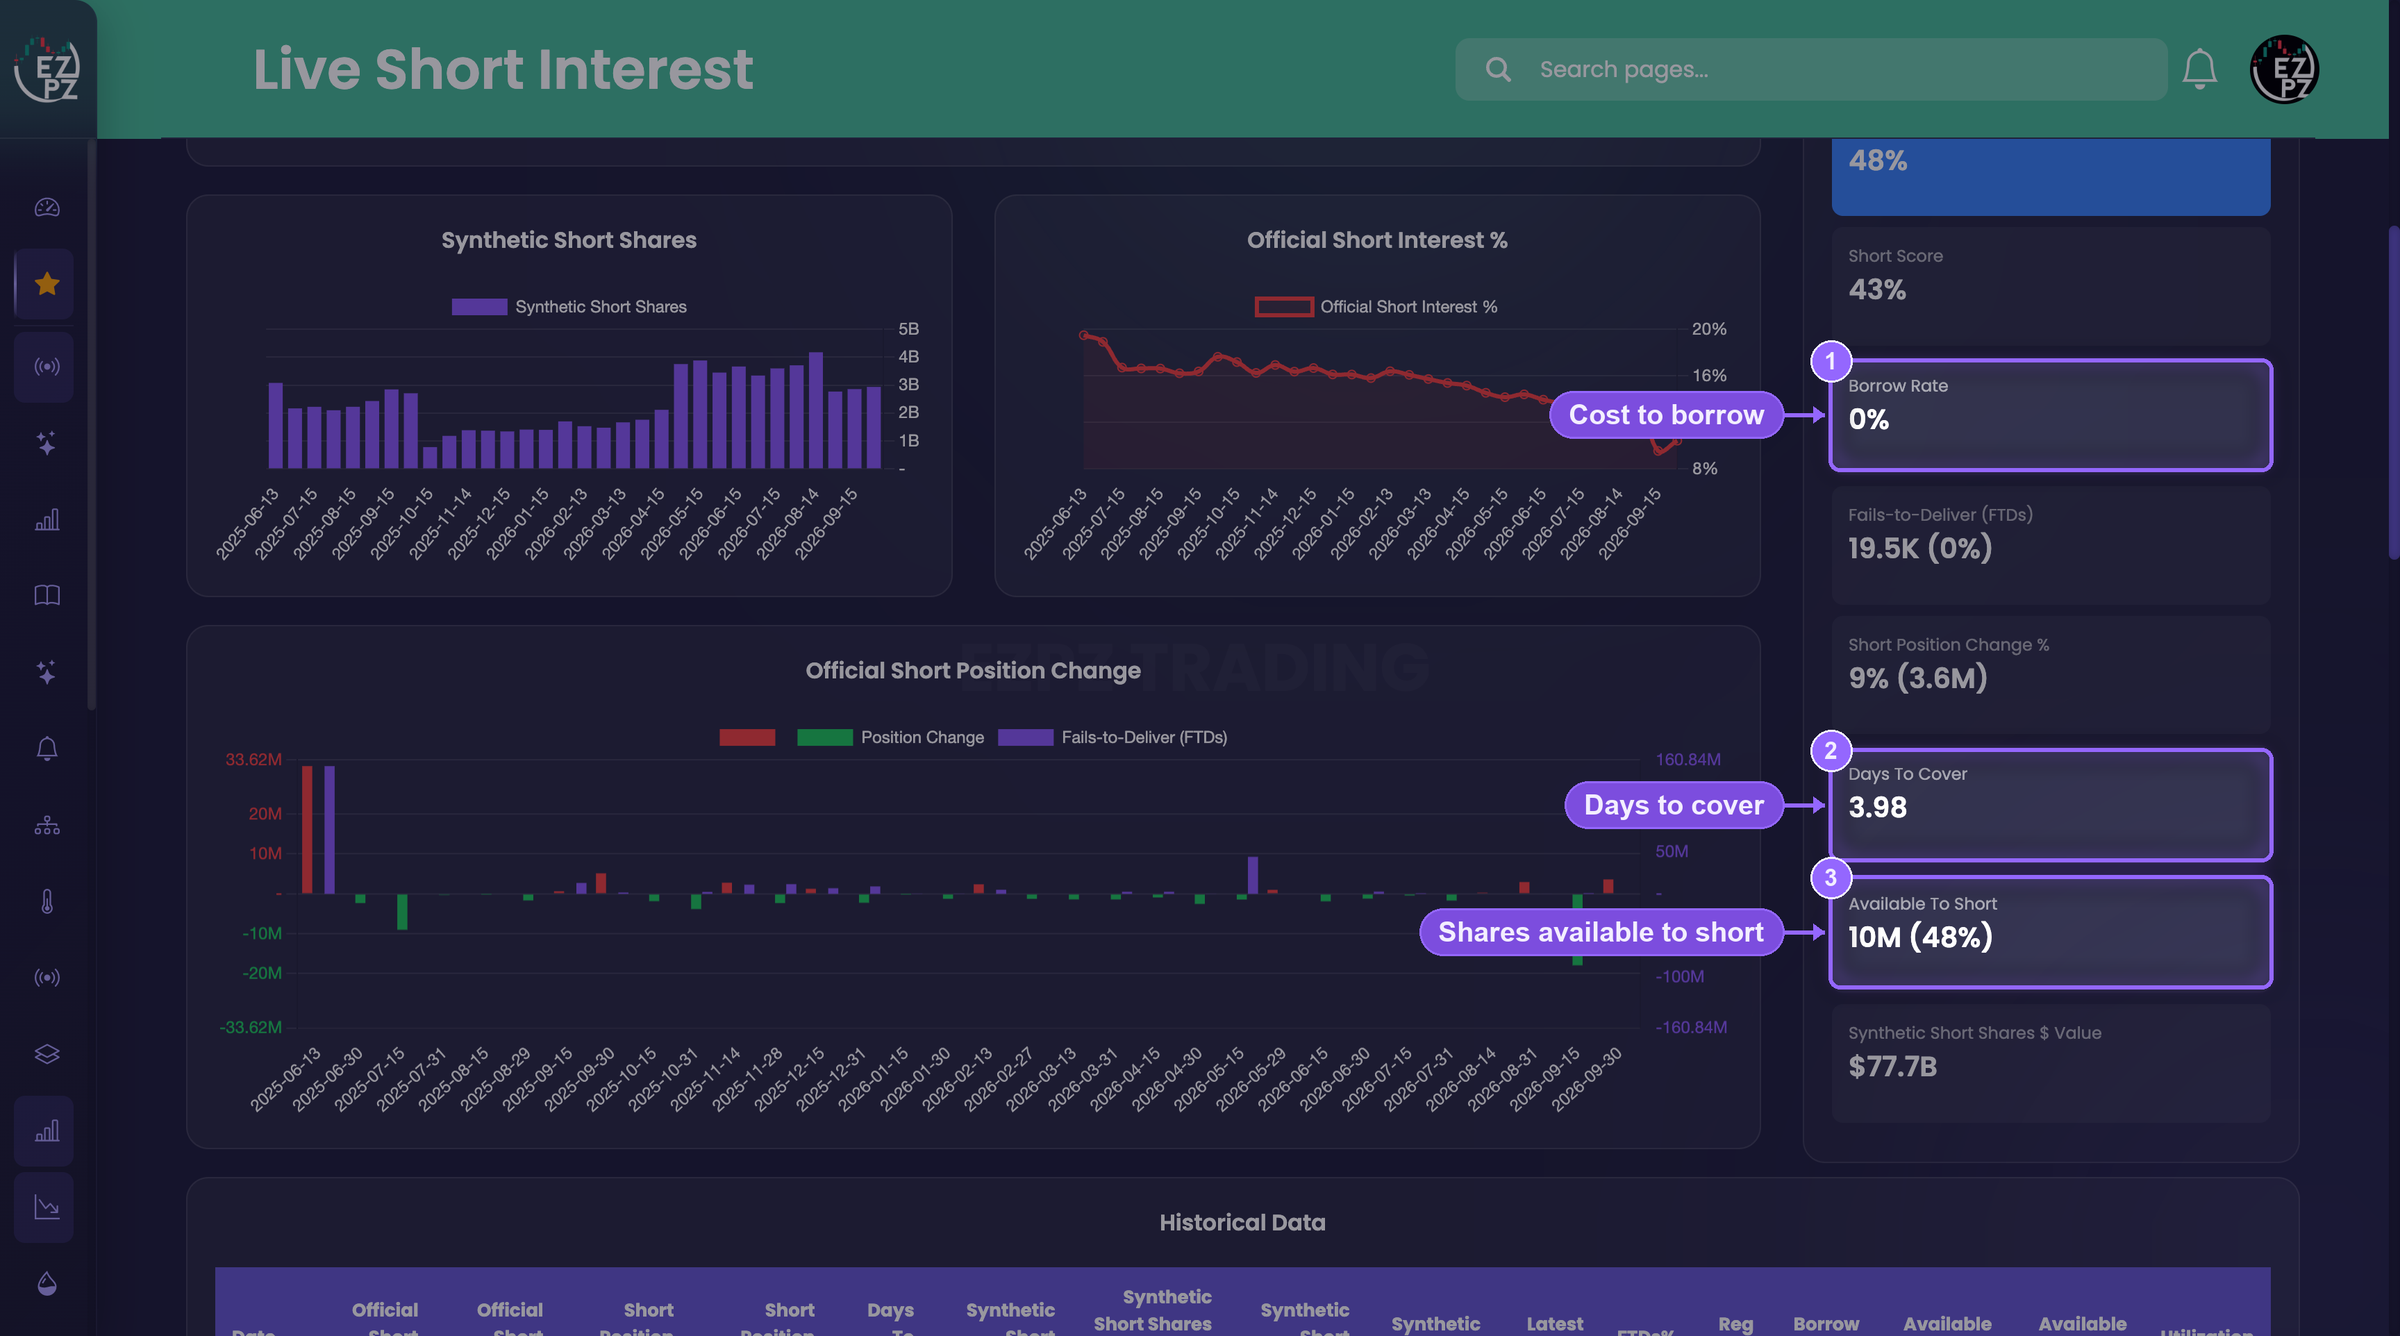
- Days to cover: 3.98, down from 4.29 at Sep 15.
- Estimated synthetic short interest: 2.93B shares, 717% of float. Total short position on the page: 2.98B, 728% of float. Both are estimates.
- Synthetic signal: Extreme. Short Score: 43% (estimate).
- Borrow rate: 0%. Available to short: 10M (48%).
- Synthetic short value: $77.7B, which is the estimated synthetic shares times the price.
Now put it together. The official short position grew 9% into Sep 30, yet days to cover fell. Days to cover is the short position divided by average daily volume, so volume rose faster than the short position did. A 0% borrow rate and shares still available to short tell you GME wasn't hard to borrow when we read the page. The synthetic estimate is very high, which says options positioning is large relative to the float. None of this tells you where the price goes next.
How to read the page, step by step
These are the real screens from Oct 21, 2026. The Short Interest page and the leaderboard are part of Pro, and Short Extremes is part of Premium. You'll find free delayed versions linked at the end.
Search a ticker
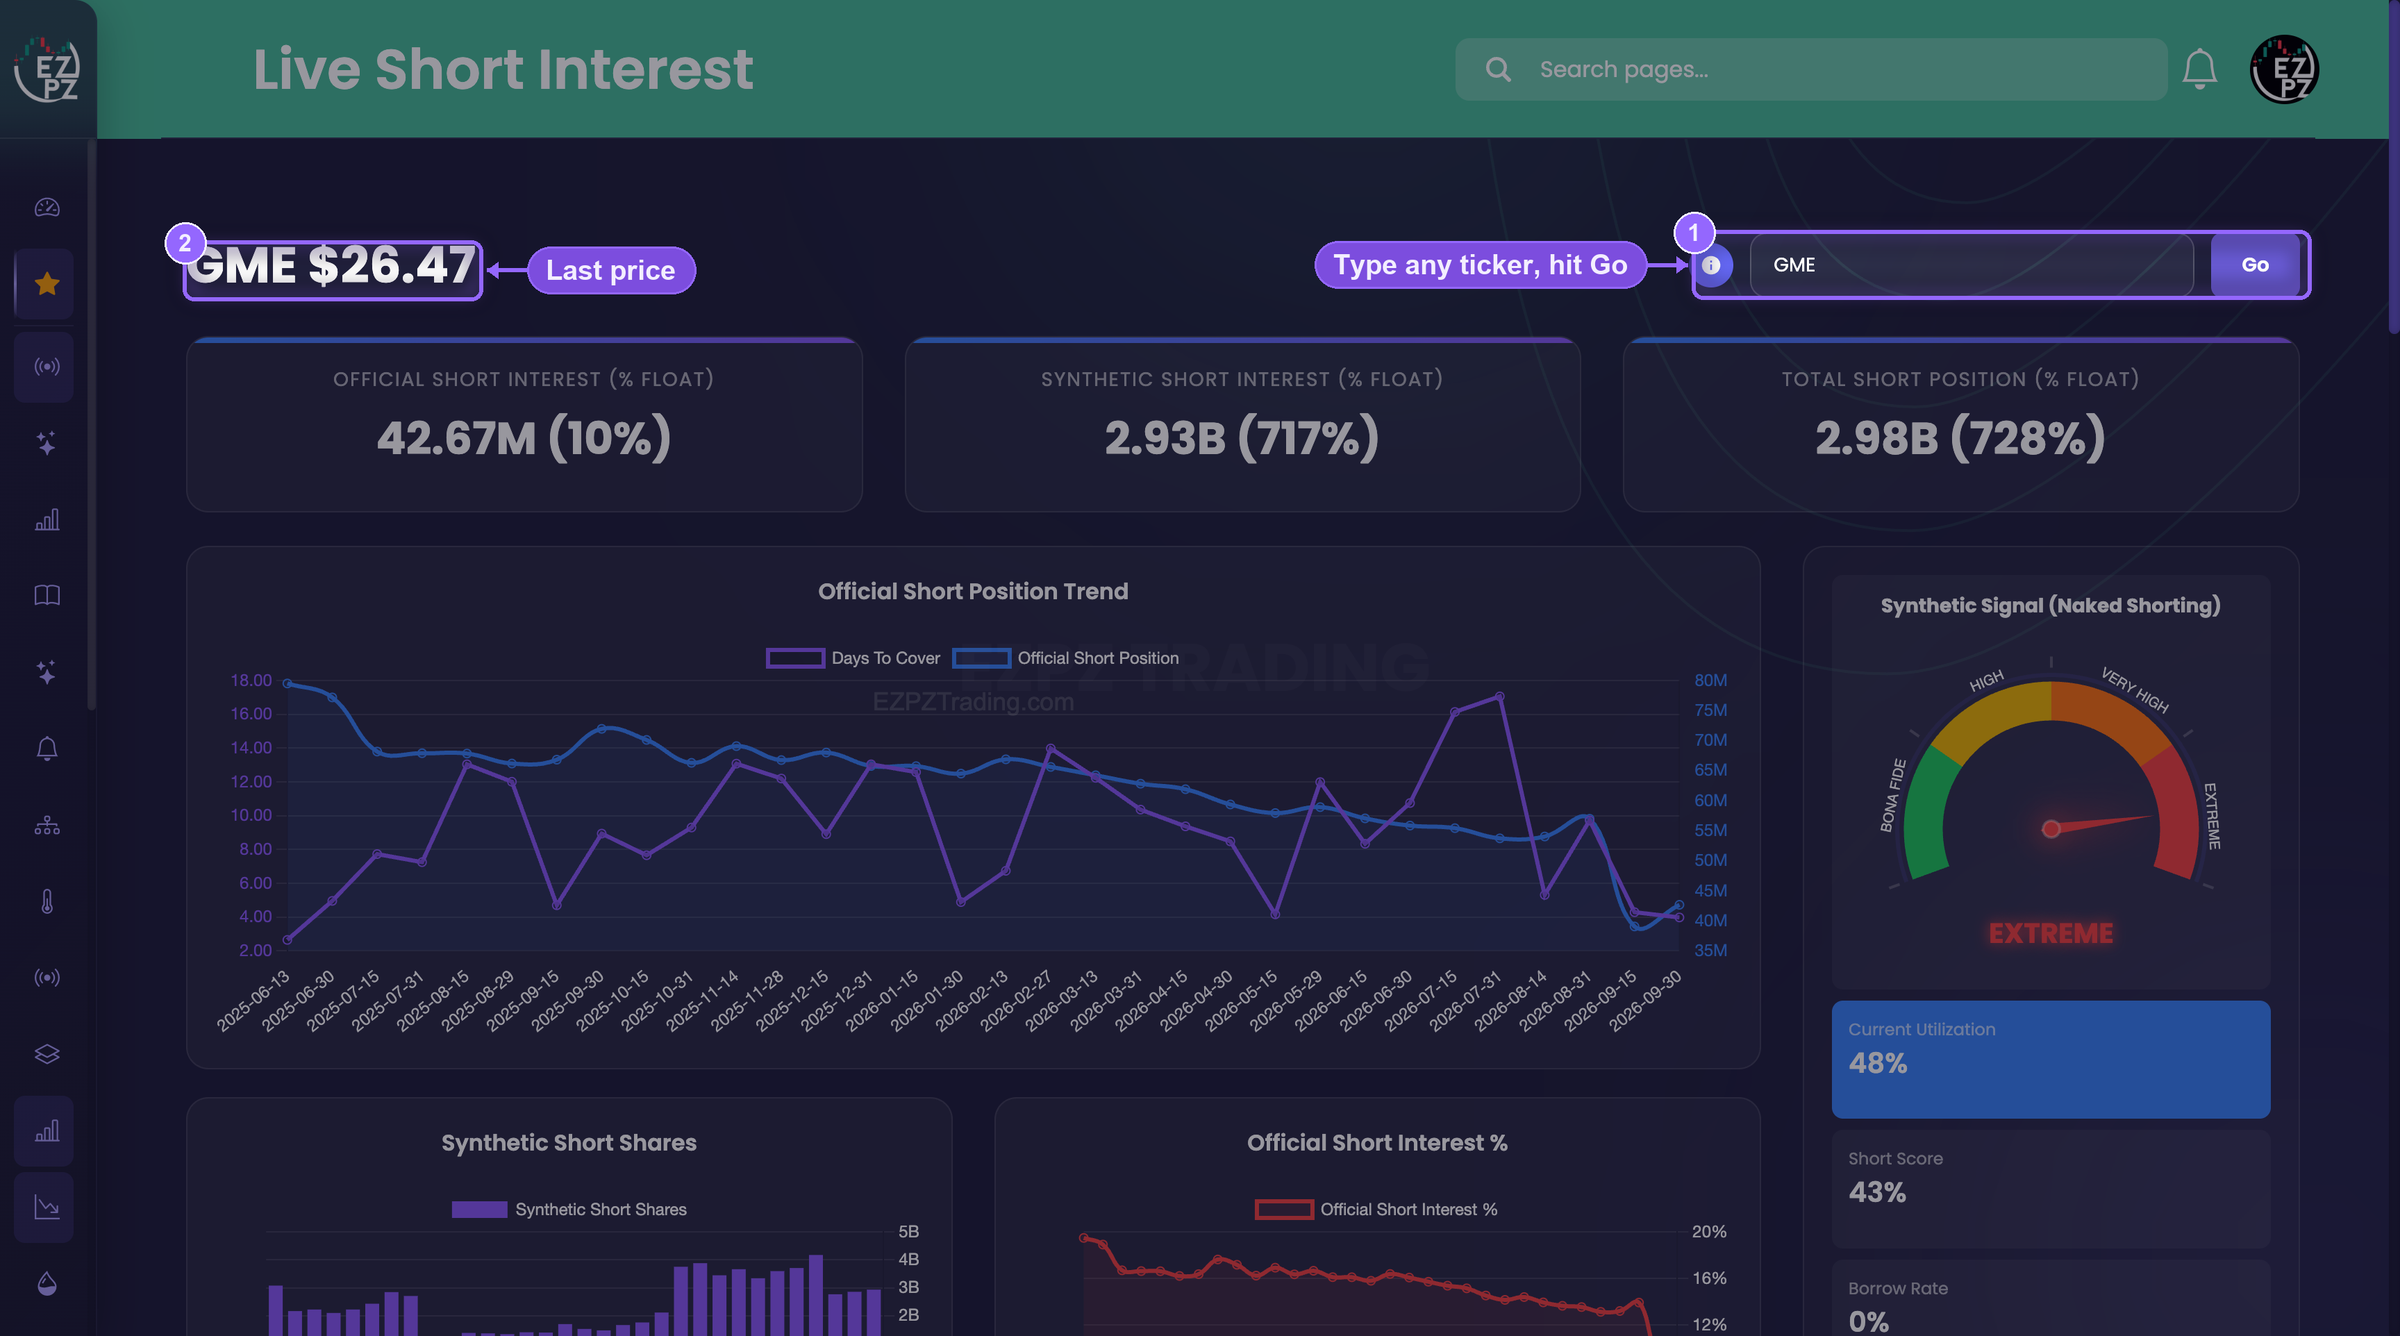
Open Short Interest, type the ticker in the box at the top right and hit Go. The header shows the ticker and the latest price, here GME at $26.47. Click the round (i) button next to the box for a short explanation of every card and chart on the page.
Read official and estimated side by side
Start with the three cards at the top. They do most of the work. Official Short Interest is FINRA's number: 42.67M shares, 10% of float. Synthetic Short Interest is our estimate: 2.93B, 717% of float. Total Short Position adds the two together: 2.98B, 728%. Quote the first as a fact, with its settlement date. Quote the other two as estimates.

Check the trend
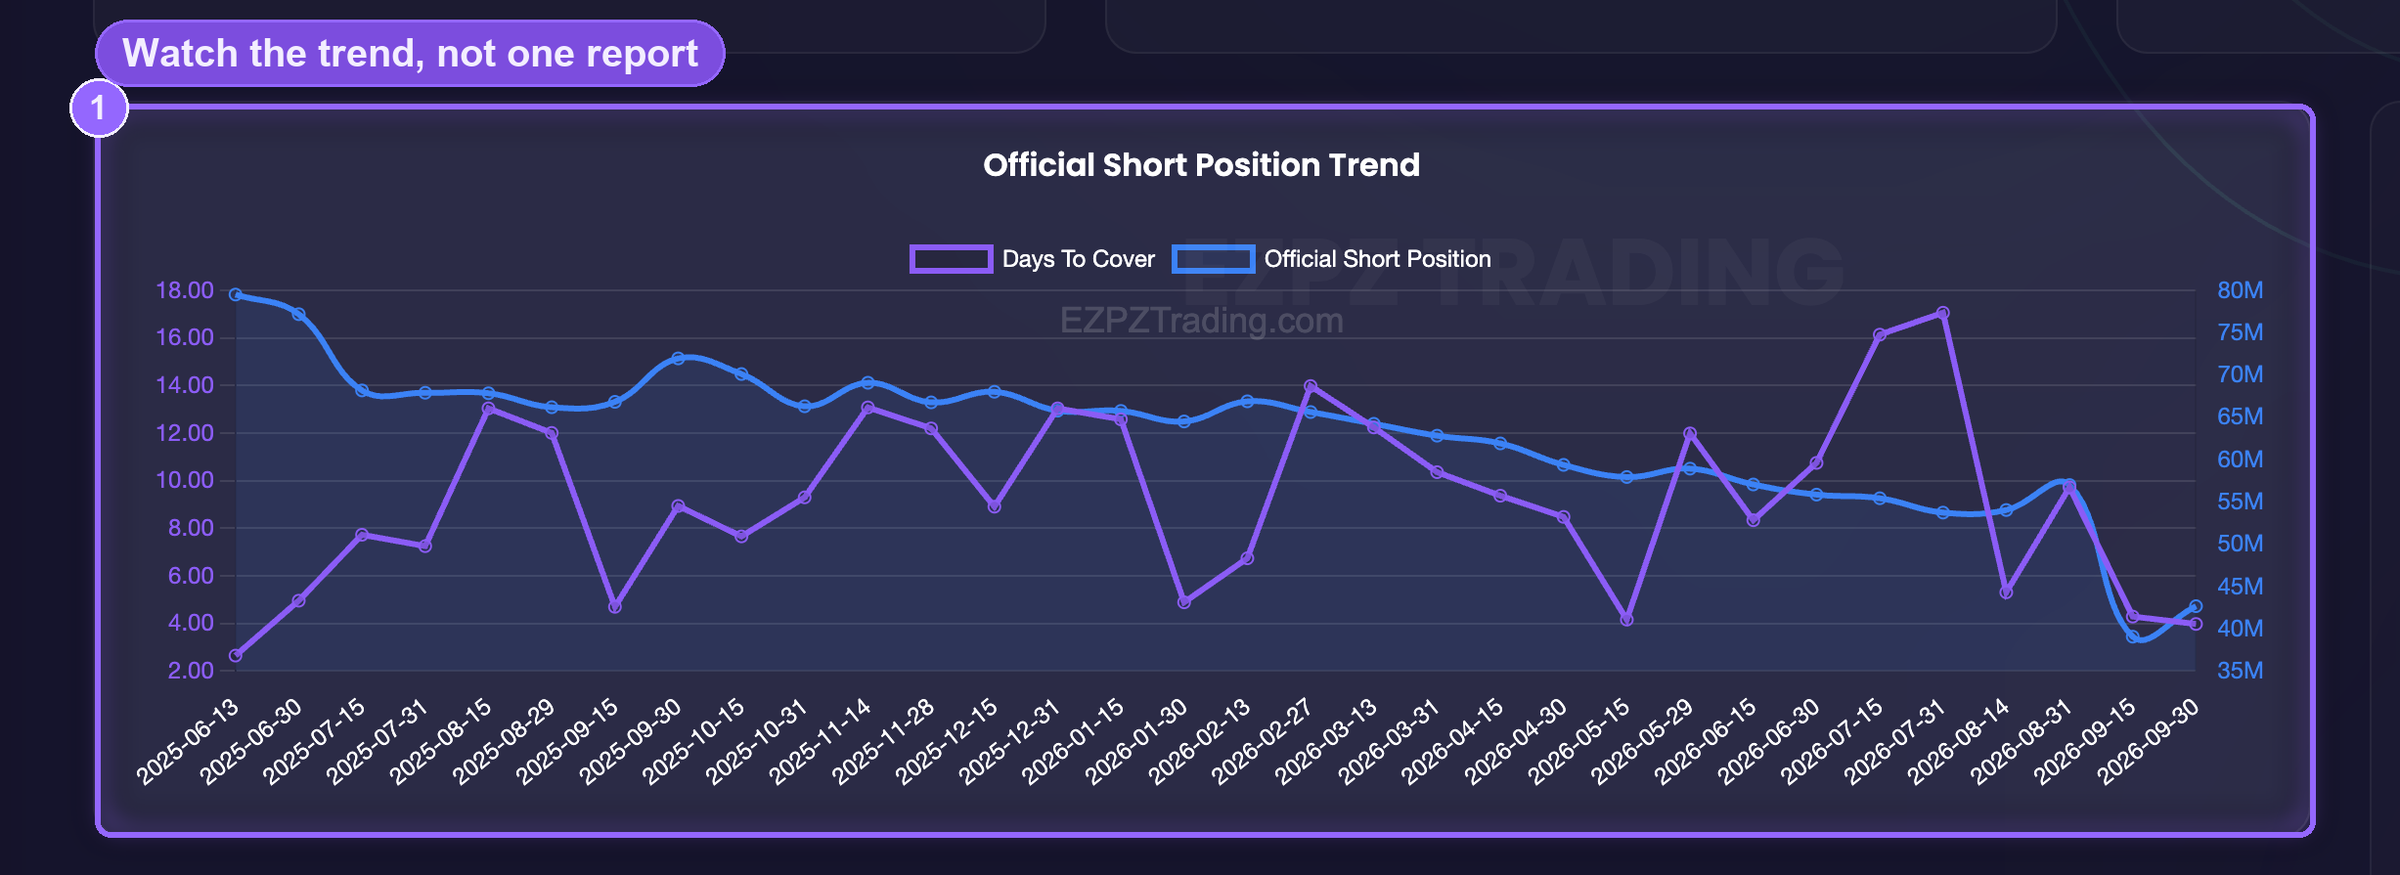
One settlement on its own tells you little. The Official Short Position Trend chart plots the short position and days to cover at every settlement. The charts below it show synthetic shares, official short interest % and the change at each settlement. For GME, the short position rose 3.6M shares (9%) into Sep 30 while days to cover slipped from 4.29 to 3.98.
See what it costs to stay short
The cards on the right show what it costs to stay short and how hard shares are to find. For GME on Oct 21: borrow rate 0%, available to short 10M (48%), Short Score 43% (estimate) and a synthetic short value of $77.7B (estimate). One label trips people up. The blue card labelled Current Utilization is our short-stress score, an estimate built from several inputs. It doesn't show the share of lendable stock on loan. Watch the borrow rate and availability. When the rate climbs and availability shrinks, a short gets expensive to hold.
Use the history and point-in-time values
The Historical Data table lists every settlement. The latest row is live. Older rows show values as first published, so you see what traders could actually see at the time, before any later corrections. For GME, the Sep 15 row reads 39.07M shares (10% of float) and 4.29 days to cover.
Filter the leaderboard down to names that trade
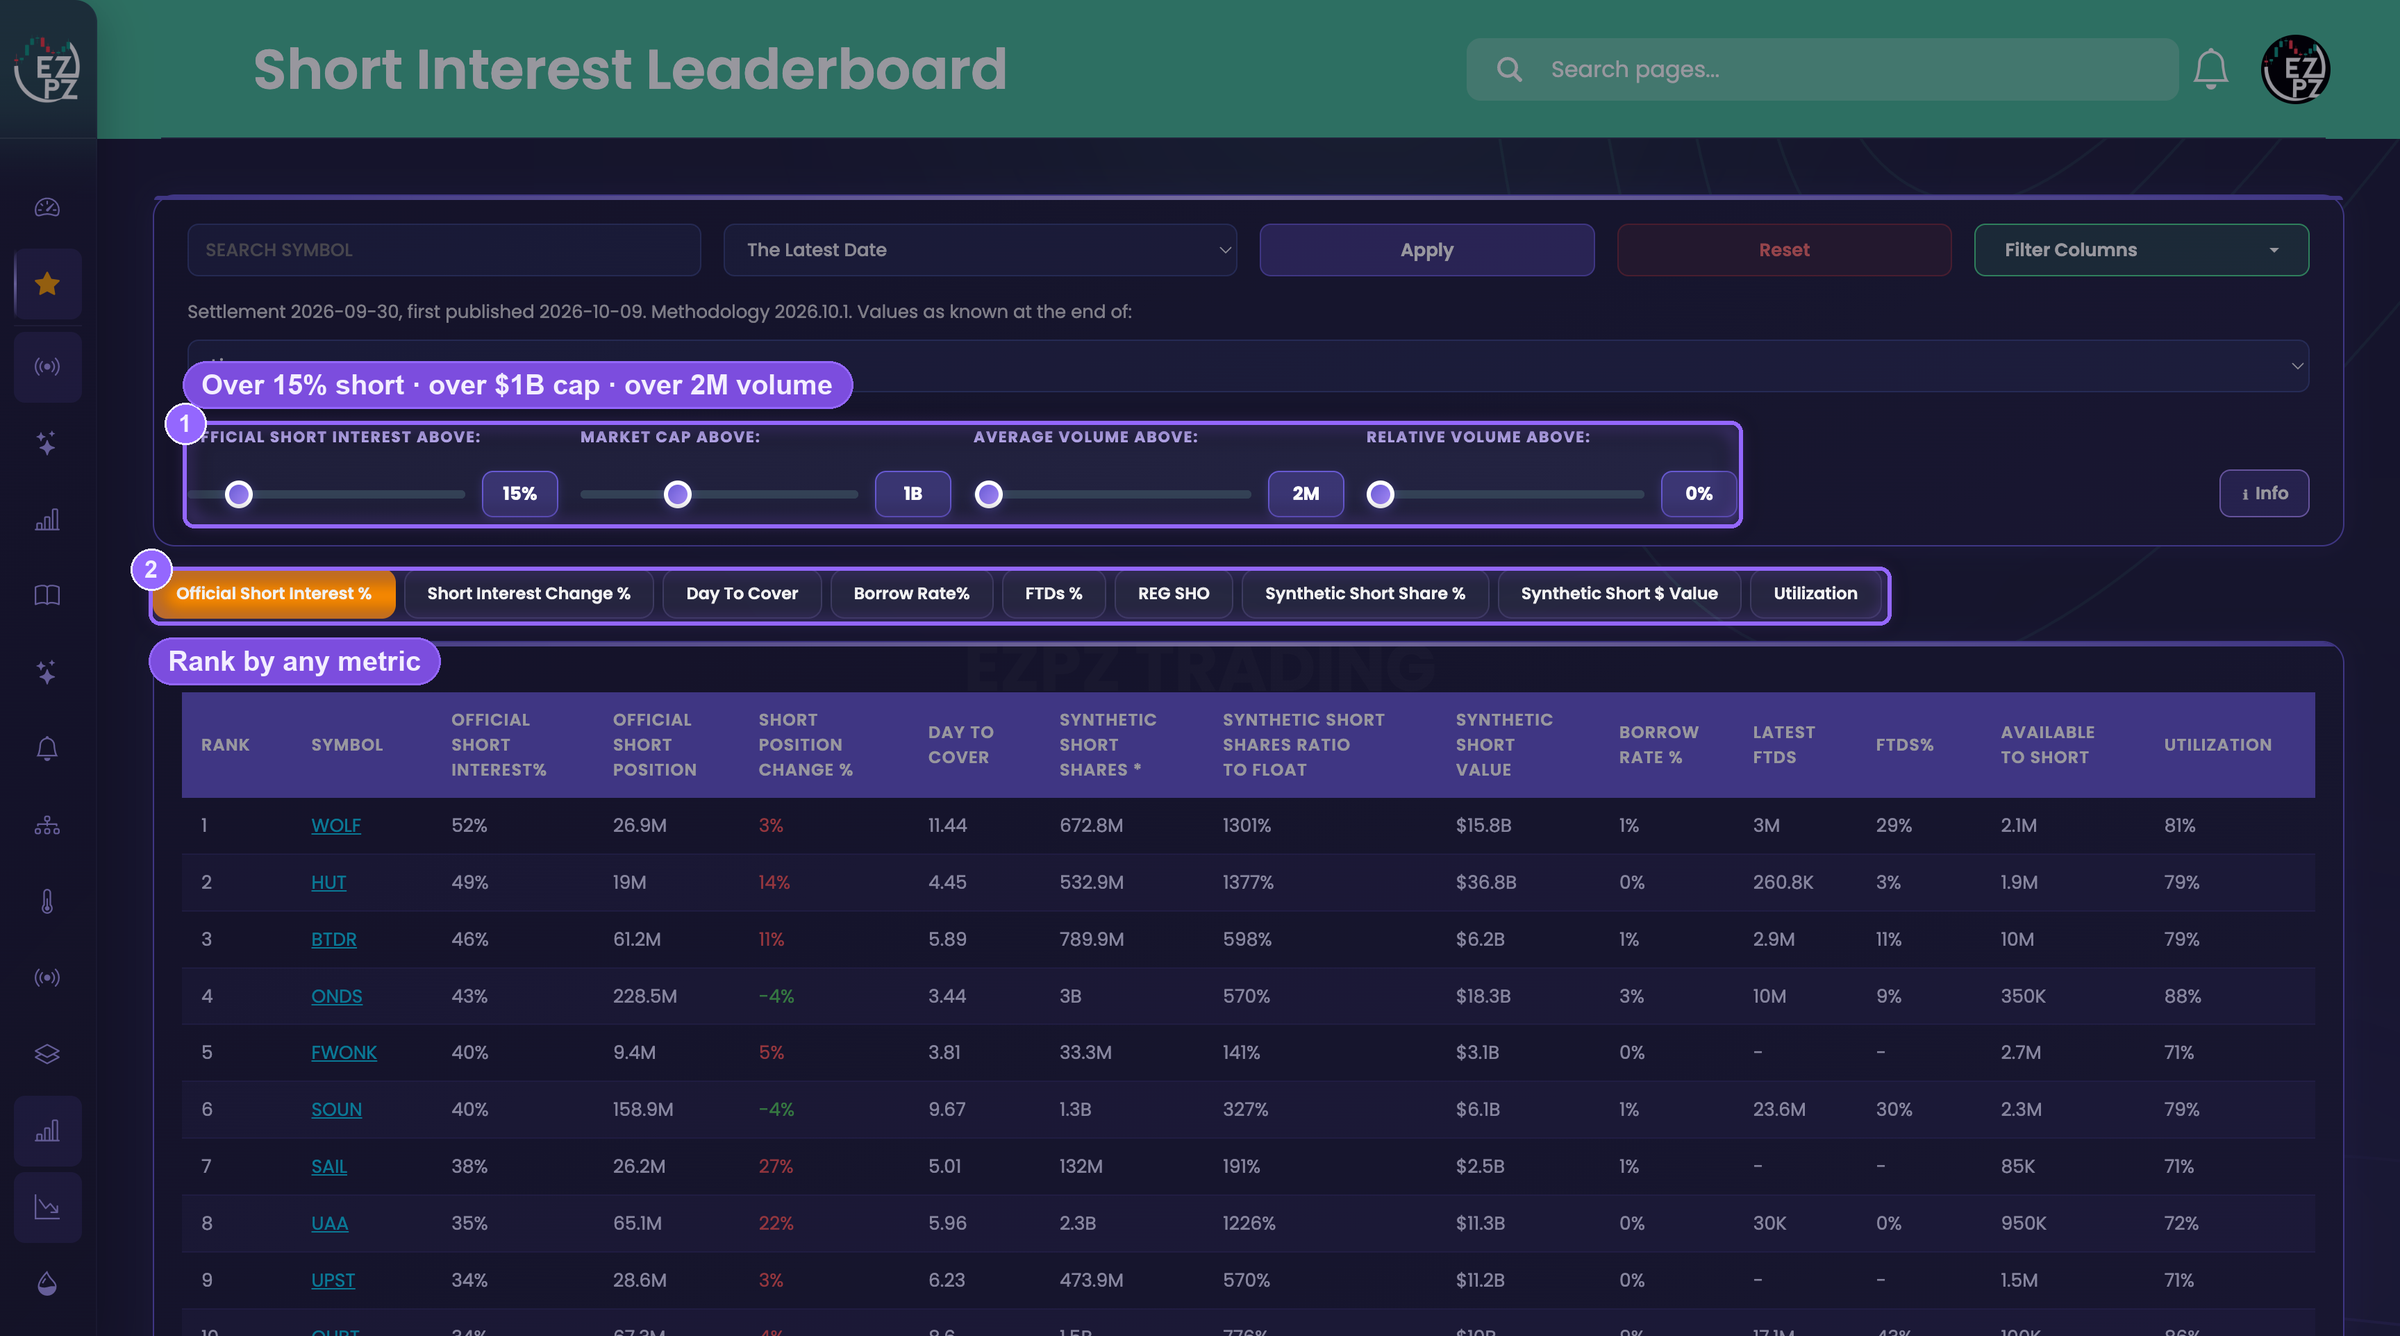
The Short Interest Leaderboard ranks every stock for the latest settlement. The line above the sliders shows the settlement, the first-published date and the methodology version. Push the sliders up to cut tiny and thinly traded names. Our quality filter takes one click: 15%+ short interest, $1B+ market cap, 2M+ average volume. The tabs above the table re-rank the list by short interest, change, days to cover and the other metrics.
Check Short Score and Optionable on ShortEx
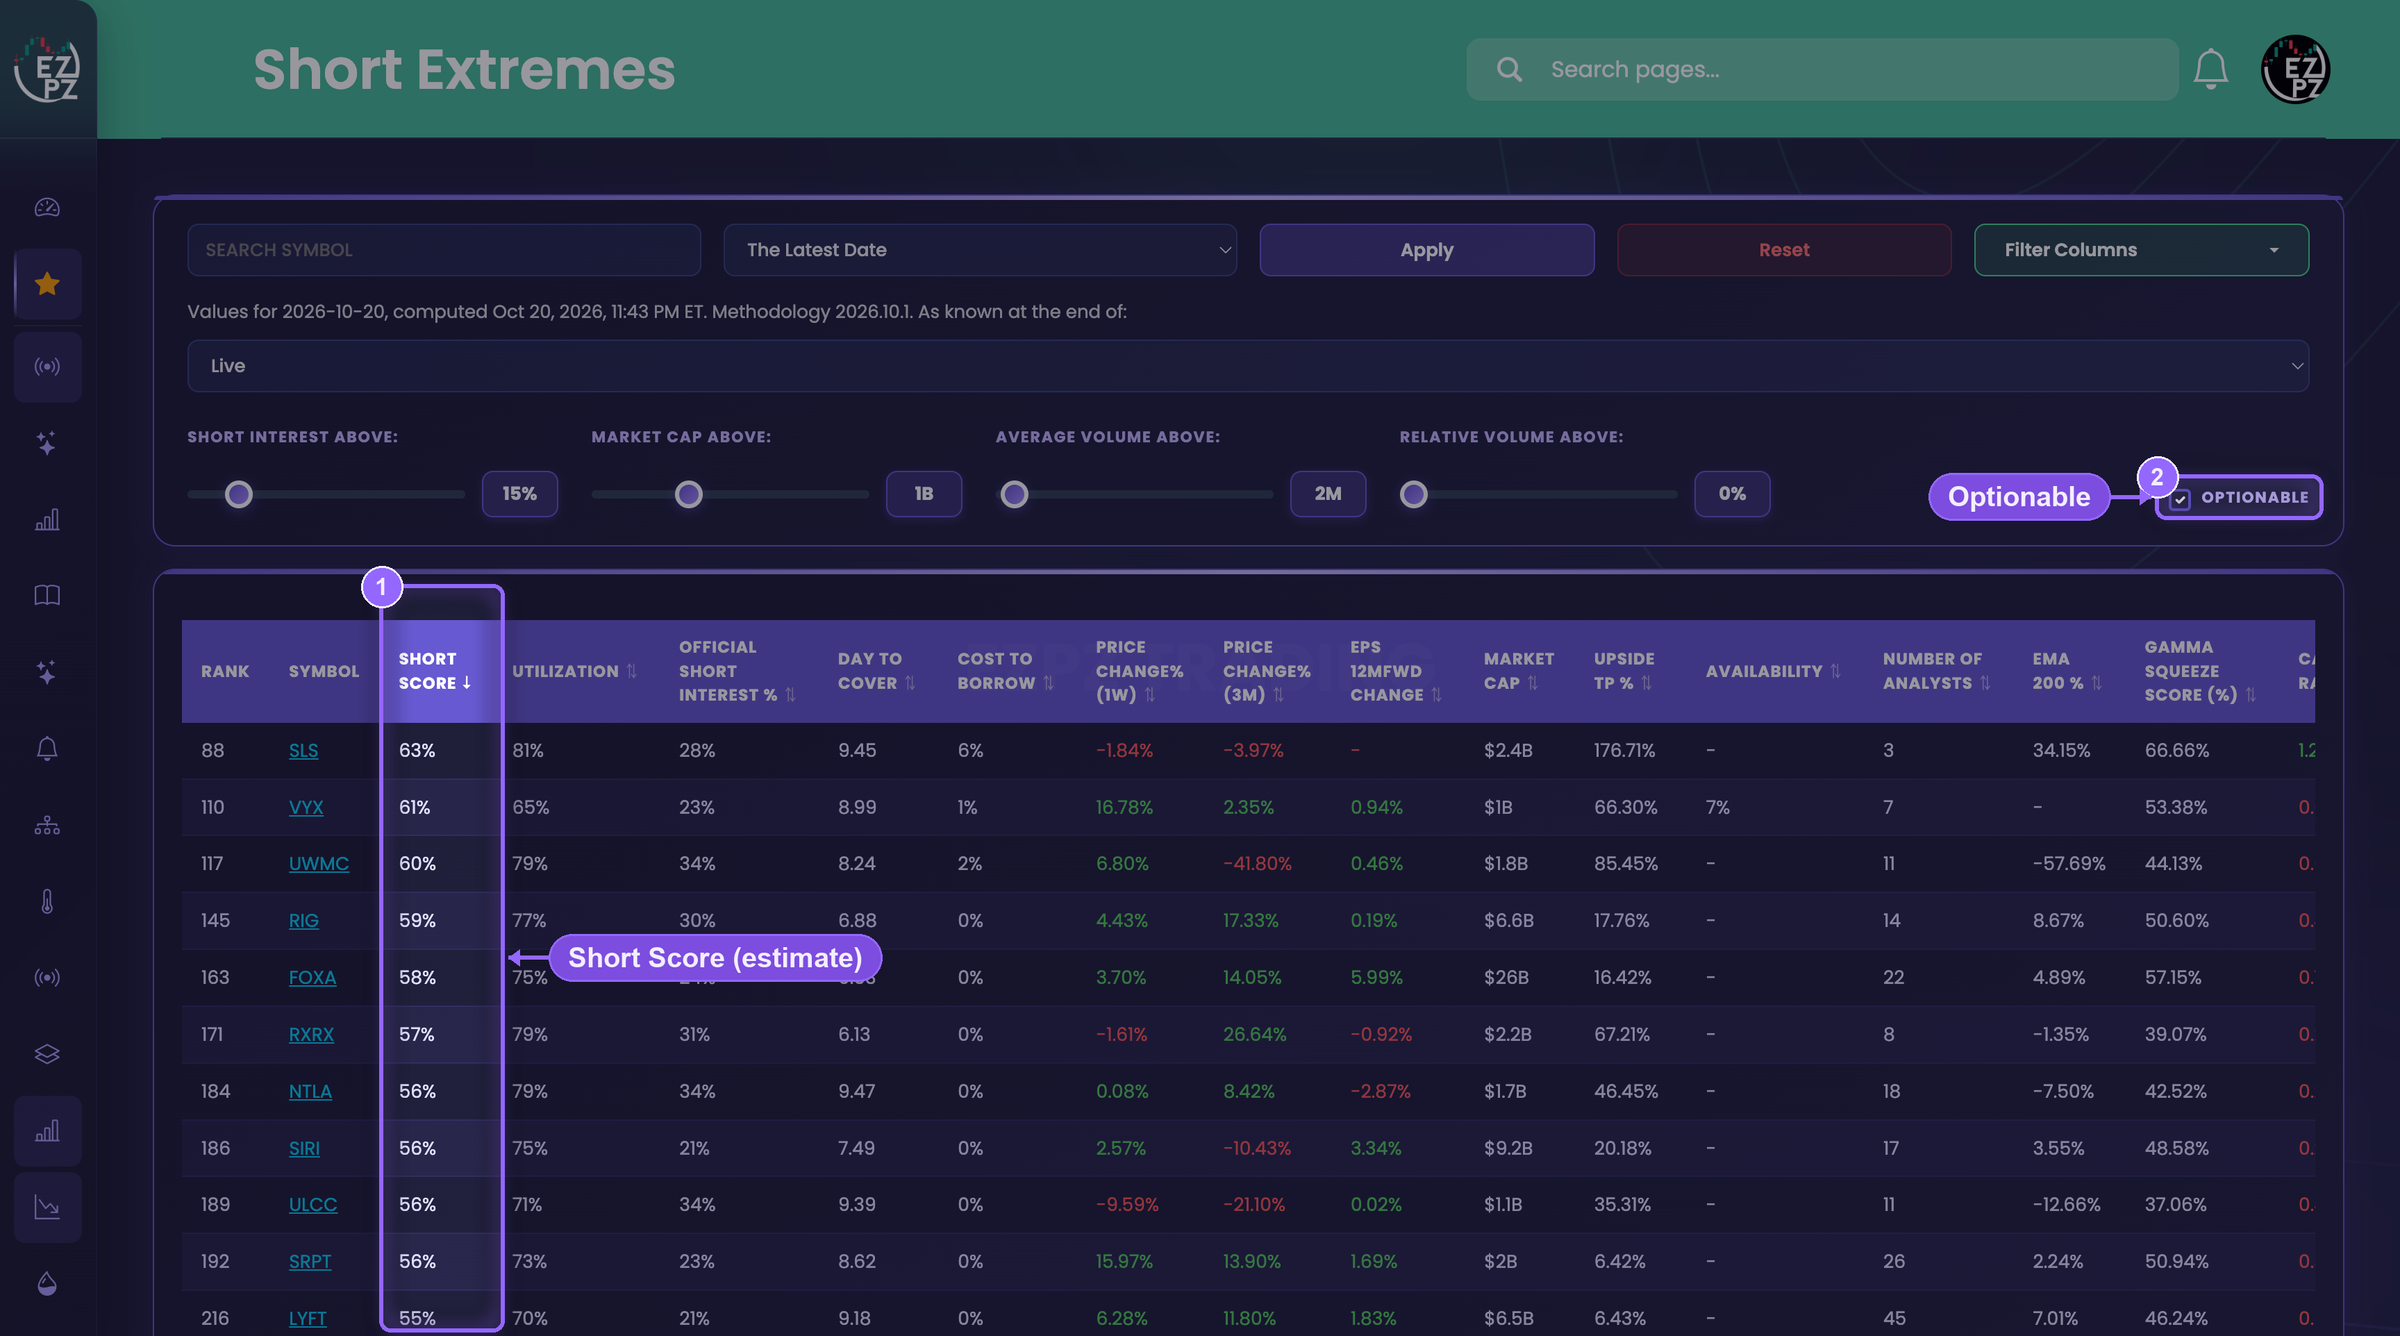
Short Extremes ranks stocks by Short Score, our daily composite estimate of short pressure. It rolls borrow, positioning and short interest data into one number. Tick Optionable to keep only names with listed options. The line above the sliders shows the date the values are for, so you always know how fresh they are.
Common mistakes
- Reading high short interest as a squeeze call. Plenty of heavily shorted stocks keep falling, because the shorts were right. A squeeze needs buyers and a reason for shorts to get out. Short interest alone shows you neither.
- Quoting a stale number. A settlement is already about seven business days old when FINRA publishes it, and older still once it makes the rounds. Check the settlement date before you quote anything, then check Short Extremes for what's changed since.
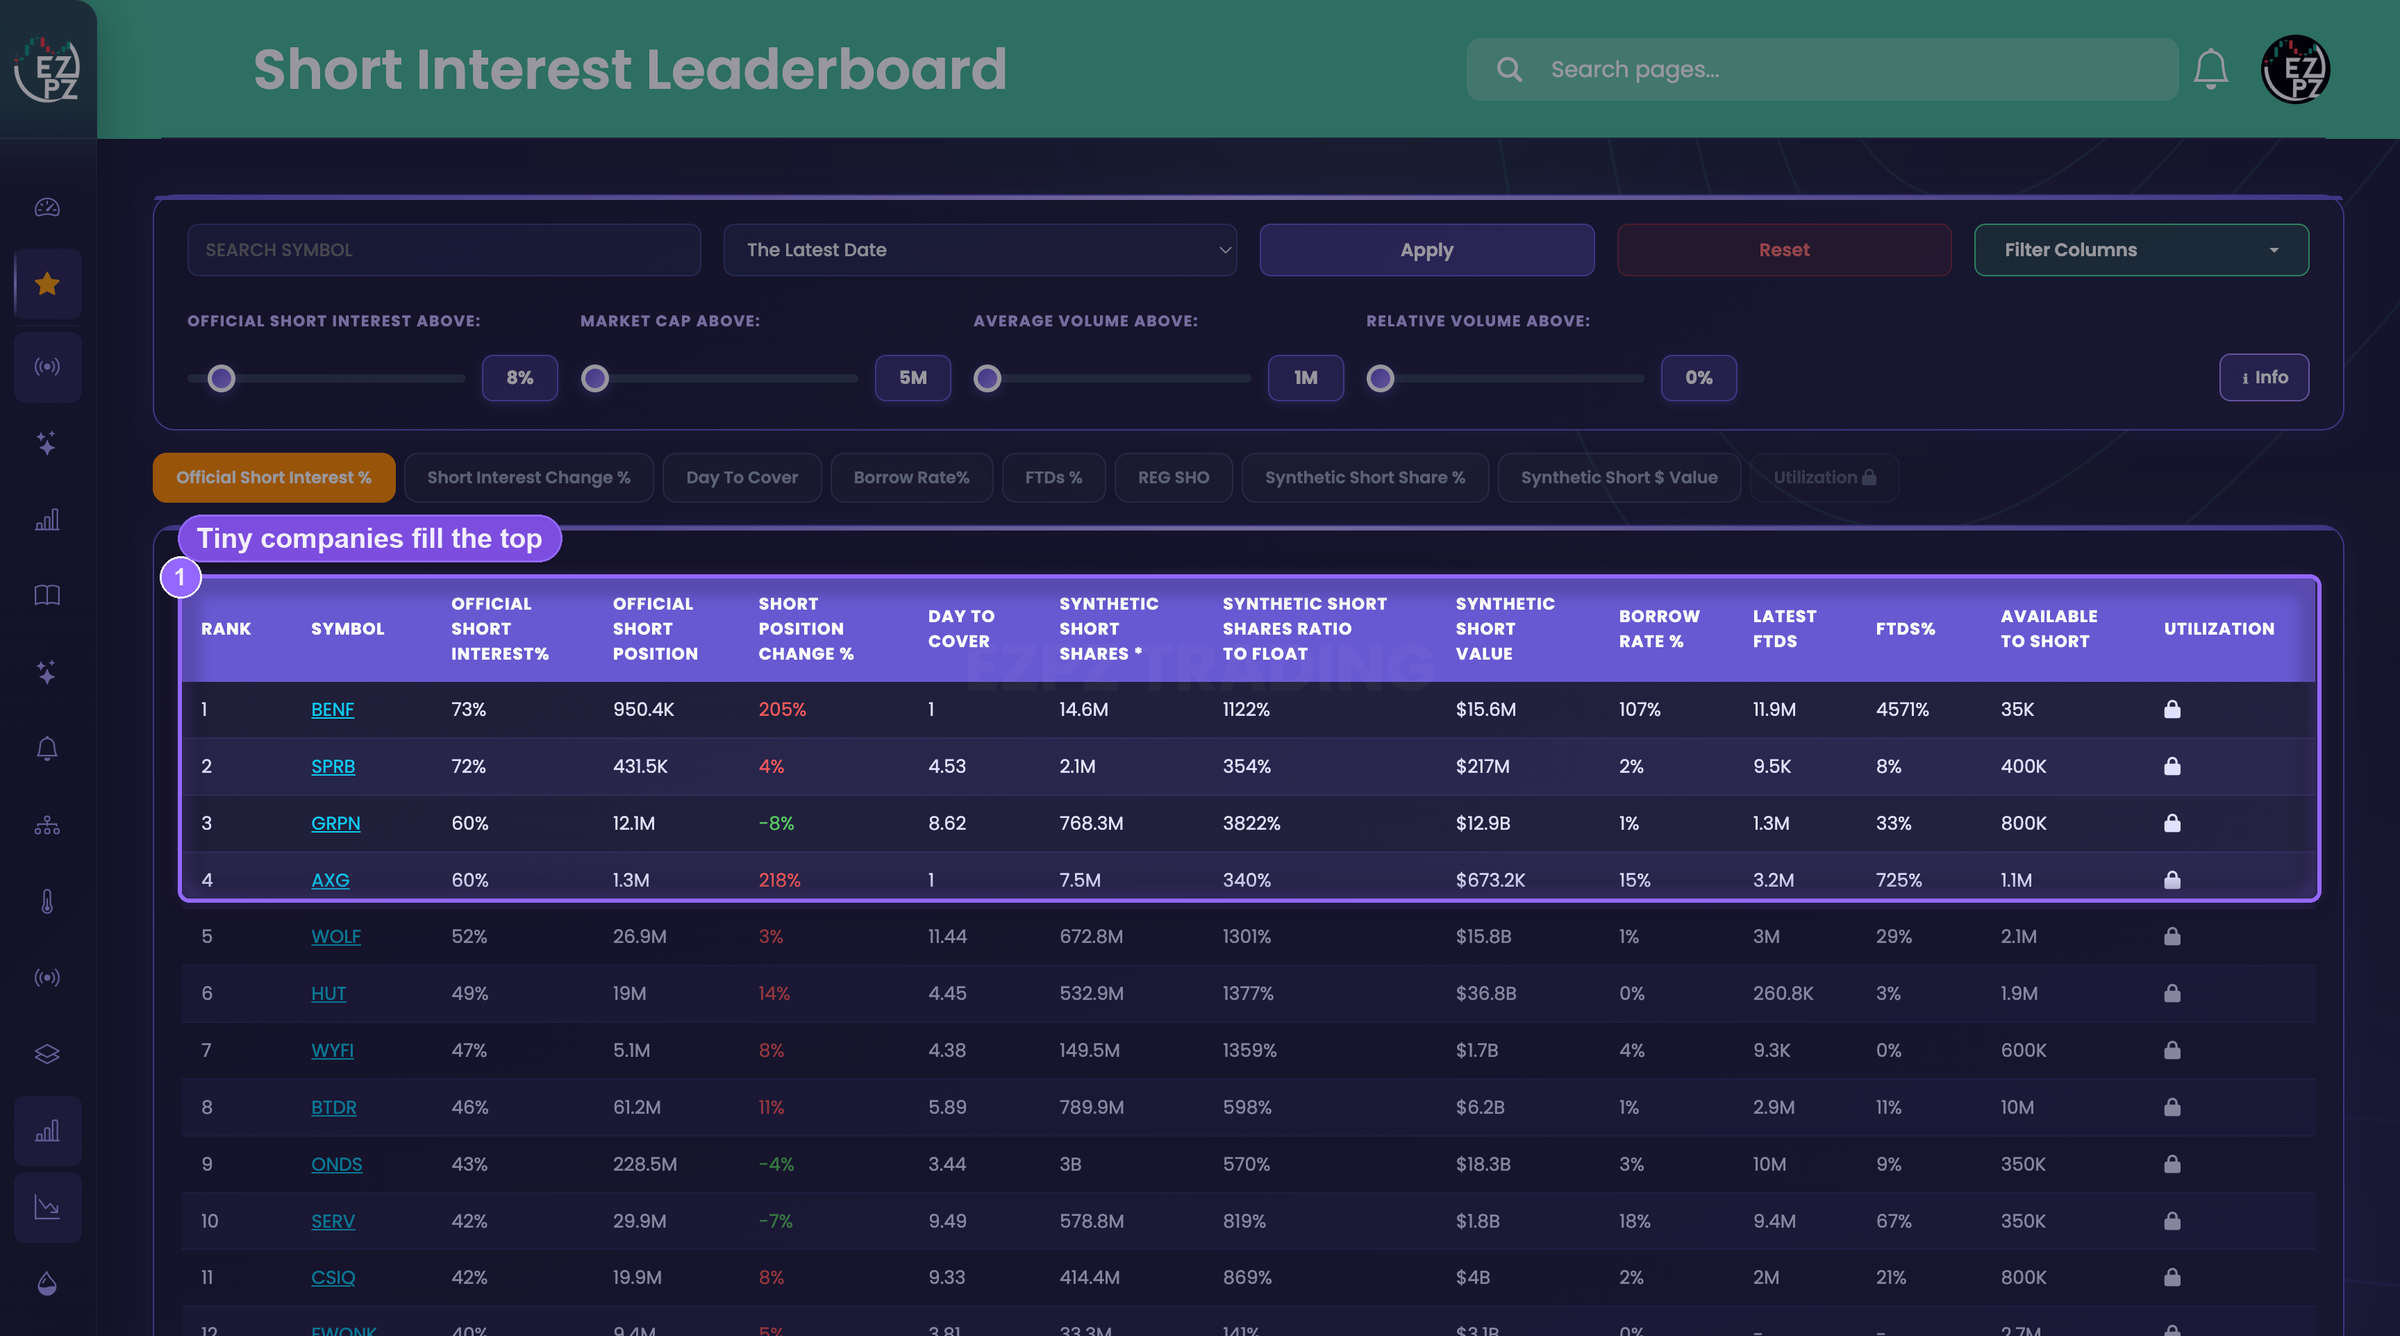
- Falling for microcap traps. Small companies lead the default leaderboard, because a few hundred thousand shares short can be a big slice of a small float. They can be hard to trade in size, and they can gap on light volume. Filter for market cap, volume, price and listed options first.
- Treating the synthetic estimate as a count. It's a model output. Use it to compare pressure across names and over time, and say "estimate" when you quote it.
Frequently asked questions
What is short interest?
It's the number of shares sold short and not yet bought back. In the US, the official figure is FINRA's consolidated short interest, reported for two settlement dates a month.
How often is short interest updated?
Twice a month. FINRA publishes each settlement about seven business days after the settlement date. The Sep 30, 2026 settlement first came out on Oct 9, 2026.
What is a high days to cover?
There's no fixed line. More days means shorts would need longer to buy back at normal volume, which can slow their exit if the price rises. Compare a stock with its own history and with similar names.
What is estimated synthetic short interest?
It's an EZPZ estimate of additional short exposure created through synthetic methods such as options, on top of officially reported borrows. Think of it as a structural pressure indicator. It isn't a precise accounting measure.
Can synthetic short interest be more than 100% of float?
Yes. The estimate includes modelled exposure from options, and options aren't capped by the number of shares that exist. A reading above 100% means the estimate is larger than the float. Nobody sold more shares than exist.
Does high short interest mean the stock will go up?
No. It means a lot of traders are betting it falls. Plenty of heavily shorted stocks keep falling.
Try it on EZPZ
If you don't have an account yet, the free delayed pages show the same views on a delay, with some rows locked: Short Interest, Short Interest Leaderboard and Short Extremes.