
Learn Center
Short Interest Leaderboard
A ranked view of stocks by short interest, useful for scanning the market for heavily shorted names rather than checking one ticker at a time.
What is a short interest leaderboard?
A short interest leaderboard is a ranked table of stocks by official short interest as a percent of float. On EZPZ it is one table. Rank starts at 1. Official Short Interest % is the starting tab. Each row is one Symbol with Day To Cover and Utilization. It is a rank, not a squeeze list.
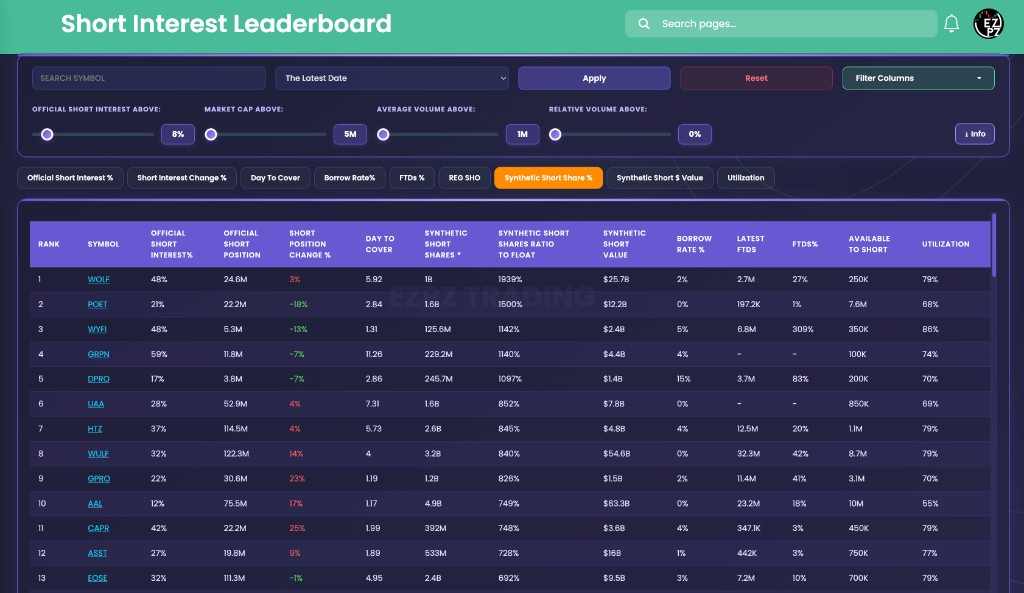
Official short interest is the exchange reported share count, shown here as Official Short Interest %. Info calls it a twice per month settlement snapshot, not live exposure. Official Short Position is the raw share count. Short Position Change % is red when that count rose versus the prior report and green when it fell. Day To Cover is Official Short Position versus typical volume. Borrow Rate %, Latest FTDs, FTDs%, Available to Short, and Utilization sit on the same row. Synthetic Short Shares * and Synthetic Short Shares Ratio To Float are labeled estimates beyond the official report. Rank 1 on Synthetic Short Share % is the highest Synthetic Short Shares Ratio To Float among names that cleared the sliders. The screenshot ranks WOLF first at 1539% with Official Short Interest% of 46%. POET sits second at 1500% with 21%. GRPN prints 59% Official Short Interest% and still sits fourth because the orange tab is Synthetic Short Share %. None of those cells is a fill.
On EZPZ, the live page title is Short Interest Leaderboard. Search Symbol, The Latest Date, Apply, Reset, and Filter Columns sit on the first row. Official Short Interest Above starts at 8%. Market Cap Above starts at 5M. Average Volume Above starts at 1M. Relative Volume Above starts at 0%. Info opens Short Interest Metrics Guide. Click a Symbol to open that ticker's Short Interest page. Short Interest is the one-ticker history after you already picked a name. ShortEx is the squeeze focused rank that blends short interest with days to cover and short volume. Short Volume is the daily short-sale share of volume, not the official percent. Short Volume Trends charts that daily percent over time. Exchange Volume Leaderboard ranks off-exchange share of volume, not short interest. Exchange Volume is the venue mix for one ticker. Gamma Short Squeeze is Squeeze Score(%) next to Gamma Pressure and Short Interest(%). Ticker Explorer is the one-symbol dashboard after you already picked a name.
How Short Interest Leaderboard works on EZPZ
Start at Rank 1 on Official Short Interest %. Click Synthetic Short Share % when you want that rank of the same table, which is the view in the screenshot. Then read Official Short Position, Short Position Change %, Day To Cover, and Utilization on the same row. It is not a score you trade. Type a ticker in Search Symbol and click Apply when you already have a name. Open Filter Columns if you want Short Position Change, Synthetic Signal, Reg SHO, Available to Short %, or Settlement Date. Reset puts the sliders back to 8%, 5M, 1M, and 0%. Do not treat WOLF as a default thesis.
How this differs from Short Interest and ShortEx
Short Interest is one ticker you already have in mind. This page ranks many names at once. Use Short Interest when you want the history for one Symbol. Use this page when you want Official Short Interest % across the market. ShortEx is a squeeze screen that combines short interest with days to cover and short volume. This table does not print a squeeze score. Use ShortEx when you want that combined rank. Use this page when you want Official Short Interest % first. Short Volume is daily short sales versus total volume. Short Volume Trends is that series over time. Neither is the official twice per month snapshot. Exchange Volume Leaderboard ranks off-exchange share of volume. Exchange Volume is venue mix for one ticker. Gamma Short Squeeze is Squeeze Score(%) next to Gamma Pressure. Use that page when you want options gamma on the same row as Short Interest(%). Use this page when you want Official Short Interest %, Day To Cover, Borrow Rate %, FTDs %, and Utilization on one official rank. Use Ticker Explorer after you already picked a symbol.
Rank tabs
The orange tab is the current rank key. The table columns stay the same. Only which names sit at Rank 1 changes. These labels match the live row. Some tabs use a shorter name than Filter Columns. Official Short Interest % starts on. The screenshot has Synthetic Short Share % orange.
| Tab | What Rank 1 means on that load |
|---|---|
| Official Short Interest % | Highest Official Short Interest %. This is the starting tab. |
| Short Interest Change % | Largest Short Position Change %. The column uses that longer label. |
| Day To Cover | Highest Day To Cover on names that still clear the sliders. |
| Borrow Rate% | Highest Borrow Rate %. The column prints Borrow Rate % with a space. |
| FTDs % | Highest FTDs%. |
| REG SHO | Names flagged on the Regulation SHO threshold list. The column is Reg SHO and starts off in Filter Columns. |
| Synthetic Short Share % | Highest Synthetic Short Shares Ratio To Float. The screenshot ranks WOLF first at 1539%. |
| Synthetic Short $ Value | Highest Synthetic Short value. The screenshot prints $25.7B on WOLF. |
| Utilization | Highest Utilization. |
Search, date, sliders, and Filter Columns
Search Symbol, The Latest Date, Apply, Reset, Filter Columns, and the four sliders sit on the filter card. The chips below are Official Short Interest %, Short Interest Change %, Day To Cover, Borrow Rate%, FTDs %, REG SHO, Synthetic Short Share %, Synthetic Short $ Value, and Utilization. Search Symbol needs Apply. Changing The Latest Date reloads the table. Reset clears Search Symbol and puts the sliders back to the defaults below.
| Control | What it does |
|---|---|
| Search Symbol | Jump to one ticker. Click Apply after you type it. |
| The Latest Date | The first option in the date list. Other options are settlement dates. Changing the date reloads the current tab. |
| Apply | Loads Search Symbol and the selected date on the current tab. |
| Reset | Clears Search Symbol, returns The Latest Date, and restores Official Short Interest Above 8%, Market Cap Above 5M, Average Volume Above 1M, and Relative Volume Above 0%. |
| Official Short Interest Above | Keeps names at or above that Official Short Interest %. Starts at 8%. |
| Market Cap Above | Keeps names at or above that market cap. Starts at 5M. |
| Average Volume Above | Keeps names at or above that average volume. Starts at 1M. |
| Relative Volume Above | Keeps names at or above that relative volume. Starts at 0%. |
| Filter Columns | Shows or hides table fields. Rank and Symbol stay on. Short Position Change, Synthetic Signal, Reg SHO, Available to Short %, and Settlement Date start off. The rest start on. |
| Info | Opens Short Interest Metrics Guide. How to Use This Dashboard says you can search by symbol or date. |
Anatomy of a rank row
Read a row left to right: Rank, then Official Short Interest %, then the cover and borrow columns you left on. You do not need every field on every name. Use the tabs if you want a map. The table pages 100 rows at a time with Previous and Next.
These columns answer who sits at the top of Official Short Interest % or Synthetic Short Share %.
| Column | What you are looking at |
|---|---|
| Rank | Position on this tab. 1 is the highest value of the active rank key among names that cleared the sliders. The screenshot prints 1 on WOLF. |
| Symbol | The ticker. Click it to open that name's Short Interest page. |
| Official Short Interest% | Official short interest as a percent of float. The screenshot prints 46% on WOLF and 21% on POET. |
| Official Short Position | The official short share count. The screenshot prints 24.6M on WOLF and 22.2M on POET. |
| Short Position Change | The share-count change versus the prior report. Red is a rise. Green is a drop. Starts off in Filter Columns. |
| Short Position Change % | That change as a percent. Red is a rise. Green is a drop. The screenshot prints 3% on WOLF and -18% on POET. |
| Day To Cover | How many sessions of typical volume it would take to cover Official Short Position. The screenshot prints 5.92 on WOLF and 2.84 on POET. |
| Settlement Date | The official settlement date for that short interest print. Starts off in Filter Columns. Info says this date shows how current the snapshot is. |
These columns are labeled estimates beyond the official report. They are not the FINRA percent.
| Column | What you are looking at |
|---|---|
| Synthetic Short Shares * | Estimated extra short exposure beyond Official Short Position. The screenshot prints 1B on WOLF and 1.6B on POET. |
| Synthetic Short Shares Ratio To Float | That estimate versus float. The screenshot prints 1539% on WOLF and 1500% on POET. The Synthetic Short Share % tab ranks this field. |
| Synthetic Short value | That estimate in dollars. The screenshot prints $25.7B on WOLF and $12.2B on POET. The Synthetic Short $ Value tab ranks this field. |
| Synthetic Signal | A row tag derived from the synthetic columns. Starts off in Filter Columns. |
These columns answer how tight the borrow looks on the same row.
| Column | What you are looking at |
|---|---|
| Borrow Rate % | Annualized cost to borrow shares. The screenshot prints 2% on WOLF and 0% on POET. |
| Latest FTDs | The most recently reported fail-to-deliver share count. A dash means the feed has no print. The screenshot prints 2.7M on WOLF and 197.2K on POET. |
| FTDs% | Fails to deliver as a percent. The screenshot prints 27% on WOLF and 1% on POET. |
| Reg SHO | Whether the name is on the Regulation SHO threshold list. Starts off. The REG SHO tab still re-ranks the table. |
| Available to Short | Shares shown as available to borrow. The screenshot prints 250K on WOLF and 7.6M on POET. |
| Available to Short % | That availability as a percent. Values above 90 print as +90%. Starts off. |
| Utilization | A percent of stress on shorts on this row. Info says readings above 80 to 90 percent often reflect elevated short pressure. The screenshot prints 79% on WOLF and 68% on POET. |
How people actually use it
Start on Official Short Interest %
Leave the orange tab on Official Short Interest % first. Switch to Synthetic Short Share % when you want the ratio rank, as in the screenshot with WOLF at 1539%.
Watch the color on change
Red Short Position Change % is a larger official short book versus the prior report. Green is covering on that print. UAA at 4% is not the same row as POET at -18%.
Switch tabs without leaving the table
Use Day To Cover, Borrow Rate%, FTDs %, or Utilization when you want a different rank of the same names. The sliders stay put.
Open the one-ticker page
Click Symbol for Short Interest. Use ShortEx or Gamma Short Squeeze when you want a squeeze rank instead of this official percent board.