How to read Largest Net Premiums: bullish vs bearish flow by ticker
On November 11, 2026, SPY led the Bullish Flow list with +$97.39M in net premium, while SPX topped the Bearish Flow list at +$28.77M and META showed +$19.95M. Here is how to read every column and tab on the Largest Net Premiums leaderboard.

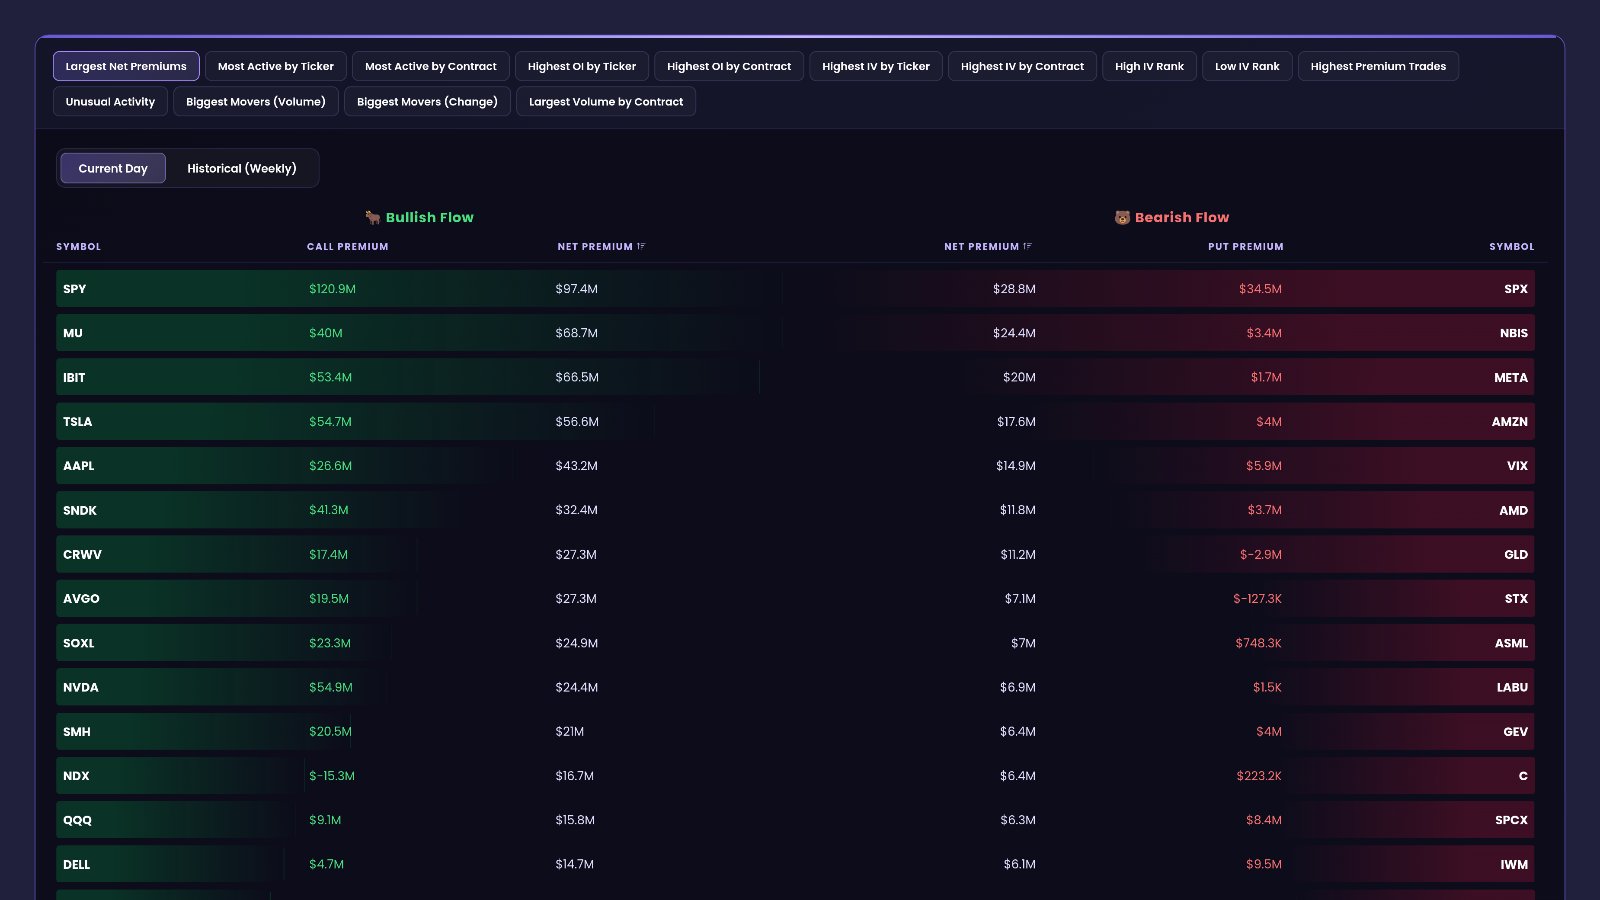
On Wednesday, November 11, 2026, SPY sat at the top of the Bullish Flow list with +$97.39M in net premium, with MU at +$68.69M and TSLA at +$56.59M behind it. On the other side, SPX led the Bearish Flow list at +$28.77M, and META showed +$19.95M. One screen tells you which big names options traders are leaning on, and which way.
Quick definition first. Premium is the dollar amount paid for options contracts. Call Premium is the dollar premium on the call side for a ticker. Put Premium is the same for the put side. Net Premium brings both sides together into one directional number, so you can see the overall lean for that ticker. The Largest Net Premiums leaderboard ranks tickers by this lean: bullish names on the left, bearish names on the right. No account? Open the free delayed Largest Net Premiums page and follow along.
+$97.39M
+$28.77M
+$19.95M
What the Largest Net Premiums leaderboard helps you see
Price tells you what happened. Options premium tells you where traders put real money during the session. This page ranks that money by ticker, so you can see in seconds which large names drew a clear one-way lean.
Two lists, two directions
The leaderboard splits names into two lists side by side. The left list is Bullish Flow. The right list is Bearish Flow. Each list is ranked from the biggest lean down. A name near the top of either list carried one of the strongest leans of the day.
Why Net Premium matters more than one side alone
A big Call Premium number looks bullish. But if puts also drew heavy premium, the overall lean is smaller. Net Premium shows you the lean after both sides are counted. That is why the lists are ranked by it in the Current Day view shown here.
- Net Premium higher than Call Premium (bullish list): the put side added to the bullish lean. MU shows +$40.04M Call Premium and +$68.69M Net Premium.
- Net Premium lower than Call Premium (bullish list): the put side pulled the lean back. NVDA shows +$54.88M Call Premium and +$24.41M Net Premium.
- Negative Call Premium but positive Net Premium: the lean came from the put side, not from calls. NDX shows -$15.35M Call Premium and +$16.66M Net Premium.
Why swing traders care
Swing traders watch for a change of direction in the big names. A ticker that usually sits on the bullish list and suddenly shows up on the bearish list is worth a second look. So is an index that tops one side while its related ETF tops the other. This page makes those contrasts easy to spot.
Walking through the tab, top to bottom
Largest Net Premiums
At the top of the panel is a row of tabs. Largest Net Premiums is the one this post reads. The others open their own leaderboards:
- Most Active by Ticker and Most Active by Contract: the most traded tickers and the most traded single contracts.
- Highest OI by Ticker and Highest OI by Contract: where open interest (contracts still open) is largest.
- Highest IV by Ticker and Highest IV by Contract: where implied volatility (how much movement options are pricing) is highest.
- High IV Rank and Low IV Rank: names whose implied volatility sits high or low compared with their own usual range.
- Highest Premium Trades: the single trades with the most premium.
- Unusual Activity: options activity that stands out from normal.
- Biggest Movers (Volume) and Biggest Movers (Change): contracts with the biggest jumps in volume or price. See Biggest Movers (Change) by Contract.
- Largest Volume by Contract: the single contracts with the most volume.
Below the tabs sit the two lists. In the data shown here, the view is Current Day and both lists are sorted by Net Premium.
Bullish Flow list
This is the left list. It ranks names where the overall lean is bullish. Its columns:
- Symbol -- the ticker. Read it as "who".
- Call Premium -- the dollar premium on the call side for that ticker. A large plus number means calls drew heavy money. A minus number means the call side worked against the bullish lean.
- Net Premium -- the overall bullish lean once calls and puts are both counted. Bigger means a stronger bullish lean. This is the column the list is ranked by.
Read the top row across: SPY, Call Premium +$120.89M, Net Premium +$97.39M. Calls drew the most money on the list, and SPY kept most of that lean after puts were counted. Now read TSLA: Call Premium +$54.71M, Net Premium +$56.59M. The two numbers are close, so the TSLA lean came almost entirely from calls.
Notice AAPL: Call Premium +$26.62M, Net Premium +$43.22M. Like MU, its net lean is bigger than its call side, so puts added to the bullish read. QQQ is lower down at +$15.82M Net Premium on +$9.14M Call Premium, well below SPY.
Bearish Flow list
This is the right list. It ranks names where the overall lean is bearish. Its columns:
- Symbol -- the ticker.
- Put Premium -- the dollar premium on the put side for that ticker. A plus number means puts drew money. A minus number means the put side worked against the bearish lean.
- Net Premium -- the size of the overall bearish lean. On this list, a bigger plus number means a stronger bearish lean.
Read the top row: SPX, Put Premium +$34.47M, Net Premium +$28.77M. Puts drew real money, and most of that lean held after calls were counted. Now read META: Put Premium +$1.75M, Net Premium +$19.95M. The put side is small, so META's bearish lean came mostly from the call side, not from heavy put buying. AMZN reads the same way: Put Premium +$3.97M, Net Premium +$17.55M.
GLD shows the reverse sign case: Put Premium -$2.92M but Net Premium +$11.19M. The put side worked against the lean, and the bearish read came from calls. Further down, SPCX shows +$8.40M Put Premium and +$6.30M Net Premium, and IWM shows +$9.54M and +$6.05M.
How to use the Largest Net Premiums on EZPZ: a 5-minute routine
This is the exact routine, with the real screens from November 11, 2026. The yellow numbers show where to look.
Start on the Largest Net Premiums tab and know the tab row
Open the Largest Net Premiums leaderboard. The tab row above the lists links to other leaderboards: (1) Most Active by Ticker, (2) Highest OI by Ticker, (3) Highest IV by Ticker and (4) High IV Rank. Stay on Largest Net Premiums first and read the top of each list: SPY at +$97.39M on the bullish side, SPX at +$28.77M on the bearish side. Then use (1) to check whether a leader is also among the most traded names, (2) to see where open interest is largest, and (3) and (4) to see whether options on that name are pricing big moves.

Compare the two columns and check again before the close
For each big name, put Call Premium (or Put Premium) next to Net Premium. If they are close, like TSLA at +$54.71M and +$56.59M, the lean is one-sided. If they are far apart, like NVDA at +$54.88M and +$24.41M, the other side pushed back. Look again late in the session: the lists rank the whole day, so the leaders can change.
Reading the page in plain English
Put the two lists together and the page tells a simple story about where options money leaned. On November 11, 2026, SPY, TSLA, AAPL and NVDA sat on the bullish side, while SPX, META, AMZN and SPCX sat on the bearish side.
- If a name tops the Bullish Flow list with Call Premium and Net Premium close together, the page reads as a one-sided call lean (TSLA: +$54.71M and +$56.59M).
- If Net Premium on the bullish list is well above Call Premium, the page reads as calls and puts both pointing bullish (MU: +$40.04M and +$68.69M).
- If Call Premium is large but Net Premium is much smaller, the page reads as a bullish lean with real pushback from puts (NVDA).
- If a name sits on the Bearish Flow list with a tiny Put Premium but a large Net Premium, the page reads as a bearish lean driven by the call side (META: +$1.75M and +$19.95M).
- If an index ETF and its index sit on opposite lists, like SPY on the bullish side and SPX on the bearish side, the page reads as mixed positioning across the two products, not one clean market lean.
What this data cannot tell you
- Direction. A bullish or bearish lean shows where premium went, not where price goes next. Heavy call premium can sit next to a falling stock.
- Timing. The lists rank the session as a whole. They do not show when in the day the premium came in or whether it came in one burst.
- Intent. The page does not show why anyone traded. Premium on one side can be a hedge, a new bet or a closing trade, and the list looks the same.
Common mistakes
- Reading Call Premium as the lean. Rank and lean come from Net Premium; NVDA's large call side did not make it a top bullish name.
- Ignoring minus signs. NDX's -$15.35M Call Premium and GLD's -$2.92M Put Premium change how you read their rows.
- Treating a plus number on the bearish list as bullish. On Bearish Flow, a bigger plus Net Premium means a stronger bearish lean.
- Mixing up the tabs. Most Active, Highest OI and the other tabs are separate leaderboards with their own data.
- Calling the lean a forecast. The page describes the session's flow. It is not a signal of what price will do.
Tools used in this post
These EZPZ tools pair well with the Largest Net Premiums leaderboard when you want to dig into a name's flow.
Which plan you need
| Tool | Plan | Free delayed page |
|---|---|---|
| EZPZ Picks | Pro | Yes |
| 0DTE Graph | Pro | Yes |
| 7-DTE Graph | Pro | Yes |
| Net Premium Heatmap | Pro | Yes |
| Expected Move | Pro | Yes |
| GEX Heatmap | Premium | None |
FAQ
What is Net Premium on this page?
It is one number that shows a ticker's overall options lean once both calls and puts are counted. On the Bullish Flow list it shows the size of the bullish lean; on the Bearish Flow list it shows the size of the bearish lean.
Why can Net Premium be bigger than Call Premium?
Because the put side can add to the same lean. MU shows +$40.04M Call Premium and +$68.69M Net Premium, so its puts pointed bullish too.
Why is a name with a minus Call Premium on the bullish list?
Its bullish lean came from the put side. NDX shows -$15.35M Call Premium and still +$16.66M Net Premium.
Does a top bullish rank mean the stock goes up?
No. The ranking shows where premium leaned during the session. It does not predict price. Treat it as one reading among several.
Can I use the page without an account?
Yes. The free delayed Largest Net Premiums page shows the same layout on a delay.
What are the other tabs at the top?
They are separate leaderboards, such as Most Active by Ticker, Highest OI by Ticker, Highest IV by Ticker and High IV Rank. Each one ranks names by its own measure.