How to read the Greeks heatmap: GEX, VEX, CEX, DEX, OI and Gravity
SPY sits at $769.05, right on a -$763.40M red GEX cell at the $769 strike, and Gravity ranks that same strike #1 with a score of 68.4. Here is how to read every toggle on the Greeks Heatmap.

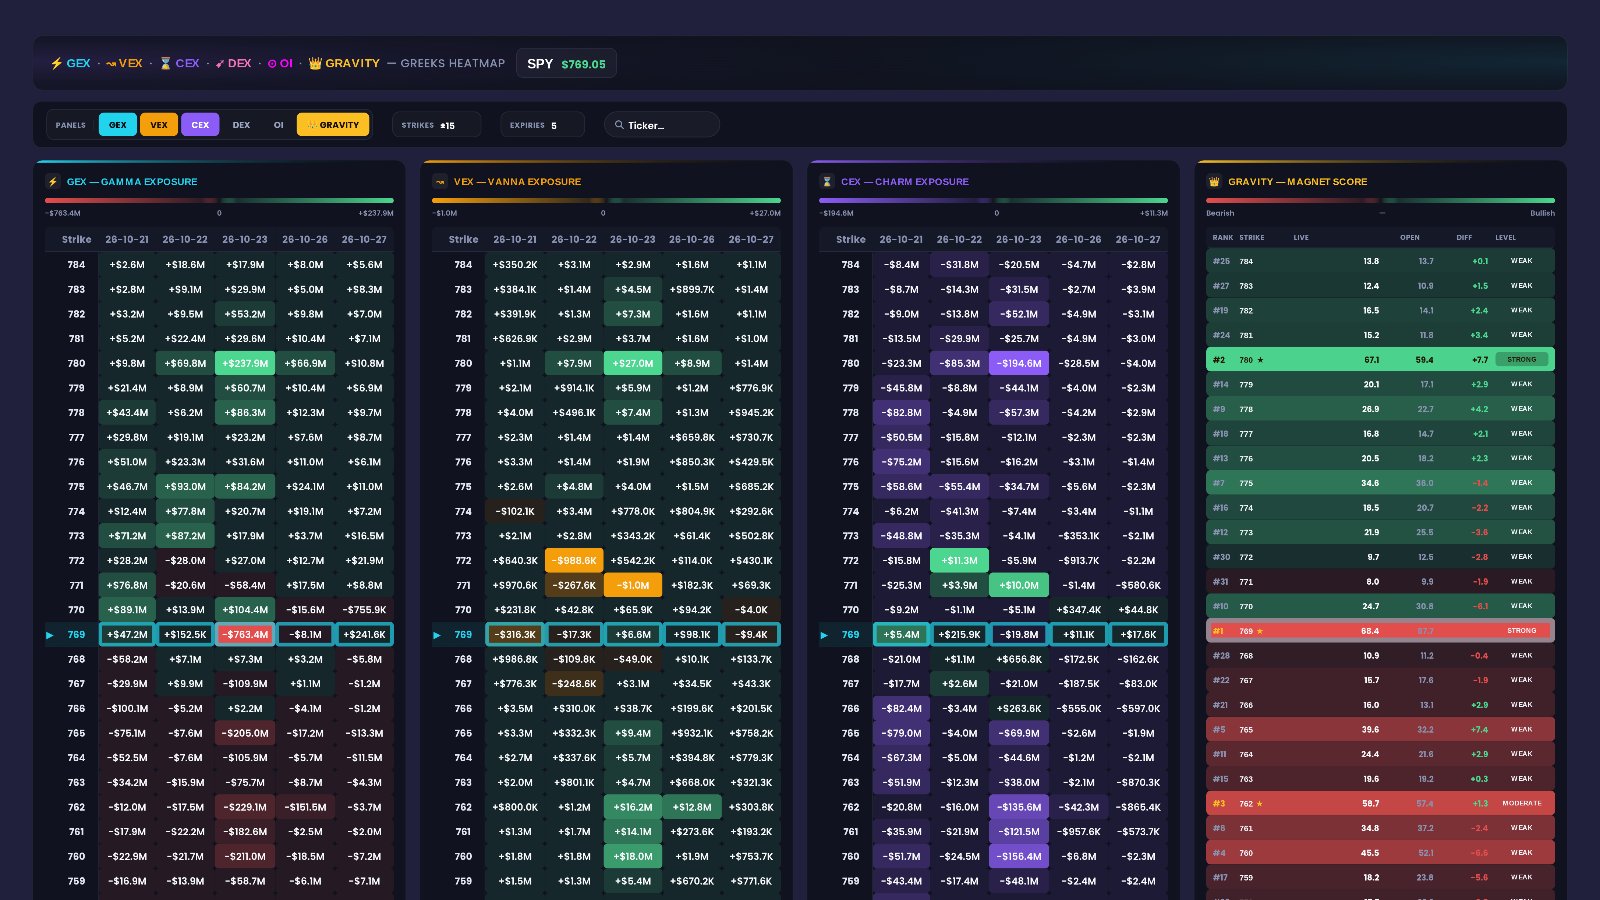
In the latest data, SPY trades at $769.05, and the single largest cell on the gamma grid sits right at the $769 strike: -$763.40M of GEX on the 2026-10-23 expiry. One strike up, the $770 cell on the same expiry is green at +$104.42M. Gravity ranks $769 first with a score of 68.4, tagged bearish. When price sits on a strike like that, the Greeks Heatmap shows you at a glance which levels the options market is crowded around.
The Greeks Heatmap puts all of this on one screen. You get several grids of strikes by expiration, one for each Greek, plus a ranked Gravity list.
Quick definition first. Option dealers hedge the positions they hold, and the Greeks describe how much hedging sits at each strike. GEX (gamma exposure) shows how dealer hedging reacts to price moves. VEX (vanna exposure) shows hedging tied to changes in implied volatility. CEX (charm exposure) shows hedging tied to the passage of time. DEX (delta exposure) is the plain directional hedge at a strike. OI is net open interest, meaning the open contracts at that strike and expiry. Gravity ranks the strikes with the strongest pull on price and tags each one bullish or bearish. Green cells are positive values. Red cells are negative.
-$763.40M
$769.05
68.4
What the Greeks Heatmap helps you see
Most options tools give you one number for the whole ticker. This page breaks the picture down by strike and by expiration. You can see where hedging is stacked, and which expiry it sits in.
Green walls and red zones
On the GEX grid, green means positive gamma. Traders usually read it as hedging that leans against moves, which tends to calm price near that strike. Red means negative gamma. Traders read that as hedging that can add to moves in either direction. A deep color means a big value. A pale color means a small one.
The flip between them
The strike where GEX changes from red to green is the pivot most traders look for first. In the latest SPY data, the largest red cell is $769 and a large green cell sits right above at $770, both on the 2026-10-23 expiry. With price at $769.05, SPY is sitting right at that change of color. If you want the full background on walls and the flip, see how to read gamma exposure.
Why several Greeks on one page
Each Greek answers a different question:
- GEX: where hedging may calm or speed up price.
- VEX: where hedging is most sensitive to a volatility shift, which matters most around big events.
- CEX: where time decay changes the hedge. Traders watch it most into the close.
- DEX: the rawest directional hedge at a strike.
- OI: whether real open contracts sit behind a level.
- Gravity: one ranking of the strikes that stand out most.
When several panels point at the same strike, that strike carries more meaning than any single cell.
Walking through the tab, top to bottom
Everything on this tab is driven by one row of controls at the top. Here is what each part does and what it shows for SPY.
Toolbar
The toolbar reads, left to right: GEX · VEX · CEX · DEX · OI · 👑 GRAVITY, then ±10 ±15 ±20 ±25, then 1 2 3 5 10, then a search box marked "Ticker…". The first six buttons turn panels on and off. The next two groups set how much of the board you see. The search box changes the ticker.
GEX toggle
Turns on the gamma exposure grid: strikes down the side, expirations across the top. In the latest data, the biggest cells are:
- $769, 2026-10-23: -$763.40M (deep red, the largest on the board)
- $780, 2026-10-23: +$237.94M (the largest green)
- $762, 2026-10-23: -$229.10M
- $760, 2026-10-23: -$210.97M
- $770, 2026-10-23: +$104.42M
- $775, 2026-10-22: +$92.97M
Read it this way: the 2026-10-23 column holds most of the color. Red clusters at and below price ($769, $762, $760). Green sits above price ($770, $780).
SPY net GEX by strike
VEX toggle
Turns on the vanna exposure grid. Treat a large VEX cell as a spot where hedging is sensitive to volatility. Its sign marks where that sensitivity is concentrated, not a calm-or-fast call like GEX. For SPY, the largest green cells are $780 on 2026-10-23 at +$26.97M, $760 at +$18.00M and $762 at +$16.17M. The red side is small by comparison: $771 on 2026-10-23 at -$1.02M, $772 on 2026-10-22 at -$988.6K and $769 on 2026-10-21 at -$316.3K. Notice that $780, $760 and $762 show up again. Those strikes keep appearing.
CEX toggle
Turns on the charm exposure grid. This is time-driven hedging, and traders watch it most near the close. The biggest SPY cells are red: $780 on 2026-10-23 at -$194.64M, $760 at -$156.38M and $762 at -$135.60M. The green side is smaller: $772 on 2026-10-22 at +$11.26M, $771 on 2026-10-23 at +$10.00M and $769 on 2026-10-21 at +$5.43M. Again, the same three big strikes lead.
DEX toggle
Turns on the delta exposure grid, the plain directional hedge at each strike. For SPY, the largest red cell is $769 on 2026-10-23 at -$10.47M. Next come $762 on 2026-10-26 at -$1.87M and $762 on 2026-10-23 at -$1.75M. The green side shows $770 on 2026-10-23 at +$1.78M, $755 on 2026-10-23 at +$912.4K and $770 on 2026-10-21 at +$720.6K. In the latest view, DEX was switched off. Click it to add the grid.
OI toggle
Turns on the net open interest grid. It shows whether real contracts sit behind a Greek reading. For SPY, the deepest red cell is $769 on 2026-10-23 at -$30.2K, followed by $760 at -$14.9K and $762 at -$13.8K. The greenest cells are $780 on 2026-10-23 at +$17.1K, $780 on 2026-10-22 at +$6.2K and $784 on 2026-10-22 at +$6.0K. OI was also off in the latest view.
👑 GRAVITY toggle
Turns on the Gravity ranking. It lists strikes by rank, each with a score and a direction tag. For SPY:
| Rank | Strike | Score | Direction |
|---|---|---|---|
| #1 | $769 | 68.4 | bearish |
| #2 | $780 | 67.1 | bullish |
| #3 | $762 | 58.7 | bearish |
Read the first row across: $769 has the strongest pull, scores 68.4 and leans bearish. The second row is close behind: $780 scores 67.1 and leans bullish. Two near-equal magnets pointing opposite ways is the key thing this board shows. EZPZ's method is proprietary.
Strikes (±10 ±15 ±20 ±25) and expirations (1 2 3 5 10)
The ± buttons set how many strikes each grid shows around price. Small values zoom in. Large values show far-away walls. The 1 to 10 buttons set how many expiration columns you see. In the latest SPY view, the board showed 15 strikes and 5 expirations, centered on the $769 strike.
Search box "Ticker…"
Type a symbol to load the same grids for another ticker. QQQ, NVDA or TSLA work the same way as SPY.
How to use the Greeks Heatmap on EZPZ: a 5-minute routine
This is the exact routine, using the latest data.
Find price and the center strike
Open the Greeks Heatmap and type the ticker in the search box. For SPY, price is $769.05 and the grid is centered on $769. Get your bearings here before you read any color.
Scan GEX for the deepest red and green
Look for the deepest red cell and the deepest green cell near price. For SPY, red is $769 at -$763.40M and green is $780 at +$237.94M, both on 2026-10-23. Price sits on the red, with green above it.
Cross-check with Gravity
Turn on 👑 GRAVITY. If the top strikes match the GEX walls, the level has more support. Here they match: $769 is #1 (68.4, bearish) and $780 is #2 (67.1, bullish).
Layer in VEX, CEX, DEX and OI
Toggle the other panels to see if the same strikes repeat. For SPY, $780, $760 and $762 lead both VEX and CEX, and OI shows its deepest red at $769 with -$30.2K. Repeats across panels mean a crowded strike.
Check again before the close
Come back late in the day and reread CEX, since charm matters most into the close. Then compare with the 0DTE Graph to see same-day flow.
Reading the page in plain English
Put together, the latest SPY board shows price sitting on a big red gamma strike, with a green wall above it and two near-equal Gravity magnets that lean opposite ways.
- If price sits on a deep red GEX cell like $769 at -$763.40M, the page reads as price in a zone where hedging can add to moves.
- If price is below a large green cell like $780 at +$237.94M, the page reads as a possible stabilizing wall overhead.
- If the top two Gravity strikes score close together but carry opposite tags, as $769 (bearish) and $780 (bullish) do, the page reads as a contested board, not a one-sided one.
- If the same strikes repeat across GEX, VEX, CEX and OI, the page reads as heavy positioning at those levels.
- If one expiry column holds most of the color, as 2026-10-23 does here, the page reads as that expiry dominating the picture.
What this data cannot tell you
- Direction. A red or green cell shows where hedging is stacked, not which way price goes next.
- Timing. The grid does not say when price might reach a strike, or how long a level stays important.
- Who holds the trades. The page shows exposure by strike and expiry, not the intent behind any single position.
Common mistakes
- Reading only one panel. GEX alone misses whether VEX, CEX and OI confirm the same strike.
- Ignoring the expiry column. A big cell on 2026-10-23 is not the same as one on 2026-10-26.
- Treating Gravity as a forecast. A bearish tag on $769 describes a lean, not a call on price.
- Zooming in too tight. At ±10 you can miss a wall like $780; widen the strikes to check.
- Reading VEX or CEX signs like GEX. Their colors mark concentration, not calm versus fast markets.
Tools used in this post
These are the EZPZ tools that go with the Greeks Heatmap in this walkthrough.
Which plan you need
| Tool | Plan | Free delayed page |
|---|---|---|
| Greeks Heatmap | Premium | None |
| 0DTE Graph | Pro | Yes |
| 7-DTE Graph | Pro | Yes |
| Net Premium Heatmap | Pro | Yes |
| Expected Move | Pro | Yes |
| GEX Heatmap | Premium | None |
FAQ
What is the difference between GEX, VEX, CEX and DEX?
GEX tracks hedging tied to price moves, VEX tracks hedging tied to volatility, CEX tracks hedging tied to time, and DEX is the plain directional hedge. Each gets its own grid on the page.
What does a deep red GEX cell mean?
A large negative gamma value at that strike and expiry. Traders read it as a zone where hedging can add to moves. For SPY, the deepest is $769 at -$763.40M.
What does the Gravity score show?
It ranks the strikes with the strongest pull on price and tags each bullish or bearish. For SPY, $769 leads at 68.4. EZPZ's method is proprietary.
Why are some panels off when I open the page?
Each panel has its own toggle in the toolbar. In the latest SPY view, GEX, VEX, CEX and Gravity were on, and DEX and OI were off. Click a button to add or hide a grid.
How do I see more strikes or expirations?
Use the ±10 to ±25 buttons for strikes and the 1 to 10 buttons for expirations. Wider settings show far walls. Tighter settings zoom in on price.
Where can I learn more about options Greeks?
The Learn center covers the basics. You can also pair this page with Expected Move to see the range options are pricing.