How to read gamma exposure: call wall, put wall and the flip (real SPY example)
SPY sat at $778.01 with a call wall at 781, a put wall at 774 and the gamma flip right under price. Here is how to read every one of those levels on EZPZ, step by step, with the real screens.

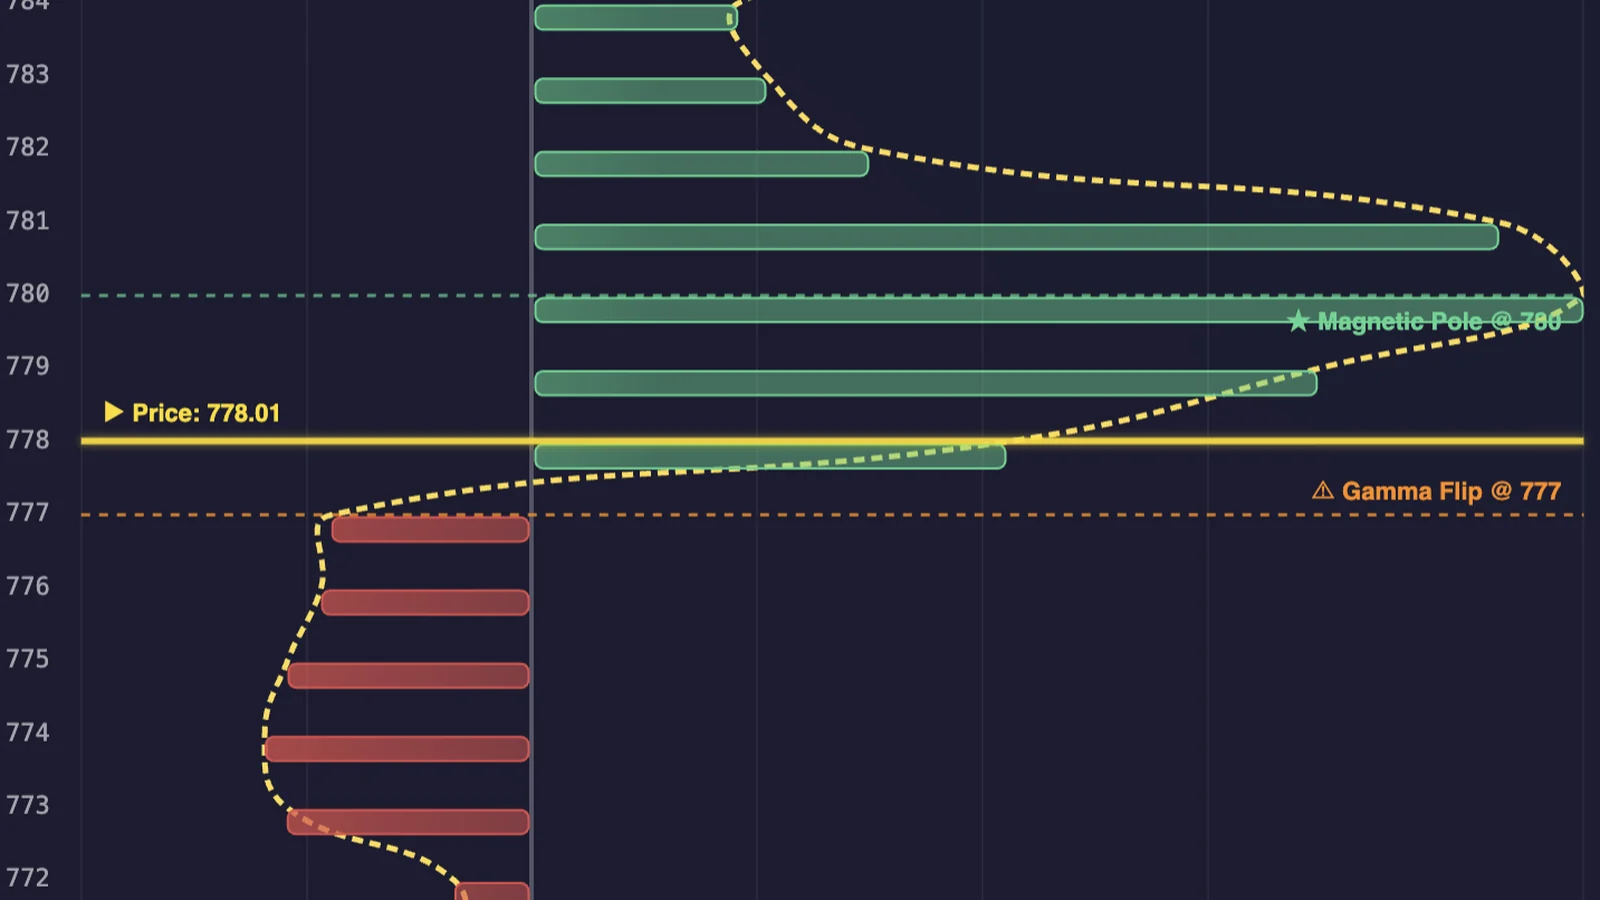
SPY was trading at $778.01. Above it, a wall of call gamma at 781. Below it, a wall of put gamma at 774. And the gamma flip sitting almost exactly on the price. That one picture tells you more about how the day might trade than most headlines will. This guide shows you how to read it, using the real screens from EZPZ on October 14, 2026.
Quick definition first. Gamma exposure (GEX) is an estimate of how much options dealers may need to buy or sell the underlying as price moves. The call wall is the strike with the largest positive net GEX. The put wall is the strike with the most negative net GEX. The gamma flip is where total exposure changes sign. All three are modelled estimates. Read them as context, not forecasts.
Why dealer hedging matters
When you buy an option, the firm on the other side is usually a market maker. Market makers don't want to bet on direction, so they hedge by trading the stock or ETF. Delta tells them how many shares to hold. Gamma tells them how fast that number changes when price moves.
Add up gamma across every open contract on a ticker and you get a rough map of how much hedging could hit the tape, and at which prices. That map is gamma exposure.
How GEX is usually calculated
For each strike: open interest, times the contract's gamma, times the 100-share multiplier, scaled by the underlying price. The common public convention assumes dealers are long customer calls and short customer puts, so call gamma counts as positive and put gamma as negative. That assumption is the weak point of every GEX model, and each provider makes its own choices. EZPZ doesn't publish its exact method, so treat every number as an estimate.
Positive vs negative gamma
- Positive net gamma. Dealers who are long gamma tend to sell into rallies and buy into dips. That can dampen moves and pull price toward big strikes.
- Negative net gamma. Dealers who are short gamma may need to buy as price rises and sell as price falls. That can add fuel to whatever move is already happening.
These are tendencies, not rules. Earnings, data and headlines can overwhelm them in minutes.
The three levels traders watch
Call wall
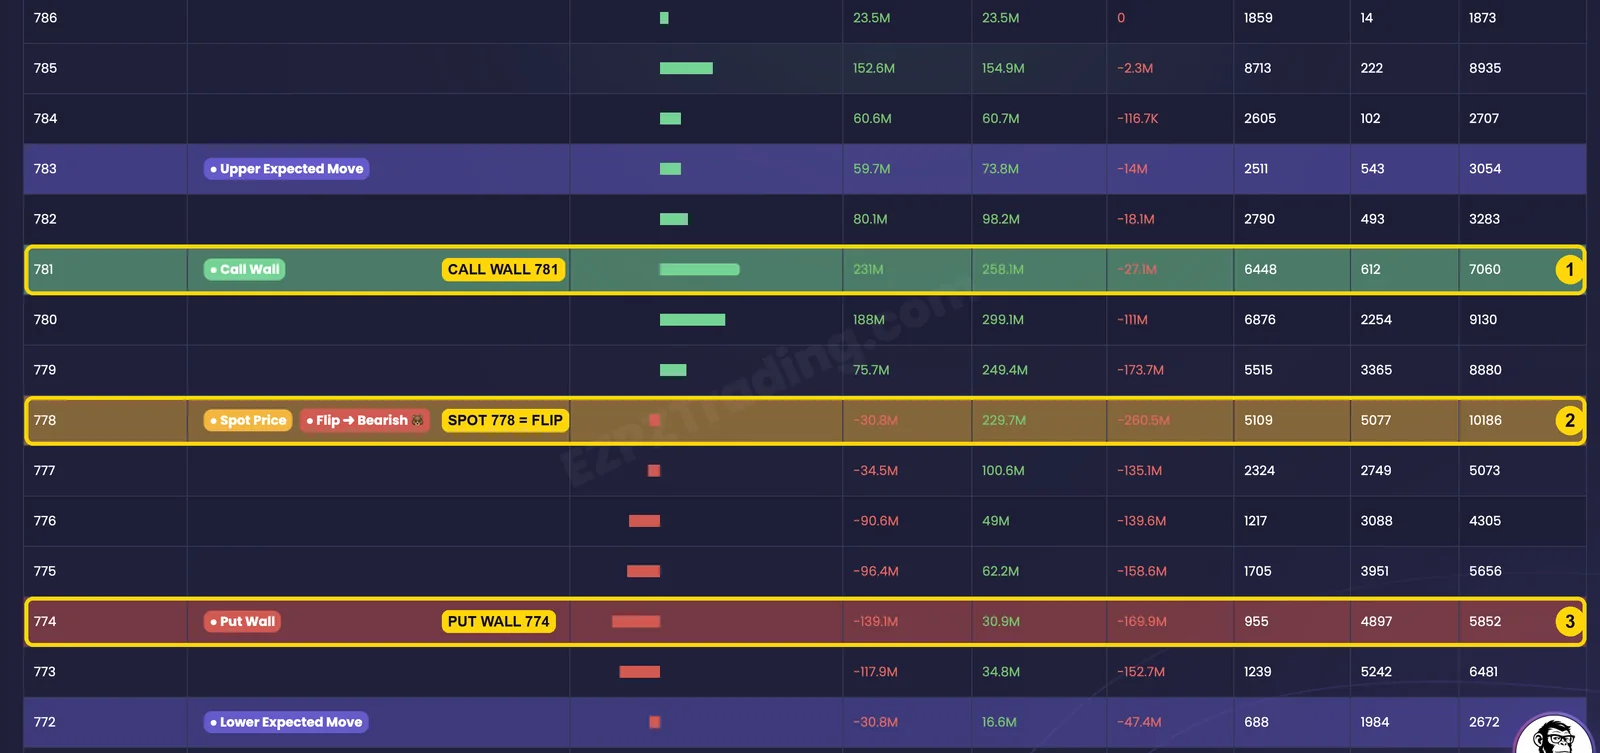
The strike with the largest positive net GEX. On our SPY capture that was 781, with an estimated +231M net GEX and 7,060 contracts of open interest. Traders mark it as a level where hedging may lean against more upside. It is not a ceiling. Strong trends run through call walls all the time.
Put wall
The strike with the most negative net GEX. On the same capture: 774, at an estimated -139.1M. Traders watch it as a level where hedging can change character on the way down. It is not a floor either.
Gamma flip
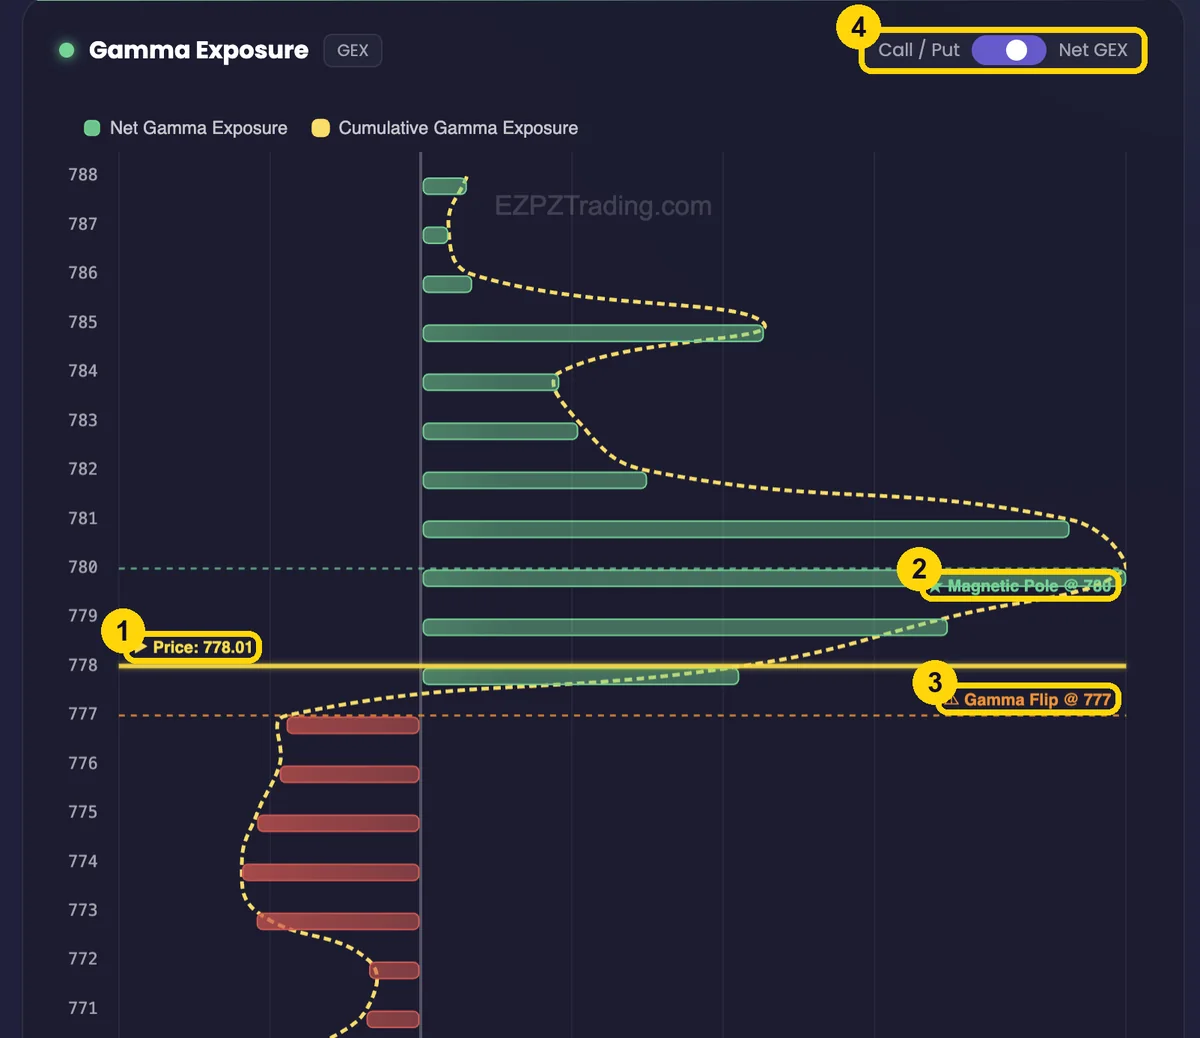
The price where total exposure flips sign, sometimes called the zero gamma line. On Oct 14 it sat right at price. The strike table tagged 778 as the flip, and the intraday chart drew it at 777. The two pages are built differently, but they say the same thing: SPY was sitting on the line between a calmer tape and a faster one.
How to use GEX on EZPZ: a 5-minute routine
This is the exact routine, with the real screens from Oct 14. The yellow marks show where to look.
Load the ticker, the expiry and the strikes
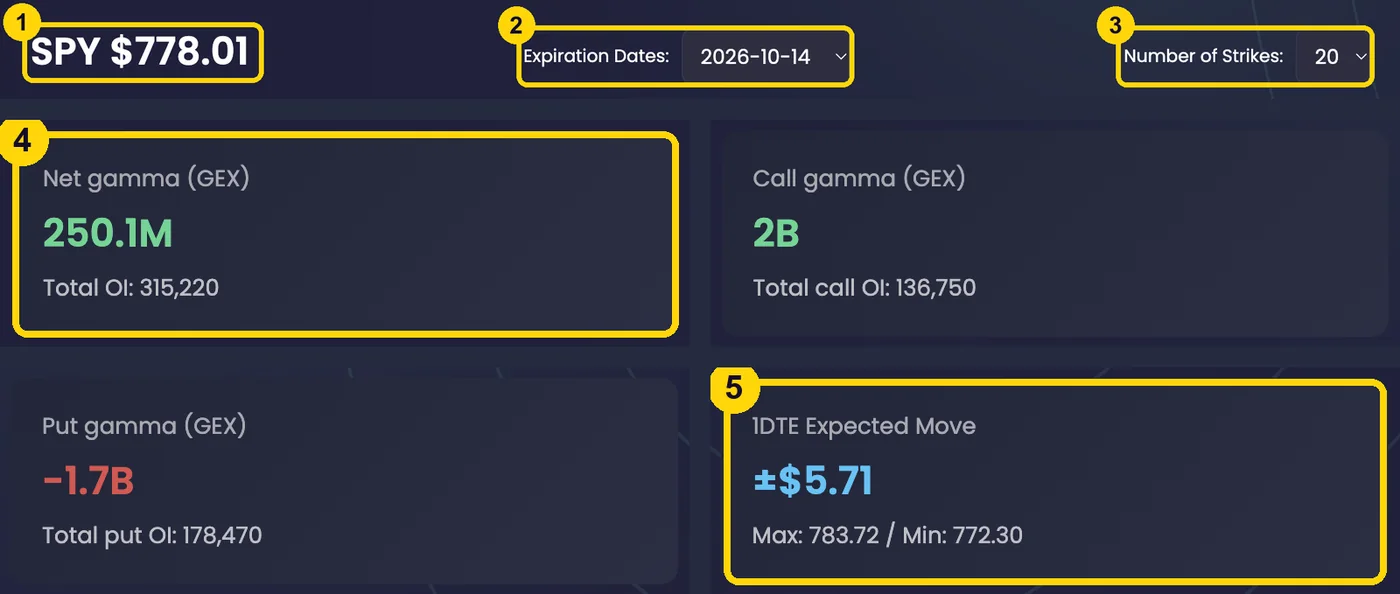
Open Gamma Exposure (GEX), type the ticker in the filter box and hit Go. Check the ticker and price (1), pick the expiry (2) and how many strikes to show (3). We used SPY, the 2026-10-14 expiry and 20 strikes. Then glance at the summary cards: net gamma (4) was an estimated +250.1M, so the overall map leaned positive, and the expected move (5) was ±$5.71, a range of 772.30 to 783.72.
Find the spot price, the call wall and the put wall
Scroll the strike table until you see the colored badges. Call Wall at 781 (1). Spot Price at 778, tagged as the flip (2). Put Wall at 774 (3). Before you trust any of them, read the Net GEX and Total OI on that row. A wall with real open interest behind it means more than a label.
Check where price sits against the flip
Switch to GEX and DEX (Intraday tab). Find the Price line (1), the Magnetic Pole (2) and the Gamma Flip (3). Price above the flip means a positive-gamma read; below it, negative. Use the Call / Put and Net GEX switch (4) to see the call and put sides separately. No account? The free delayed GEX and DEX page works without one.
Zoom in on the strikes near price
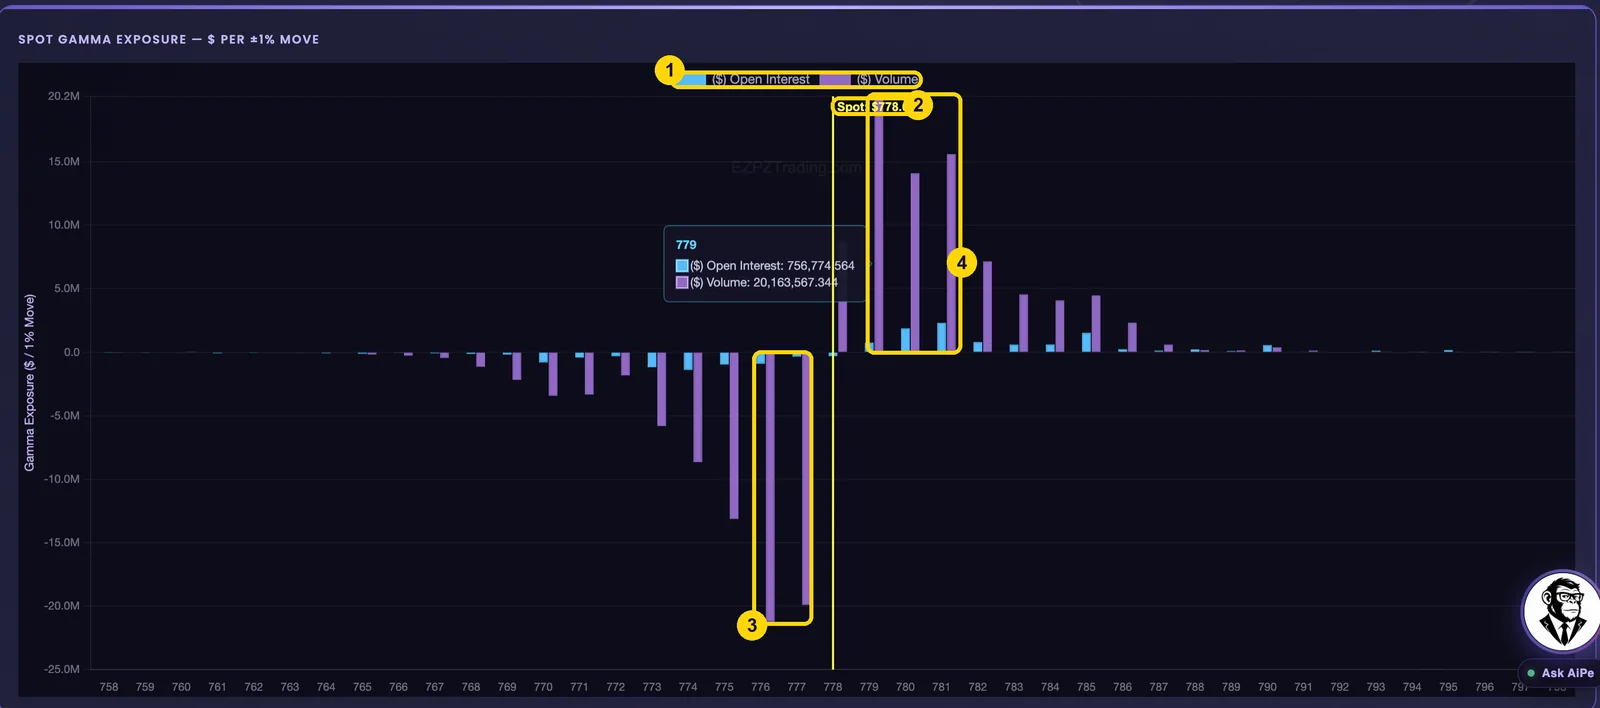
Open Spot Gamma and Delta. Blue bars are the open interest book, purple bars are today's volume (1). On our capture, the purple bars around spot (2) dwarfed the blue ones, on both sides: big negative bars at 776 to 777 (3) and big positive bars at 779 to 781 (4). Translation: today's trading was building new gamma right next to price, which can make the levels near spot matter more than the overnight book suggests. There's a free delayed version too.
Look across expirations
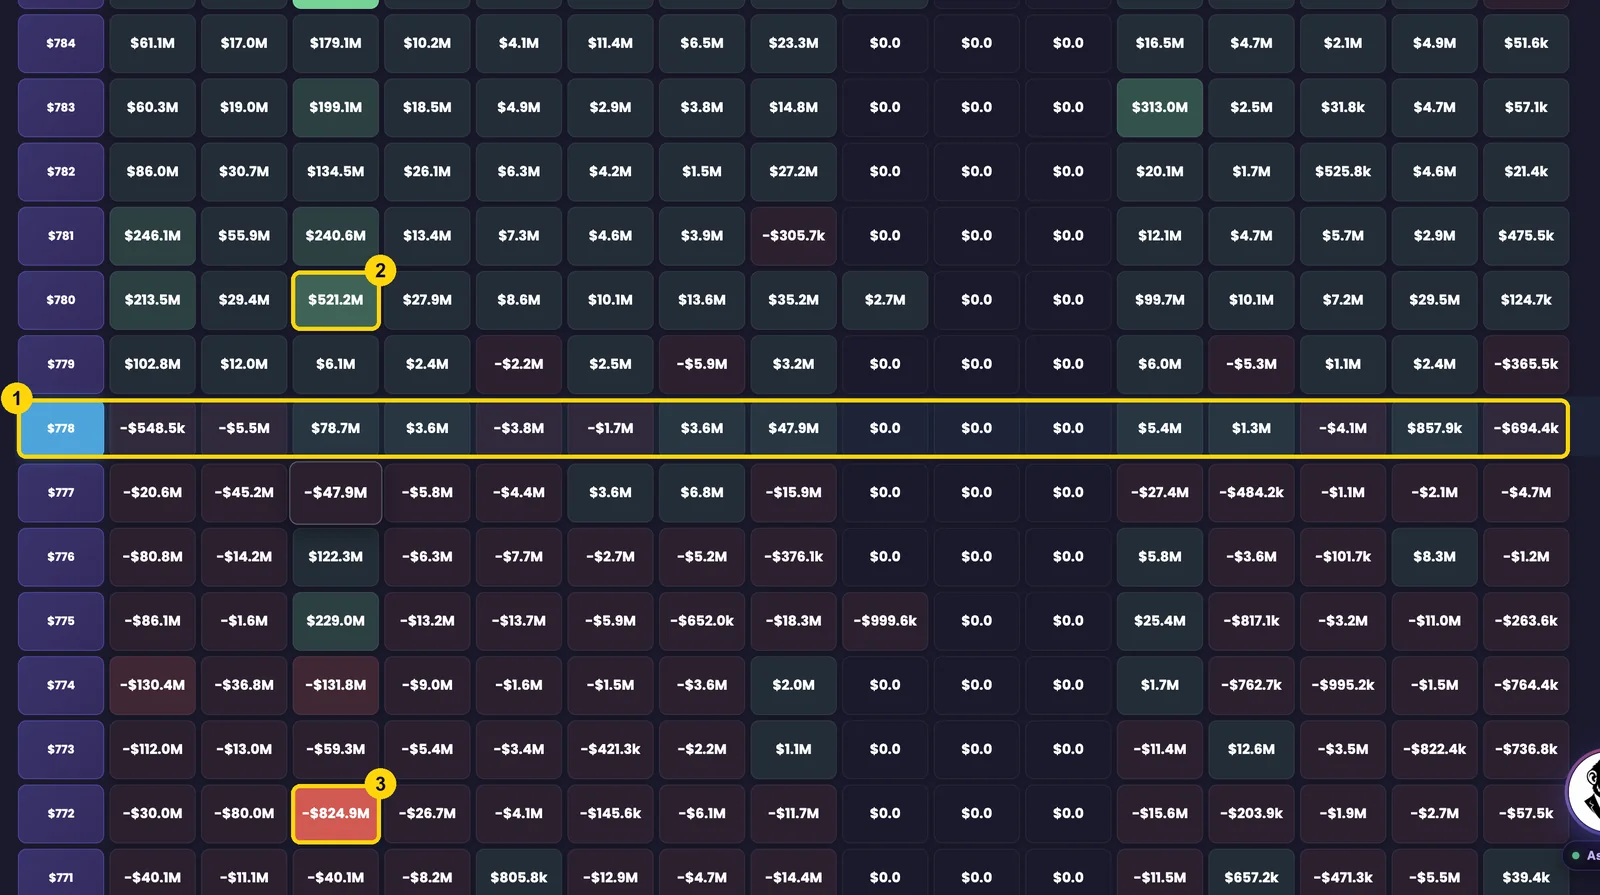
The GEX Heatmap spreads gamma across strikes (rows) and expirations (columns). Start on the spot row (1). Then look for the brightest cells: on Oct 14, one expiry had an estimated +$521.2M at 780 (2) and -$824.9M at 772 (3). A bright cluster in a near-term column can matter more and more as that date gets closer.
Ask AiPe to walk you through it
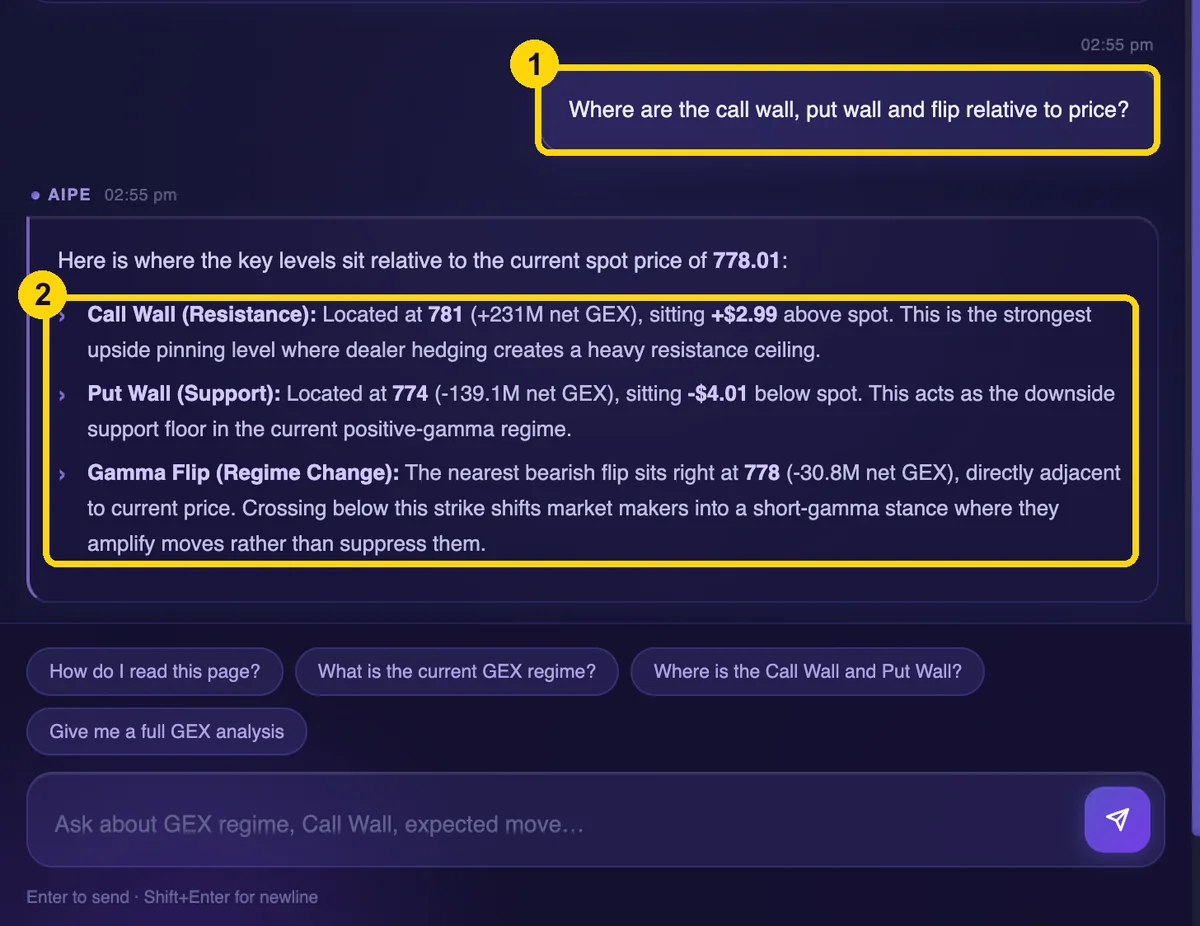
Click Ask AiPe in the bottom right of the page and ask in plain English. We asked "Where are the call wall, put wall and flip relative to price?" (1). AiPe read the strikes on the screen and answered with the same levels, plus the distance to each one: 781 was $2.99 above spot, 774 was $4.01 below (2). Notice it uses support and resistance shorthand. Treat those as levels to watch, not floors and ceilings. AiPe explains the data. It doesn't tell you what to trade, and it can be wrong.
Check again before the close
Gamma moves when price moves, and positions get closed and rolled all day. A map from the morning describes the morning. Re-run steps 1 to 3 in the afternoon, especially on expiration days.
Reading the Oct 14 map in plain English
Put it all together and the picture was simple. Net gamma was positive overall. Price sat right on the flip, between a heavy call wall 3 points above and a put wall 4 points below. The expected move range (772.30 to 783.72) wrapped around both walls.
- If price holds above the flip, the map reads as positive gamma, the kind of tape where hedging tends to lean against moves. A stall near 780 to 781 would fit the map. So would a break, if buyers keep coming.
- If price slips under the flip, the map reads as negative gamma. Hedging may add to the move, which is why many traders stop fading moves below the flip.
- If a headline hits, none of the above holds. The map describes positioning, not what news will do.
Common mistakes
- Treating walls as hard support or resistance. They are where hedging could change. Price can and does go through them.
- Reading an old map. A level from yesterday's open can look very different today.
- Ignoring the expiry. Same-day and next-day gamma can dominate near price, then vanish after the bell.
- Trusting a label without the numbers. Check Net GEX and open interest on the row before you treat a level as important.
Tools used in this post
Every tool above, in one place. Each card links to the live page, the free delayed page when there is one, and the plain-English guide.
Want the whole dealer map for SPX on one screen? Market Maker Exposure (Premium) puts the Flip Level, Call Wall and Put Wall next to SPX candles. Prefer working inside TradingView? Trader's FieldMap (Premium) lets you copy the levels onto your own chart.
Which plan you need
| Tool | Plan | Free delayed page |
|---|---|---|
| Gamma Exposure (GEX) | Pro | None |
| GEX and DEX | Pro | Yes |
| Spot Gamma and Delta | Pro | Yes |
| GEX Heatmap | Premium | None |
| Market Maker Exposure | Premium | None |
| Ask AiPe | Pro and up | None |
FAQ
What is gamma exposure in simple terms?
It estimates how much options dealers may need to buy or sell the underlying as price moves, built from open interest and each contract's gamma.
Are call walls and put walls support and resistance?
Treat them as levels to watch. Strong trends run through walls, and a wall can shrink as contracts expire.
What is the gamma flip?
The price where net gamma changes sign. Above it, hedging tends to dampen moves. Below it, hedging tends to add to them. On EZPZ it shows as the Flip badge on the strike table and the Gamma Flip line on GEX and DEX.
Does positive gamma mean the market will stay calm?
No. It describes a hedging flow that tends to dampen volatility. News, earnings and macro events can overwhelm it.
Can I see GEX on EZPZ for free?
Yes, on delay. GEX and DEX and Spot Gamma and Delta both have free delayed pages. The full Gamma Exposure table needs Pro.