How to read the Movers and Shakers Tide: bull and bear premium, net volume and dark pool flow
In the latest data, the Movers and Shakers Tide reads BEARISH at -$181.90M net premium, but Net Volume reads BULLISH at 143,834,750 contracts. Here is how to read every panel when the two disagree.

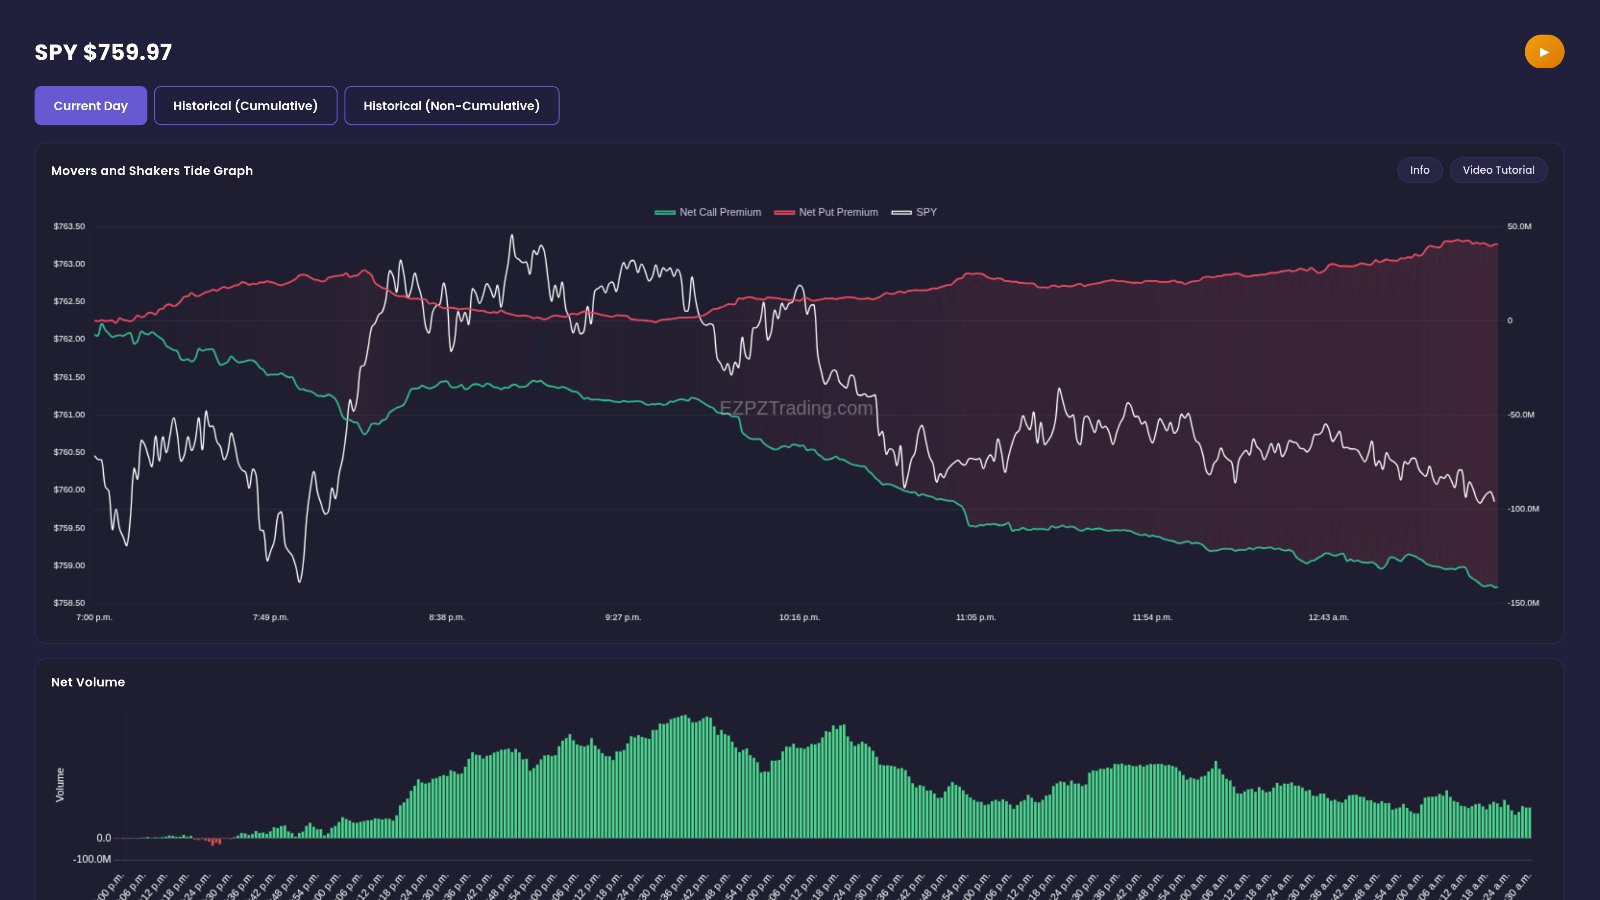
In the latest data, the Movers and Shakers Tide reads BEARISH. Net premium sits at -$181.90M, with the bull line at -$141.33M and the bear line at +$40.57M. But the Net Volume chart reads BULLISH at 143,834,750 contracts. When dollars and contract counts in the biggest option names point opposite ways, you want to know about it.
You can follow along on the live Movers and Shakers Tide page. No account? Open the free delayed Movers and Shakers Tide page instead.
Quick definition first. The Tide follows options flow in a focused group of heavily traded names, the ones that move the index most. Bull flow is the bullish side of the option premium. Bear flow is the bearish side. Net is the gap between them, shown as one line: below zero leans bearish, above zero leans bullish. Premium is the dollars paid for options. Net volume counts contracts, not dollars. An EMA (exponential moving average) is a smoothed trend line that price trades above or below.
-$181.90M
143,834,750
+$40.57M
The idea behind the Movers and Shakers Tide
Most traders watch price. This page shows what option traders in the market's biggest names are doing with their money. It puts that flow in one place, so you do not have to check a dozen charts one by one.
Why a narrow group matters
A small set of names drives a big share of index moves. When options flow in those names leans hard one way, it tells you where the heavy money is positioned. When that lean disagrees with price, it stands out more than a broad market reading would.
Premium versus contracts
Dollars and contracts are not the same thing. A few large, expensive trades can move premium a lot. Many small, cheap contracts can move volume a lot. That is why the page shows both:
- The Tide shows where the dollars lean.
- Net Volume shows where the contract count leans.
- The trend panel shows whether SPY price sits above or below its EMA, alongside Dark Pool Flow.
Agreement versus divergence
When all panels lean the same way, the read is clean. When they split, as in the latest data, the page is telling you the picture is mixed. A split is information, not a mistake.
Walking through the tab, top to bottom
Movers and Shakers Tide Graph
This is the main chart. It plots the bull flow line, the bear flow line and the net line over time. At the top you will find the Movers and Shakers Tide Graph Info Video Tutorial control. Click it for a short guided explainer of the chart.
How to read it:
- Bull flow -- the bullish side of premium. In the latest data it reads -$141.33M. A bull line below zero means the bullish side itself ran negative.
- Bear flow -- the bearish side of premium. It reads +$40.57M.
- Net -- the combined lean. It reads -$181.90M, labeled BEARISH.
- Gap width -- the wider the space between the lines, the stronger the lean. A narrow gap means indecision.
Read the path, not just the end point. Across the sampled points, net started near -$7.59M and slid to -$77.67M. It then eased back to -$35.64M before sliding again. By the later samples it reached -$133.64M, then -$156.87M. That is a bearish lean that built in two waves, with a pause in between.
Net Volume
The second chart shows net options contract volume for the same names, over the same time. It is your check on the Tide. If the Tide leans one way and Net Volume agrees, the read is firmer. If they disagree, treat the Tide with more caution.
In the latest data, Net Volume reads 143,834,750 contracts, labeled BULLISH. The line swung a lot. It started at -858,593, climbed to 577,746,073 at its highest sampled point, then faded back to 149,778,461 at the last sample. So contract volume stayed positive while premium leaned bearish. That is the twist on this page.
Market Price Action Trend EMA Cross Lines
The third panel shows the SPY price action trend against its EMA line, and it carries the Dark Pool Flow view for the same group of names.
- Price vs EMA -- above the EMA reads as bullish structure, below reads as bearish. The latest reading is BELOW_EMA.
- Cross lines -- mark where price crosses the EMA. In the latest data, no significant crossovers were flagged.
- Dark Pool Flow -- shows buy versus sell dollar flow in dark pools for these names. If it leans the same way as the Tide, the read is reinforced. If it leans the other way, the options flow may be hedging.
For a deeper guide to dark pool prints, see Dark pool live flow explained.
How to use the Movers and Shakers Tide on EZPZ: a 5-minute routine
This is the exact routine, with the real screens from the latest data. The yellow numbers show where to look.
Read the Tide gap first
Open the Movers and Shakers Tide. If you are new, click (1), the Movers and Shakers Tide Graph Info Video Tutorial, for a quick tour. Then check the lines: in the latest data, net reads -$181.90M with bear flow at +$40.57M, a clear BEARISH lean.
Check Net Volume for confirmation
Scroll to the Net Volume chart. It reads 143,834,750 contracts, BULLISH. That does not confirm the bearish Tide. Note the split before you lean on either reading.
Frame it with price and dark pool
Move to the Market Price Action Trend EMA Cross Lines panel. The trend reads BELOW_EMA, with no significant crossovers flagged. Then look at (1), Dark Pool Flow, and see whether buy or sell dollars lead. A sell-heavy read would line up with the Tide. A buy-heavy one would deepen the split.
Check again before the close
Come back later and compare the net line with your first look. Ask one question: did the gap widen, narrow or flip? A widening gap shows growing conviction. A narrowing gap shows fading momentum.
Reading the page in plain English
Put the three panels side by side. In the latest data, premium leans bearish, contracts lean bullish and SPY sits below its EMA. Two of three lean bearish, with volume as the outlier. That is a mixed read with a bearish tilt.
- If the net line is below zero and widening, and Net Volume is also negative, the page reads as broad bearish positioning.
- If the net line is below zero but Net Volume is positive, as now, the page reads as a split between dollars and contract count.
- If the Tide leans bullish while SPY sits below its EMA, the page reads as options flow diverging from price.
- If the Tide and Dark Pool Flow lean the same way, the page reads as a reinforced lean.
- If the gap between the bull and bear lines narrows toward zero, the page reads as fading conviction.
What this data cannot tell you
- Direction. A bearish Tide shows how flow leans. It does not tell you where price goes next.
- Timing. The lean can stay in place, fade or flip at any time. The page does not say when.
- Intent. The Tide counts flow across all expirations. A big bearish lean can be long-dated hedging, not a bet on a short-term drop.
Common mistakes
- Reading only the end number. The path matters: the net line paused near -$35.64M before sliding again.
- Ignoring Net Volume. Premium and contract count can disagree, as they do in the latest data.
- Treating a negative bull line as a mistake. A bull line below zero, like -$141.33M, is a real reading of the bullish side.
- Skipping the trend panel. A bearish Tide with SPY BELOW_EMA is a different picture from a bearish Tide with SPY above it.
- Calling a lean a forecast. The page describes positioning. It does not predict price.
Tools used in this post
These pages pair well with the Tide when you want a closer look at expirations, premium by ticker and expected ranges.
Which plan you need
| Tool | Plan | Free delayed page |
|---|---|---|
| Movers and Shakers Tide | Pro | Yes |
| 0DTE Graph | Pro | Yes |
| 7-DTE Graph | Pro | Yes |
| Net Premium Heatmap | Pro | Yes |
| Expected Move | Pro | Yes |
| GEX Heatmap | Premium | None |
FAQ
What does the Movers and Shakers Tide show?
It shows bullish and bearish options premium for a focused group of the most heavily traded names, plus a net line. In the latest data, net reads -$181.90M, BEARISH.
Why can the bull flow line be negative?
The bull line shows the net state of the bullish side, and that can run below zero. In the latest data it reads -$141.33M.
What does it mean when the Tide and Net Volume disagree?
Dollars lean one way and contract count leans the other. Right now the Tide is BEARISH and Net Volume is BULLISH at 143,834,750 contracts. Read it as a mixed picture, not a clear signal.
How do I use the EMA trend panel?
Check whether SPY sits above or below its EMA. The latest reading is BELOW_EMA, with no significant crossovers flagged. Compare that with the Tide to spot agreement or divergence.
How is the flow classified as bullish or bearish?
EZPZ's method is proprietary. Focus on reading the lines, the gap and how they change.
Can I see this page without an account?
Yes. The free delayed Movers and Shakers Tide page shows the same charts on a delay. For flow broken down by ticker, see the Daily Net Premium Heatmap.