Dark pool live flow explained: toolbar, filters and every print (real SOXL and SGOV example)
In the latest session SGOV topped the Dark Pool Live Flow tape at +$402.3K with a 69.8% dark ratio, while SOXL filled several BEARISH rows at 27.5%. Here is how to read every part of the tab.
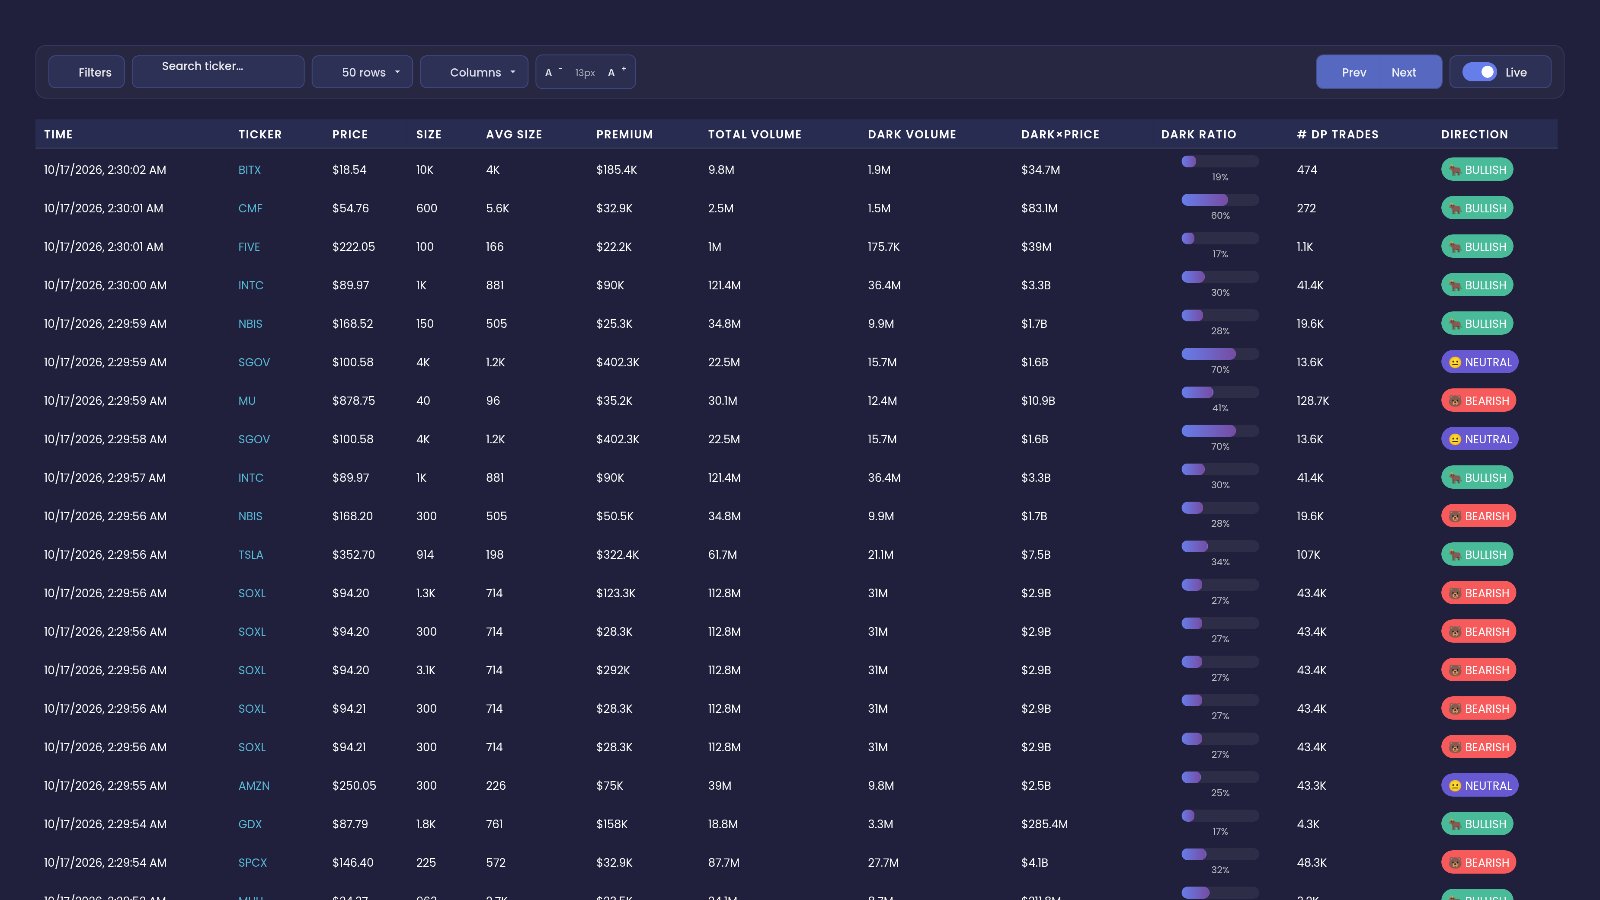
In the latest session, the largest print on the Dark Pool Live Flow tab was SGOV at +$402.3K, with a 69.8% dark ratio and a NEUTRAL direction. Just below it sat TSLA, BULLISH at +$322.4K, and SOXL, BEARISH at +$292.0K, with SOXL showing up in several rows. When you can read that tape in one glance, you can tell where the large money is trading quietly, and whether it leans bullish or bearish.
Quick definition first. A dark pool is an off-exchange venue where large orders get matched without showing up on the public order book. A print is one row on the tape: a ticker, its price and how much traded in the dark. Premium is the dollar value of that dark pool activity. Dark ratio is the share of the stock's total volume for the day that traded in the dark. Direction is EZPZ's label for whether the activity looks like buying (BULLISH), selling (BEARISH) or neither (NEUTRAL).
The idea behind the Dark Pool Live Flow page
Most of the volume you see on a chart trades on lit exchanges. Big players often prefer to trade off-exchange so they do not move the price while they build or unwind a position. The Dark Pool Live Flow page puts that quiet activity on one live tape, one row per print, so you can see which tickers are busy in the dark right now.
What it helps you see
- Where the money is. Premium shows how many dollars changed hands in the dark for a ticker.
- How hidden the flow is. Dark ratio shows how much of the day's volume went through dark pools instead of the lit market.
- Which way it leans. Direction tags each print BULLISH, BEARISH or NEUTRAL.
- Who might be behind it. The number of dark pool trades, and the Size filter, help you tell a few big trades apart from many small ones.
Why the dark ratio matters
A high dark ratio means a big slice of the stock's trading is happening away from the public tape. In the latest session SGOV stood out at 69.8% and CMF at 59.9%. Most names sat much lower, such as NVTS at 14.9%. When a ticker trades unusually heavily in the dark, it is worth checking. It does not tell you the outcome. It tells you where to look.
Why direction needs context
Direction on its own is a label. Read it next to premium and dark ratio. A BULLISH print with a large premium and a high dark ratio reads very differently from a small BULLISH print in a name that trades mostly on the lit market. EZPZ's method is proprietary, so treat Direction as a reading to combine with the other columns, not a verdict.
The Dark Pool Live Flow tab, top to bottom
Here is the tab exactly as you see it when you open it.
Toolbar
The toolbar runs across the top of the table. From left to right:
- Filters -- opens the filter panel, described in the next section.
- Search box "Search ticker…" -- type a symbol to see only that ticker's prints. Type SOXL and the tape shrinks to SOXL rows only, which makes it easy to see how often it shows up.
- 50 rows -- sets how many rows appear on one page of the table. The latest session's example uses 50 rows.
- Columns -- lets you show or hide columns, so you can keep only the readings you use.
- A - and A + -- shrink or enlarge the text in the table. Handy on a small laptop screen or a big monitor.
- Prev and Next -- move back and forward through pages of prints.
Filters
Click the Filters button and a panel opens with seven controls. Each one narrows the tape:
- Direction -- show only BULLISH, only BEARISH, or all prints. Choosing BEARISH in the latest session would leave rows like SOXL, MU and NBIS.
- Price -- set a minimum and/or maximum share price. Useful to skip very low-priced names or focus on higher-priced stocks like MU at $878.75.
- Premium -- set a dollar range for the print's premium. Raise the minimum to keep only the biggest prints, such as SGOV, TSLA and SOXL.
- Total Volume -- filter by the stock's total shares traded for the day, dark and lit together. This helps you skip thinly traded names.
- Dark Pool Volume -- filter by how many shares traded in the dark for that ticker.
- Size -- filter by trade size, so you can lean toward larger individual dark pool trades.
- # of DP Trades -- filter by how many dark pool trades make up the row.
In the latest session no filters were active, so the tape showed all dark pool prints.
The rows on the tape
Below the toolbar, the table lists prints newest first. Each row carries these readings:
- Time -- when the print appeared. Newest rows sit at the top.
- Ticker -- the symbol. The same ticker can appear in several rows.
- Price -- the share price on that print.
- Premium -- the dollar value of the dark pool activity. Bigger premium means more money behind the print.
- Dark Pool Volume -- shares traded in the dark for that ticker.
- Dark Ratio -- the share of the day's total volume that traded in the dark. Higher means more of the trading is happening off the public tape.
- # of DP Trades -- how many dark pool trades sit in the row. Many trades suggests broad activity; few trades with large volume suggests bigger individual orders.
- Direction -- BULLISH, BEARISH or NEUTRAL.
Read one row across. SGOV: premium +$402.3K, dark ratio 69.8%, 13600 trades, NEUTRAL. That is the largest premium and the highest dark ratio on the tape, yet with no bullish or bearish lean. Now TSLA: premium +$322.4K, dark ratio 34.2%, 106961 trades, BULLISH. Lots of trades, a solid premium, and a lean to the buy side. Then BITX at the top of the tape: +$185.4K, 19.1%, only 474 trades, BULLISH. A decent premium spread over far fewer trades than TSLA.
How to use the Dark Pool Live Flow on EZPZ: a 5-minute routine
This is the exact routine, with the real screens from the latest session. The yellow numbers show where to look.
Scan the top of the tape
Open Dark Pool Live Flow with no filters on. The newest prints sit at the top. In the latest session the top row was BITX, BULLISH at +$185.4K with a 19.1% dark ratio. This gives you a feel for what is printing right now.
Find the biggest premiums
Open Filters and raise the Premium minimum. The big names stand out fast: SGOV at +$402.3K, TSLA at +$322.4K and SOXL at +$292.0K. These are the largest dollar commitments on the tape.
Check the dark ratio next to each
For each big print, look at the dark ratio. SGOV read 69.8%, far above TSLA at 34.2% and SOXL at 27.5%. A high ratio means more of that ticker's trading is happening in the dark.
Split the tape by Direction
Set Direction to BULLISH, then BEARISH. Across the visible rows, the latest session showed 21 BULLISH and 24 BEARISH prints, with 5 NEUTRAL. On the bearish side, SOXL repeats again and again; on the bullish side, TSLA, INTC and SMH carry the bigger premiums.
Search the names that repeat
Type a repeating ticker into "Search ticker…". SOXL shows several BEARISH rows, from +$28.3K up to +$292.0K. CIFR shows three rows with mixed NEUTRAL and BULLISH tags. A name that keeps printing tells you where the activity is concentrated.
Compare with the wider dark pool view
Cross-check the busiest names on $1M+ Premium Dark Pool Flow for the largest prints, and on Dark Pool Net Flow for a single ticker's picture.
Reading this session in plain English
Put it together. The tape was busy and mixed. Bearish prints slightly outnumbered bullish ones across the visible rows, yet the bullish rows carried a bit more premium: +$1.48M against +$1.32M, with +$1.01M in neutral rows. The single largest premium, SGOV, carried no lean at all. SOXL stood out for how often it printed, every time BEARISH. TSLA had a big BULLISH print at +$322.4K and a separate BEARISH row at +$138.6K.
- If a ticker shows a large premium and a high dark ratio, like SGOV at +$402.3K and 69.8%, the page reads as heavy, quiet activity in that name. NEUTRAL means no lean either way.
- If one ticker fills many rows with the same direction, like SOXL's BEARISH rows at 27.5%, the page reads as steady one-sided dark activity in that name.
- If a ticker shows both BULLISH and BEARISH rows, like TSLA or NBIS, the page reads as two-way activity. Weigh the larger premium, not the row count.
- If the premium is solid but spread over few trades, like BITX with 474 trades, the page reads as fewer, larger orders.
- If the premium is small and the dark ratio low, like NVTS at +$51.2K and 14.9%, the page reads as routine dark activity rather than a standout.
Common mistakes
- Counting rows as tickers. 50 rows covered 32 tickers in the latest session, because names like SOXL repeat.
- Reading Direction alone. A BULLISH tag on a small, low-ratio print says much less than one on a large, high-ratio print.
- Ignoring NEUTRAL. The biggest premium on the tape, SGOV, was NEUTRAL. Big money does not always mean a lean.
- Forgetting active filters. If the tape looks thin, check the Filters panel before drawing conclusions.
- Treating a print as a forecast. The tape shows what traded, not what price will do next.
Tools used in this post
These EZPZ dark pool tools cover the live tape and the views that pair best with it.
Which plan you need
| Tool | Plan | Free delayed page |
|---|---|---|
| Dark Pool Flow | Pro | None |
| $1M+ Premium Dark Pool Flow | Pro | None |
| $1M+ DP Volume Flow | Pro | None |
| Bearish Dark Pool Net Premium | Pro | Yes |
| Block Trades Sentiment | Pro | Yes |
| Bullish Dark Pool Net Premium | Pro | Yes |
FAQ
What does the dark ratio tell me?
It shows what share of a ticker's total volume for the day traded in the dark. SGOV at 69.8% means most of its trading happened off the public tape; NVTS at 14.9% means most did not.
How is Direction decided?
EZPZ's method is proprietary. Read Direction together with premium and dark ratio rather than on its own.
Why does the same ticker appear in several rows?
The tape lists prints, and a busy ticker can print many times. In the latest session SOXL, NBIS and CIFR all appeared in several rows. Use the search box to see them together.
How do I see only the largest prints?
Open Filters and raise the Premium minimum. For a dedicated view of the biggest prints, use $1M+ DP Volume Flow and $1M+ Premium Dark Pool Flow.
What do # of DP Trades and Size add?
# of DP Trades shows how many dark pool trades make up a row. TSLA's 106961 trades and BITX's 474 trades tell very different stories about how the activity was spread out. The Size filter lets you lean toward larger individual trades.
Is a BULLISH print a signal to buy?
No. It is a reading of what traded. Use it with the other columns and your own plan, and compare it with views like Block Trades Sentiment.