IV rank and IV percentile: when SPY options sit above their 1-year range
In the latest data, SPY's Current IV (30D) reads 30.53%, above its 1-year high of 26.82%. IV Rank (1Y) shows 115.81% and IV Percentile (1Y) shows 100.00%. Here is how to read every part of the IV Rank Explorer.
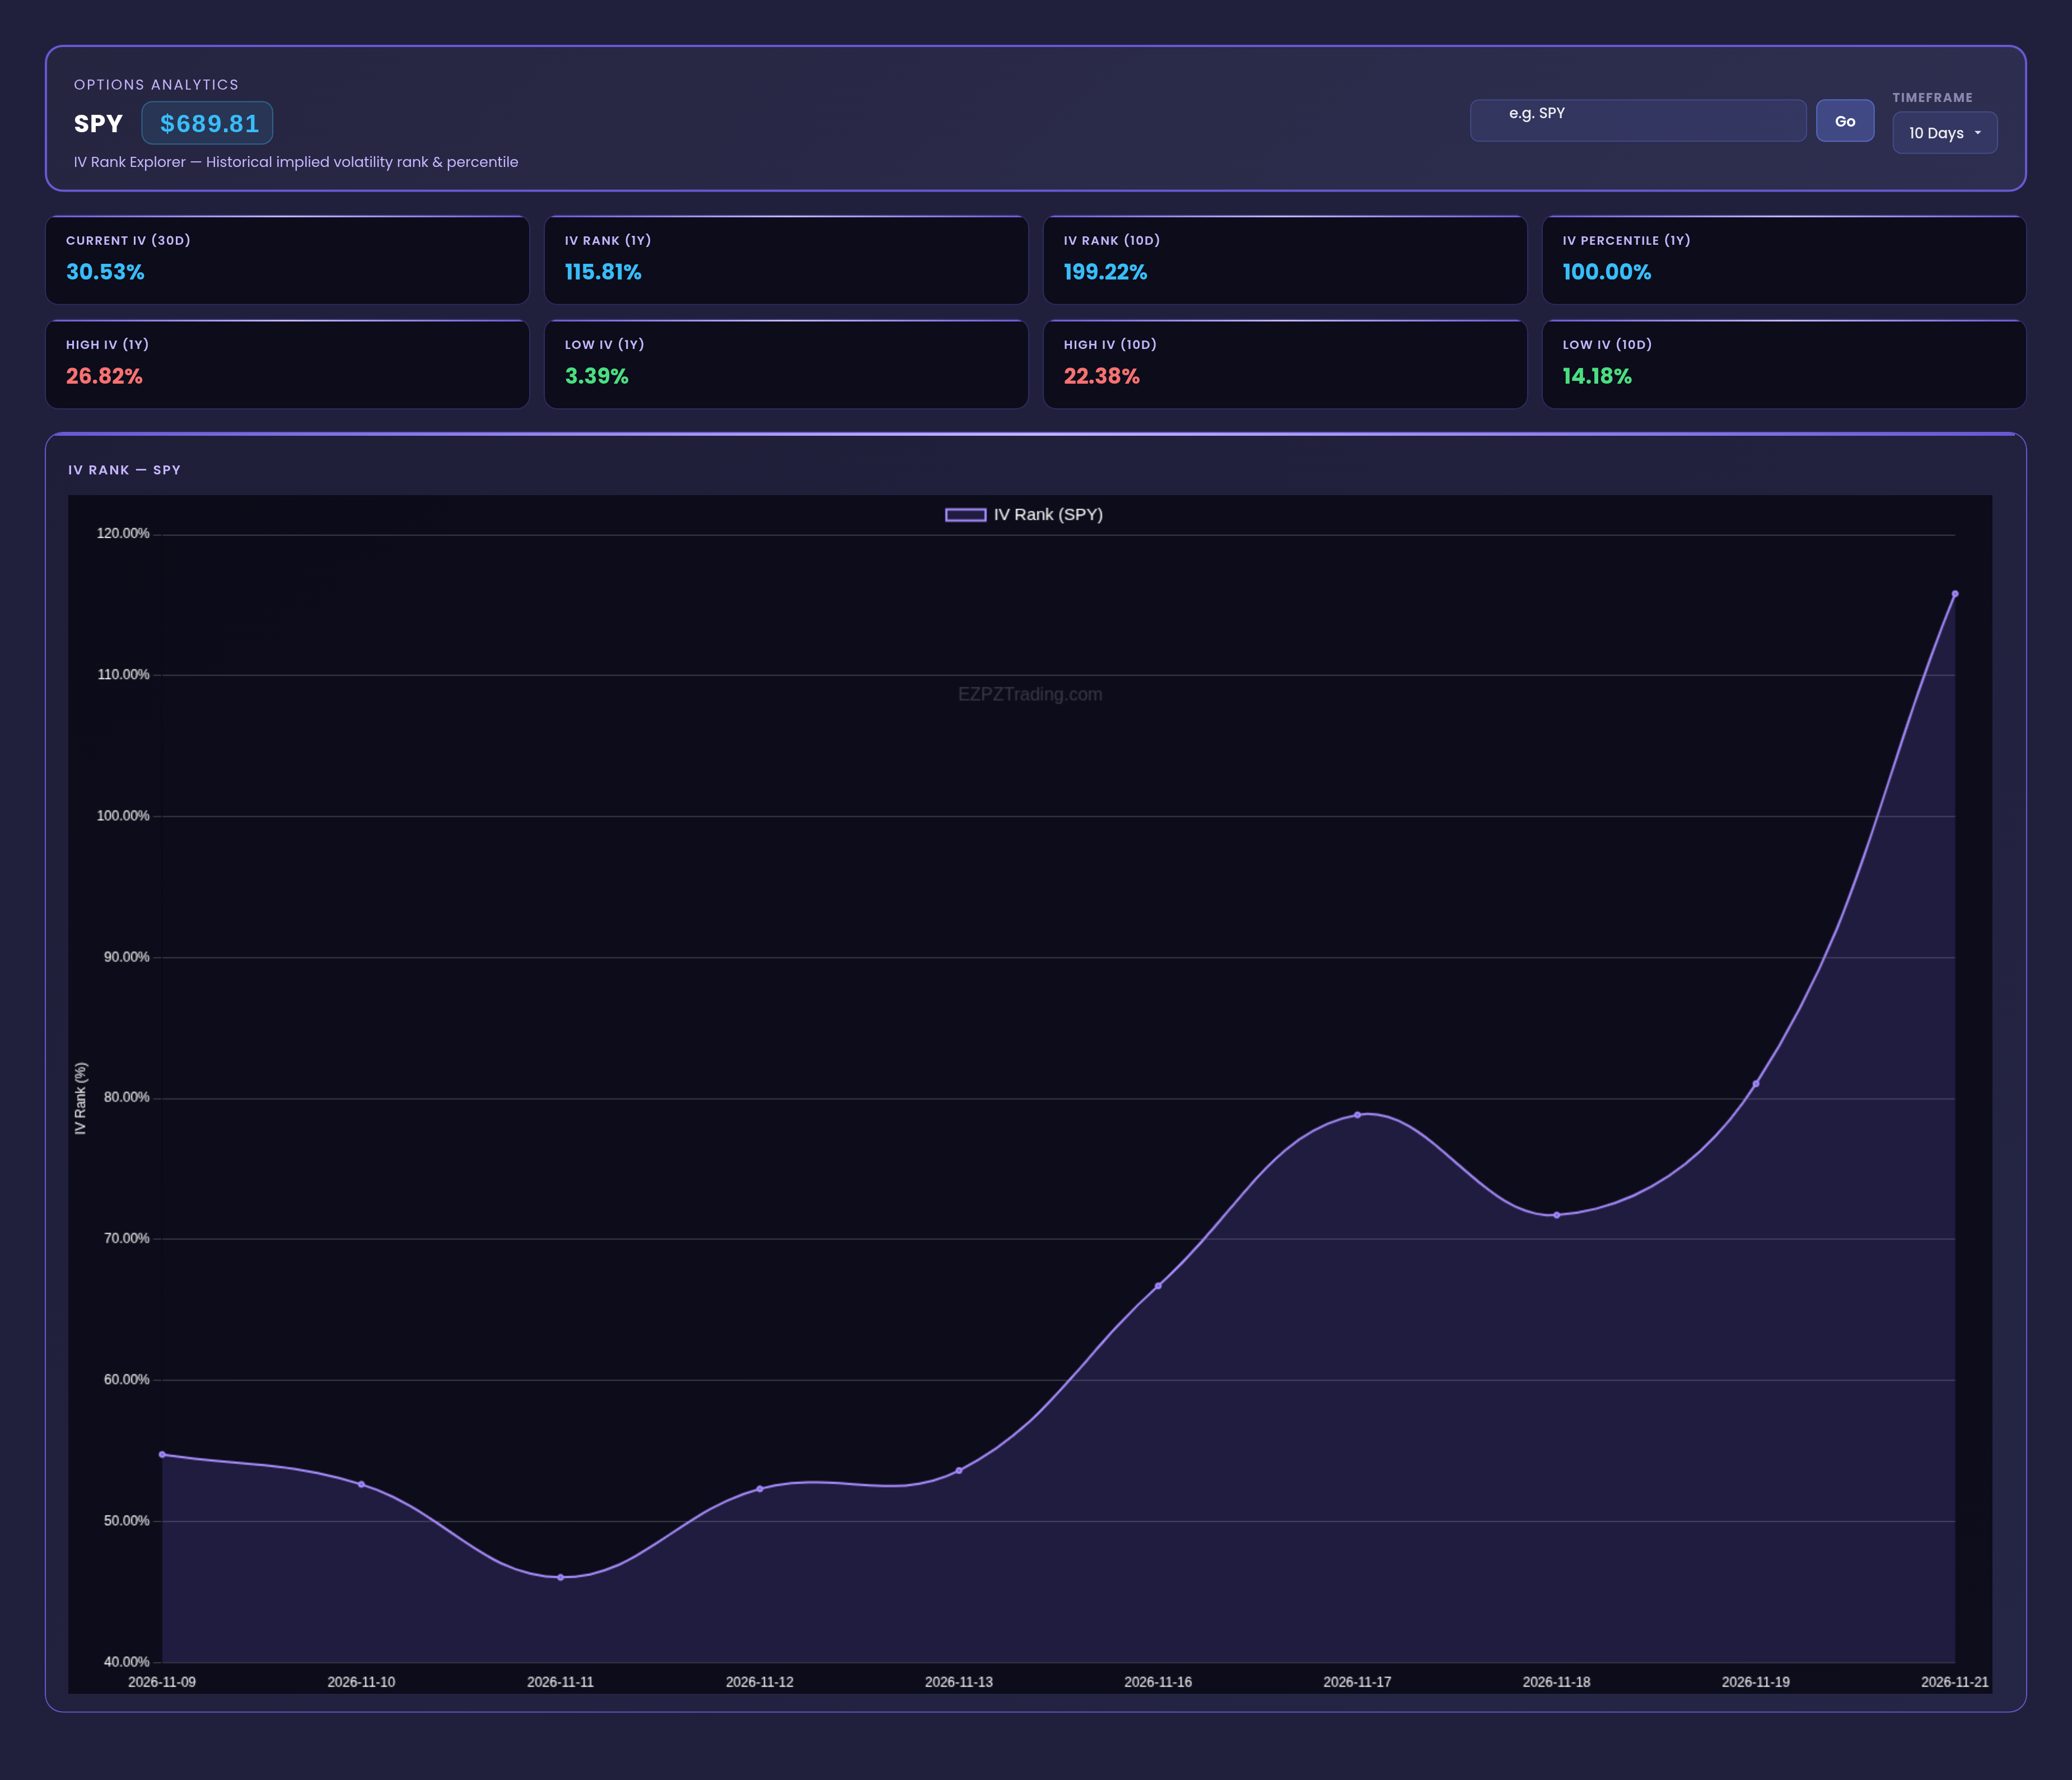
In the latest data, SPY trades at $689.81 and its Current IV (30D) reads 30.53%. That is above the High IV (1Y) of 26.82%, so IV Rank (1Y) prints 115.81% and IV Percentile (1Y) prints 100.00%. In plain terms, SPY options are priced richer than at any point in their own past year, and that changes how you think about buying or selling them.
Quick definition first. Implied volatility (IV) is the size of move the options market is pricing in, shown as a yearly percentage. A higher IV means more expensive options. IV Rank shows where the latest IV sits between its own low and high, on a 0 to 100% scale. 0% means IV is at its low and 100% means it is at its high. IV Percentile is the share of past trading days when IV was lower than in the latest data. Both compare a ticker only with its own history, never with other tickers. You can open the IV Rank Explorer live, or try the free delayed IV Rank Explorer with no account.
115.81%
30.53%
100.00%
Why IV rank matters: cheap or expensive, by the ticker's own history
A raw IV number on its own tells you little. 30.53% may be calm for one stock and wild for another. The IV Rank Explorer puts that number in context. It shows where the latest pricing sits in the ticker's own range.
Rank shows position, percentile shows frequency
The two readings answer different questions:
- IV Rank asks: how close is the latest IV to the high or the low of the range?
- IV Percentile asks: on how many past days was IV lower than it is now?
Most of the time they agree. They can split apart when the range high or low was a one-off spike. A single extreme day can stretch the range while barely moving the percentile. In the latest SPY data they agree: both sit at or above the top of the scale.
Why a reading can go above 100%
The scale tops out at 100% when IV equals the range high. If the latest IV climbs above the listed high, the rank runs past 100%. That is exactly what SPY shows now. Current IV (30D) is 30.53%, and the High IV (1Y) is 26.82%. So IV Rank (1Y) prints 115.81%. Treat a reading above 100% as "beyond the top of the past range", not as an error.
Short window vs full year
The page gives two views of the same idea. The 1-year view is your baseline. The shorter window, set by the Timeframe dropdown, reacts faster to recent change. When the short read is far from the 1-year read, pricing has shifted recently. For SPY, IV Rank (10D) at 199.22% is well above IV Rank (1Y) at 115.81%. That points to a sharp jump in the last couple of weeks, not a slow drift.
Walking through the IV Rank Explorer tab
The tab is compact. A header panel holds the controls, and the readings for the loaded ticker appear with it. Here is what you see, top to bottom.
OPTIONS ANALYTICS
This is the header panel at the top of the tab. It has four parts:
- Ticker and price: the loaded symbol and its last price. In the latest data it reads SPY $689.81. Use the price to confirm you loaded the right ticker.
- Title line: "IV Rank Explorer — Historical implied volatility rank & percentile". It reminds you that every reading compares the ticker with its own past.
- Symbol search and Go: type a ticker and press Go. All the readings and the history then load for that symbol.
- TIMEFRAME: a dropdown, set to 10 Days in the latest data. It changes only the short-window readings: IV Rank, High IV and Low IV for that window. The 1-year readings and the IV Rank history stay the same whatever you pick.
Once SPY is loaded, the latest readings are:
| Reading | What it shows | SPY latest |
|---|---|---|
| Current IV (30D) | The current 30-day implied volatility | 30.53% |
| IV Rank (1Y) | Where current IV sits in its 1-year range | 115.81% |
| IV Rank (10D) | The same position, inside the 10-day window | 199.22% |
| IV Percentile (1Y) | Share of past-year days with lower IV | 100.00% |
| High IV / Low IV (1Y) | The 1-year top and bottom of IV | 26.82% / 3.39% |
| High IV / Low IV (10D) | The top and bottom inside the window | 22.38% / 14.18% |
Read it across. Current IV at 30.53% sits above both the 1-year high of 26.82% and the 10-day high of 22.38%. That is why both rank readings are above 100%, and the 10-day one is the higher of the two. The 10-day range is narrow, so a jump beyond it stretches that rank further.
The IV Rank history shows how the 1-year rank got there.
SPY IV Rank (1Y) history
Read the shape, not just the last bar. The rank hovered near the middle of its range through 2026-11-13, with a dip to 46.03% on 2026-11-11. From 2026-11-16 it stepped higher: 66.71%, then 78.84%. It eased to 71.73%, rose to 81.05%, then broke above the scale at 115.81%. That is a steady climb, not a single overnight spike.
How to use the IV Rank Explorer on EZPZ: a 3-minute routine
This is the exact routine, with the real screens from the latest data. The yellow numbers show where to look.
Load the ticker and set the window
Open the IV Rank Explorer, type a symbol and press Go. Check the price at (1), $689.81 for SPY, to confirm the right ticker loaded. Then check TIMEFRAME at (2), set to 10 Days. That setting decides which window the short-term readings use.

Read the 1-year rank and percentile together
Start with IV Rank (1Y) and IV Percentile (1Y). For SPY they read 115.81% and 100.00%. Both say the same thing: options are priced above anything in the past year. If they disagreed, you would check whether the 1-year high or low was a one-off extreme.
Compare the short window with the year
Put IV Rank (10D) next to IV Rank (1Y). For SPY it is 199.22% against 115.81%, so the jump is recent. Then scan the IV Rank history to see whether the rise built over days or came all at once. For SPY it built over several sampled dates.
Check again before the close
IV can move fast after a jump like this. Reload the ticker later and see whether Current IV is still above the High IV (1Y), or has slipped back inside the range.
Reading the page in plain English
Put together, the latest SPY data reads as options priced above their 1-year range, after a climb that sped up over the sampled dates. Here is how to read common setups:
- If IV Rank (1Y) is above 100% and IV Percentile (1Y) is 100.00%, the page reads as options more expensive than at any point in the past year. That is SPY now.
- If IV Rank (1Y) is low and IV Percentile (1Y) is low, the page reads as options cheap by the ticker's own history.
- If IV Rank is low but IV Percentile is much higher, the page reads as a range stretched by one extreme day. Most days were still below the latest IV.
- If the short-window rank is far above the 1-year rank, the page reads as a recent jump in pricing, not a long-running regime.
- If the short-window rank is far below the 1-year rank, the page reads as IV cooling off lately, while still high for the year.
- If the IV Rank history climbs over several dates, the page reads as a steady build. A single tall bar reads as a sudden spike.
What this data cannot tell you
- Direction. A high IV rank shows options are expensive, not whether the stock goes up or down.
- Timing. High IV can stay high, or rise further, for a while. The page shows where pricing sits, not when it turns.
- Comparison across tickers. Every reading compares a ticker with its own past. A 115.81% rank on SPY says nothing about whether SPY options are cheaper or dearer than another ticker's.
Common mistakes
- Treating above 100% as a glitch. It means current IV is above the past range high, as with SPY's 30.53% against 26.82%.
- Reading only IV Rank. IV Percentile can tell a different story when one extreme day stretched the range.
- Forgetting what TIMEFRAME changes. It moves only the short-window readings, never the 1-year ones or the history.
- Reading high IV as a direction call. Expensive options are not a bullish or bearish signal on their own.
- Ignoring the history. The same rank means something different after a steady climb than after a one-day spike.
Tools used in this post
These are the EZPZ tools that fit with an IV rank check, starting with the topic page.
Which plan you need
| Tool | Plan | Free delayed page |
|---|---|---|
| IV Rank Explorer | Pro | Yes |
| 0DTE Graph | Pro | Yes |
| 0DTE Speculation Map | Premium | Yes |
| 7-DTE Graph | Pro | Yes |
| Net Premium Heatmap | Pro | Yes |
| EZPZ Trifecta | Premium | None |
FAQ
What is IV rank in simple terms?
It shows where a ticker's current implied volatility sits between its own low and high, on a 0 to 100% scale. Higher means options are more expensive by that ticker's own history.
How is IV percentile different from IV rank?
IV Rank looks at position inside the high-low range. IV Percentile shows the share of past days when IV was lower than in the latest data. They split apart when the range was stretched by an unusual day.
Why does SPY show an IV rank of 115.81%?
Because its Current IV (30D) of 30.53% sits above the High IV (1Y) of 26.82%. When the latest IV is beyond the past high, the rank goes past 100%.
What does the TIMEFRAME dropdown change?
Only the short-window readings: IV Rank, High IV and Low IV for the chosen window. With 10 Days selected, SPY shows IV Rank (10D) of 199.22%. The 1-year readings and the history do not change.
How does EZPZ calculate these readings?
The general ideas of IV rank and IV percentile are standard and explained above. EZPZ's method is proprietary.
Can I try the page without an account?
Yes. The free delayed IV Rank Explorer shows the same layout with delayed data.