How to read Money Sentiment: bought ratio, net call and put sentiment and the 30-day average
On November 16, 2026, SPY buyers put $816.9M into puts and only $577.4M into calls. Yet Net Sentiment still read 51.41% bullish, close to the 51.00% 30-day average. Here is how to read every card on Money Sentiment.

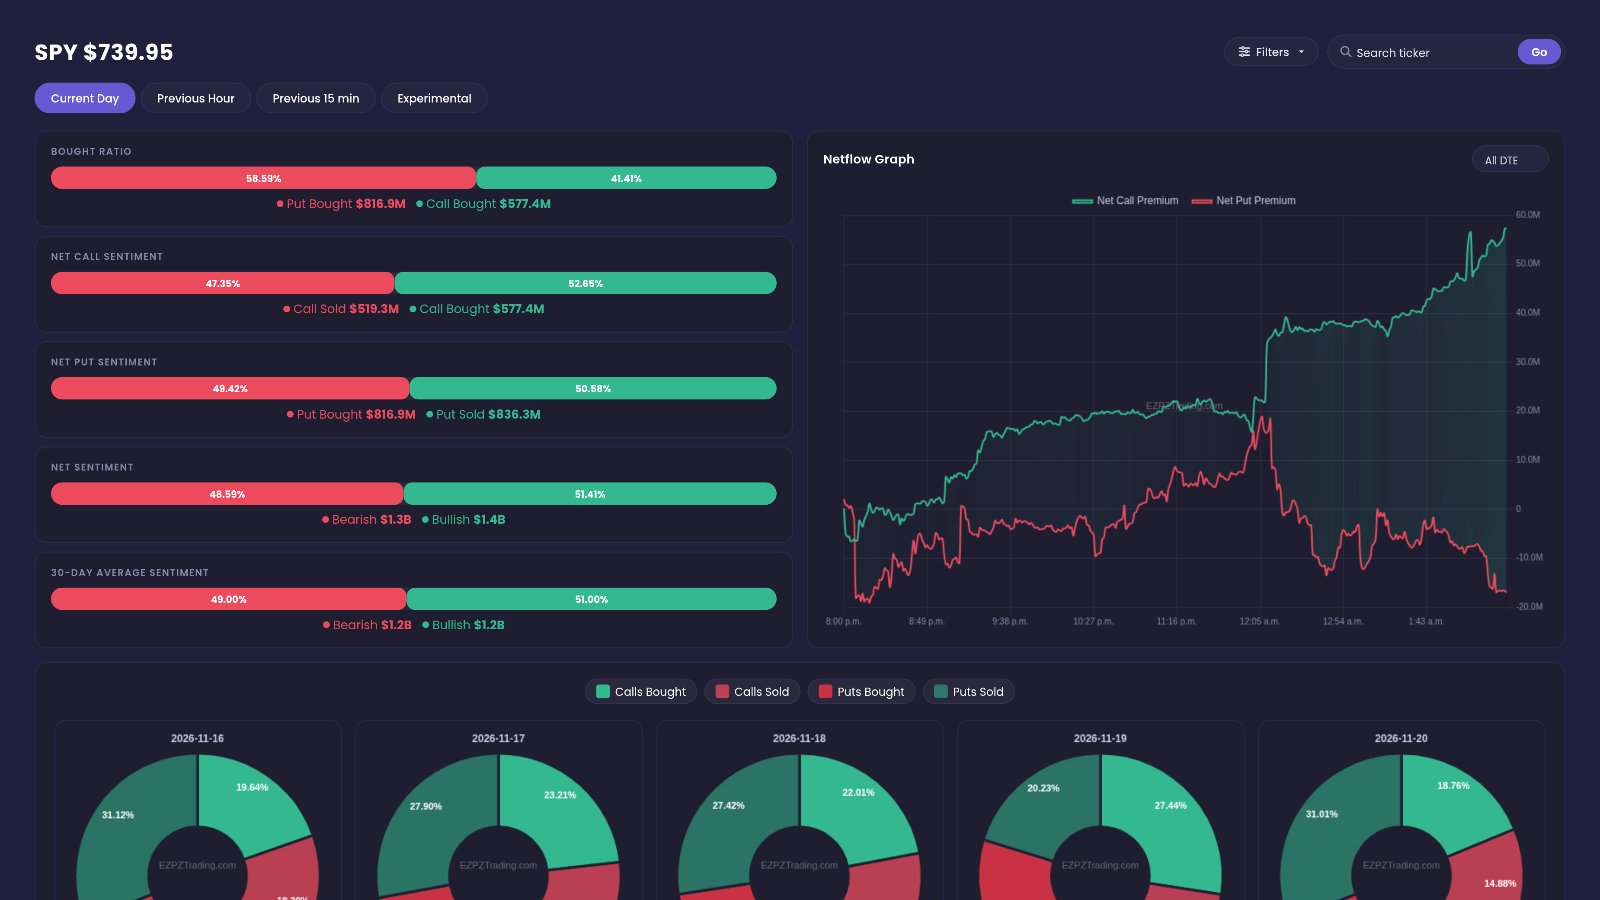
On Monday, November 16, 2026, SPY sat at $739.95. Options buyers put $816.9M into puts and only $577.4M into calls, which looks bearish at first glance. But the Net Sentiment card still read 51.41% bullish against 48.59% bearish, almost the same as the 30-day average of 51.00% bullish. If you only count calls against puts, you can get the day's mood wrong. Money Sentiment shows you the whole picture.
Quick definition first. Money Sentiment splits one ticker's options premium (the dollars paid for contracts) into four buckets. Call Bought means a buyer paid up for calls. Call Sold means a seller pushed calls out. Put Bought means a buyer paid up for puts. Put Sold means a seller pushed puts out. Call Bought and Put Sold lean bullish. Call Sold and Put Bought lean bearish. Each card on the tab shows two of these buckets side by side, as dollars and as a percentage split. No account? You can open the free delayed Money Sentiment page and follow along.
51.41%
58.59%
51.00%
The idea behind Money Sentiment: who is paying, and who is selling
Most traders look at calls vs puts and stop there. More put dollars? Bearish. More call dollars? Bullish. That misses half the story. Every option trade has a buyer and a seller. What matters is which side was eager.
Buying and selling tell different stories
A trader who buys a put is betting on, or protecting against, a drop. A trader who sells a put is happy to take the other side. They lean bullish, or at least not bearish. So two put trades of the same size can point in opposite directions. Money Sentiment keeps them apart.
- Bullish premium: Call Bought plus Put Sold.
- Bearish premium: Call Sold plus Put Bought.
Why the dollar view helps
Counting contracts treats a cheap lottery ticket the same as a big, deep position. Dollars do not. On SPY on November 16, 2026, the bullish side shows $1.4B and the bearish side $1.3B on the Net Sentiment card. That tells you where the real money leaned, not just how many trades printed.
Why the 30-day average matters
One day's split is noisy. SPY flow often sits near a 50/50 split. The 30-Day Average Sentiment card gives you the normal baseline for this ticker. A reading far from that baseline is worth more attention than a reading near it.
Walking through the Money Sentiment tab, top to bottom
Here is the tab exactly as you see it, using the SPY data from November 16, 2026.
SPY $739.95
The top of the tab shows the ticker and its price: SPY $739.95. Every card below belongs to this ticker. Type a different symbol and press Go to load that ticker's sentiment instead.
Filters, Go, time window and Experimental
The toolbar holds a few small controls:
- Filters – a dropdown that narrows which options are counted, for example by moneyness (in the money or out of the money) and by expiration type. On this example no moneyness filter was ticked and all expirations were included.
- Go – applies the ticker and filters you chose and reloads the cards.
- Current Day – shows sentiment for the whole session so far. This is the view used in this article.
- Previous Hour – narrows the cards to the last hour of flow. Use it to see whether the latest money agrees with the full-day read.
- Previous 15 min – narrows the cards to the last 15 minutes. It is the fastest way to spot a fresh change of direction.
- Experimental – a label on the toolbar that marks that part of the page as an experimental feature.
BOUGHT RATIO
This card compares only the buyers. It shows Put Bought dollars against Call Bought dollars. Think of it as: when traders paid up, where did their money go?
- 58.59% – Put Bought share, $816.9M.
- 41.41% – Call Bought share, $577.4M.
Read it like this: SPY buyers put more money into puts than calls. On its own, that leans bearish or defensive. But this card ignores the sellers, so never stop here.
NET CALL SENTIMENT
This card looks only at calls. It sets Call Sold (bearish) against Call Bought (bullish).
- 47.35% – Call Sold, $519.3M.
- 52.65% – Call Bought, $577.4M.
Read it like this: on the call side, buyers beat sellers. Call flow tipped bullish, but only by a small margin.
NET PUT SENTIMENT
This card looks only at puts. It sets Put Bought (bearish) against Put Sold (bullish).
- 49.42% – Put Bought, $816.9M.
- 50.58% – Put Sold, $836.3M.
Read it like this: this is the twist of the day. Put buyers were big, but put sellers were slightly bigger. So the put side, which looked bearish on the Bought Ratio, actually tipped bullish.
The chart makes the point clear. Put money dwarfed call money on both sides. The puts were close to a tie between buyers and sellers. The bullish edge came from both sides of the book together.
NET SENTIMENT
This is the headline card. It adds up all the bearish premium (Call Sold plus Put Bought) and all the bullish premium (Call Bought plus Put Sold).
- 48.59% – Bearish, $1.3B.
- 51.41% – Bullish, $1.4B.
Read it like this: across calls and puts, SPY money leaned slightly bullish. It is a mild tilt, not a one-sided day.
30-DAY AVERAGE SENTIMENT
This card shows the same bearish vs bullish split, averaged over the last 30 days.
- 49.00% – Bearish, $1.2B.
- 51.00% – Bullish, with its dollar total shown beside it.
Read it like this: SPY's usual split is already a little bullish. Today's 51.41% bullish sits just above that baseline. So the day was close to normal, not unusual.
A quick tip on layout: on every card, the bearish side sits on the left and the bullish side on the right. Once you know that, you can scan all five cards in seconds.
How to use the Money Sentiment on EZPZ: a 5-minute routine
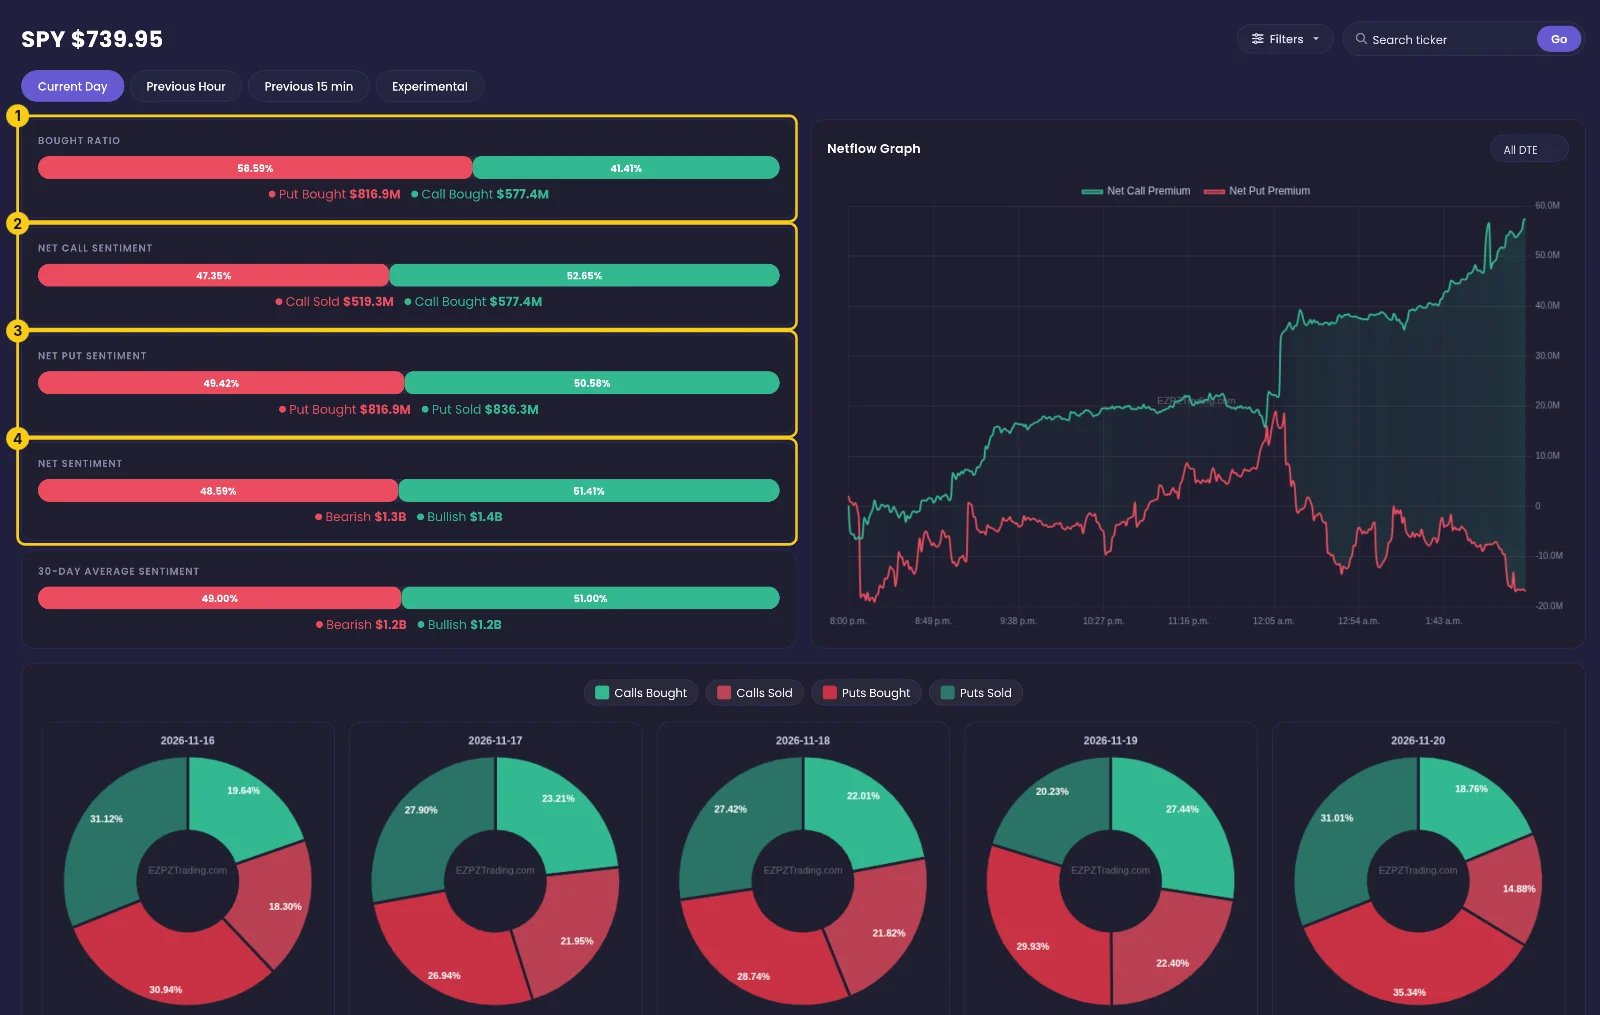
This is the exact routine, with the real screens from November 16, 2026. The yellow numbers show where to look.
Read the four sentiment cards in order
Open Money Sentiment for SPY. Start with (1) the Bought Ratio: 58.59% Put Bought ($816.9M) vs 41.41% Call Bought ($577.4M), so buyers leaned to puts. Then (2) Net Call Sentiment, 52.65% Call Bought vs 47.35% Call Sold, and (3) Net Put Sentiment, 50.58% Put Sold vs 49.42% Put Bought: both sides tipped bullish. Finish with (4) Net Sentiment, 51.41% Bullish ($1.4B) vs 48.59% Bearish ($1.3B), the overall read.
Compare against the 30-day average
Look at the 30-DAY AVERAGE SENTIMENT card below. SPY's baseline is 51.00% bullish. Today's 51.41% bullish is just above it. A reading this close to the baseline describes an ordinary day, not a lopsided one.
Switch the time window
Click Previous Hour, then Previous 15 min. Watch whether Net Sentiment flips from the bullish side to the bearish side, or stays put. A full-day read that disagrees with the last 15 minutes is often the first sign of a change of direction in the flow.
Scope with Filters
Open Filters, choose a moneyness or expiration type, and press Go. Check whether the bullish tilt holds when you narrow the view, or whether it lives in only one slice of the chain.
Check again before the close
Come back late in the session on Current Day. Note whether the bullish and bearish dollar totals still sit close together, and whether the split has moved further from or back toward the 30-day average.
Reading the page in plain English
Put the SPY example together and the story is simple. Buyers favoured puts. But put sellers matched them and then some, and call buyers beat call sellers. The result is a mild bullish tilt, sitting right at SPY's usual level.
- If the Bought Ratio leans to puts but Net Sentiment leans bullish, the page reads as put buying being absorbed by put selling. That was SPY on November 16, 2026.
- If Net Call Sentiment and Net Put Sentiment both lean the same way, the page reads as calls and puts agreeing.
- If the two cards point in opposite directions, the page reads as mixed flow, and Net Sentiment shows which side had more dollars.
- If Net Sentiment sits near the 30-Day Average, the page reads as a normal day for that ticker.
- If Net Sentiment moves far from the 30-Day Average, the page reads as an unusually one-sided day.
- If Previous 15 min disagrees with Current Day, the page reads as the latest money leaning differently from the session as a whole.
What this data cannot tell you
- Direction. A bullish tilt in premium describes how money leaned. It does not tell you where SPY goes next.
- Timing. The cards show a split for the chosen window. They do not say when, or if, that flow shows up in price.
- Intent. A put bought can be a bet or a hedge on stock someone owns. The page shows the side of the trade, not the reason behind it.
Common mistakes
- Reading only the Bought Ratio. It ignores sellers, and sellers flipped the SPY read on this day.
- Treating 51% as a strong signal. A split this close to 50/50 is a mild tilt, especially when the 30-day average sits at 51.00%.
- Skipping the 30-day baseline. Every ticker has its own normal. Judge today against it.
- Forgetting the time window. Current Day, Previous Hour and Previous 15 min can tell different stories. Check which one is selected.
- Forgetting active filters. A narrowed view is not the whole ticker. Reset Filters before comparing days.
Tools used in this post
These are the EZPZ tools that pair well with Money Sentiment when you want more context on the same day's flow.
Which plan you need
| Tool | Plan | Free delayed page |
|---|---|---|
| Money Sentiment | Pro | Yes |
| 0DTE Graph | Pro | Yes |
| 7-DTE Graph | Pro | Yes |
| Net Premium Heatmap | Pro | Yes |
| Expected Move | Pro | Yes |
| GEX Heatmap | Premium | None |
FAQ
What does "bought" vs "sold" mean on Money Sentiment?
Bought means the buyer was the eager side of the trade. Sold means the seller was the eager side. Call Bought and Put Sold lean bullish. Call Sold and Put Bought lean bearish. Beyond that, EZPZ's method is proprietary.
Which card should I read first?
Net Sentiment gives the fastest overall read. Then check Net Call Sentiment and Net Put Sentiment to see which side drives it, and the 30-Day Average Sentiment for context.
Why did SPY read bullish when buyers bought more puts?
Because Put Sold ($836.3M) was larger than Put Bought ($816.9M), and Call Bought ($577.4M) beat Call Sold ($519.3M). Both sides tipped bullish, so Net Sentiment read 51.41% bullish.
What do Previous Hour and Previous 15 min change?
They narrow every card to the last hour or the last 15 minutes of flow. Current Day shows the whole session so far.
Can I use it for tickers other than SPY?
Yes. Type another symbol and press Go. For a wider view of flow across many tickers, see how to read Largest Net Premiums or the Index Trader traffic lights guide.
Is there a free version?
Yes. The free delayed Money Sentiment page shows the same layout with delayed data. The live tab is on the Pro plan.