How to read Index Trader traffic lights: bullish vs bearish index flow and put/call ratios
In the latest data, SPX and SPY show BULLISH while QQQ and NDXP show BEARISH, and SPX's volume put/call ratio sits at 1.16 against a 0.91 30-day average. Here is how to read every part of the Index Trader tab.
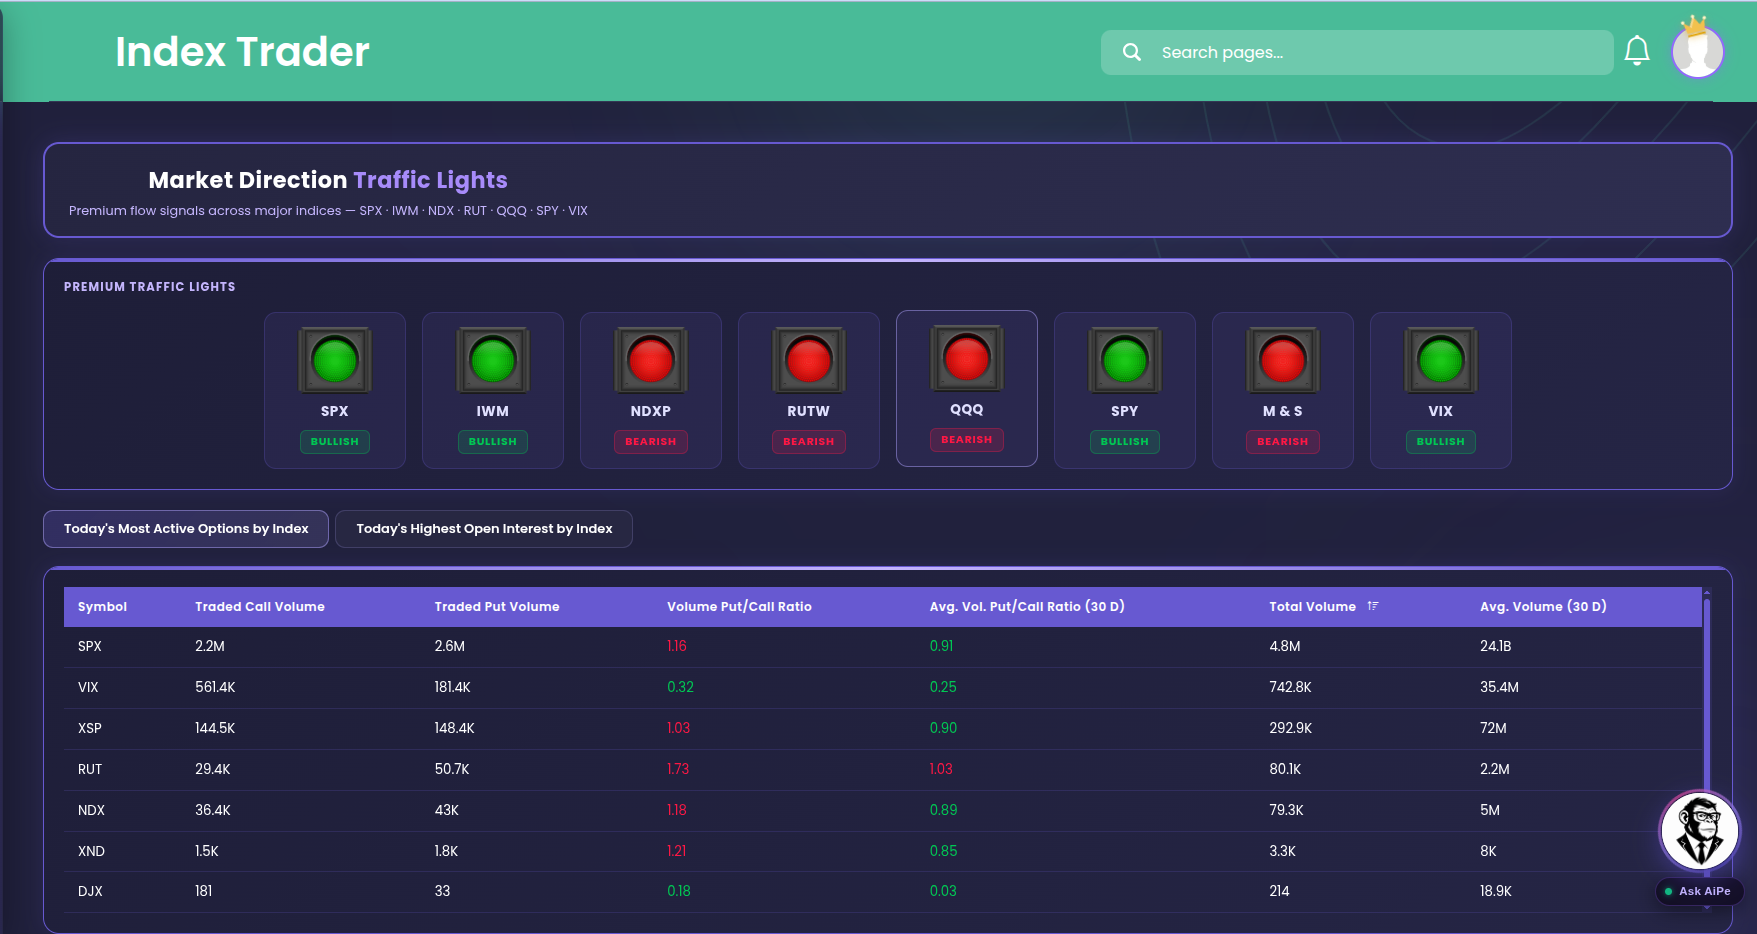
In the latest data on the Index Trader tab, the market isn't moving as one. SPX, SPY, IWM and VIX show BULLISH, while QQQ, NDXP, RUTW and M & S show BEARISH. In the table below the lights, SPX options show a volume put/call ratio of 1.16 against a 30-day average of 0.91. When the S&P side and the Nasdaq side light up in different colors, that split is the story. This tab shows it to you in seconds.
You can follow along on the live Index Trader page. No account? Open the free delayed Index Trader page instead.
Quick definition first. Index Trader is a market-direction dashboard for the major indexes and index ETFs. A traffic light is a one-word label (BULLISH or BEARISH) for each index. It tells you which way the options premium on that index leans. Options premium is the money traders pay for calls and puts. Call volume is how many call contracts traded, and put volume is how many put contracts traded. The put/call ratio compares the two. Above 1 means more puts traded than calls. Below 1 means more calls than puts. The 30-day average gives you the normal level for that index, so you can see whether the latest reading is unusual.
1.16
4.8M
0.32
The idea behind Index Trader: one glance at index direction
Most swing traders start the day with the same question. Which way are the big indexes leaning? Index Trader answers it in two layers. The lights give you the direction. The table tells you how busy each index's options are and whether puts or calls lead.
Why direction by index matters
SPX, SPY, QQQ and IWM often move together, but not always. When they split, a single "market is up" headline hides what's really going on. In the latest data, the S&P names (SPX, SPY) read BULLISH and the Nasdaq names (QQQ, NDXP) read BEARISH. A trader holding tech names would want to see that split before adding risk.
Why the put/call ratio needs context
A put/call ratio means little on its own. Some indexes always trade more puts, often as hedges. That's why the table puts the latest ratio right next to its 30-day average. The useful question is "higher or lower than normal?", not "above or below 1?".
What to look for
- Agreement: most lights the same color points to a broad lean.
- Splits: S&P vs Nasdaq vs small caps in different colors.
- VIX: the volatility light, read alongside the equity lights.
- Unusual ratios: a put/call ratio well away from its 30-day average.
Walking through the Index Trader tab, top to bottom
The tab has two parts. The traffic lights sit at the top and the index options table sits below them.
PREMIUM TRAFFIC LIGHTS
This strip shows eight lights in a row. Each one has a symbol and a single label. In the latest data they read:
- SPX -- BULLISH
- IWM -- BULLISH
- NDXP -- BEARISH
- RUTW -- BEARISH
- QQQ -- BEARISH
- SPY -- BULLISH
- M & S (Movers & Shakers) -- BEARISH
- VIX -- BULLISH
Read them in pairs. SPX and SPY are two views of the S&P 500, and both are BULLISH, so they agree. QQQ and NDXP are two views of the Nasdaq-100, and both are BEARISH, so they agree too. IWM and RUTW cover small caps, and here they disagree: IWM is BULLISH while RUTW is BEARISH. When a pair disagrees, treat that group as mixed.
M & S is BEARISH. VIX is BULLISH. A bullish VIX light means the premium on volatility leans up. When VIX reads bullish next to bullish S&P lights, the picture isn't clean. Some traders are leaning long the index while others are paying for protection. The lights show you that tension. They don't settle it.
EZPZ's method is proprietary. Read each light as a label for the lean in that index's options premium, nothing more.
Table
Below the lights is a table with one row per index options symbol: SPX, VIX, XSP, RUT, NDX, XND and DJX. Here is every column:
- Symbol -- the index the options are on. Read it as the row label.
- Traded Call Volume -- how many call contracts traded. Bigger means more call activity.
- Traded Put Volume -- how many put contracts traded. Compare it with the call column next to it.
- Volume Put/Call Ratio -- puts traded compared with calls traded. Above 1 means puts led. Below 1 means calls led.
- Avg. Vol. Put/Call Ratio (30 D) -- the normal put/call ratio over 30 days. Read the latest ratio against this one.
- Total Volume -- calls and puts traded together. It shows which indexes are busiest.
- Avg. Volume (30 D) -- the 30-day average volume figure shown for that symbol, next to Total Volume for context.
Reading the SPX row across: 2.2M calls traded and 2.6M puts traded. The Volume Put/Call Ratio is 1.16 and the 30-day average is 0.91. Total Volume is 4.8M and Avg. Volume (30 D) shows 24.1B. Put volume tops call volume, and the ratio sits above its normal level. That reads as heavier-than-usual put activity on SPX, even while the SPX light is BULLISH. Puts are often hedges, so a high ratio next to a bullish light can mean traders are leaning long while buying protection.
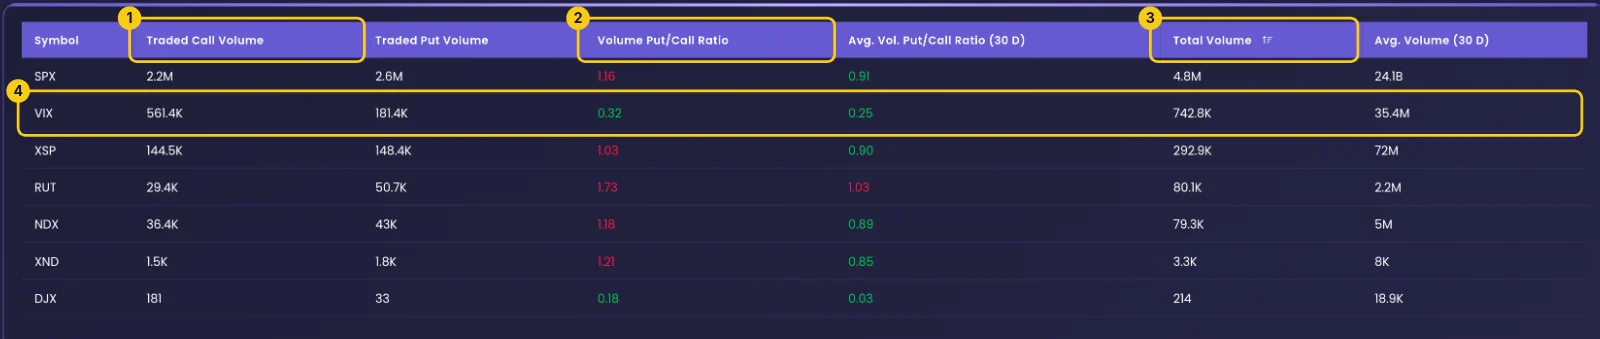
Reading the VIX row across: 561.4K calls and 181.4K puts. The Volume Put/Call Ratio is 0.32 against a 30-day average of 0.25. Total Volume is 742.8K and Avg. Volume (30 D) is 35.4M. Calls lead strongly on VIX, which is normal for it. The ratio is a bit above its average, so the call lean is slightly less one-sided than usual.
The Nasdaq rows: NDX shows 36.4K calls, 43K puts, a ratio of 1.18 against 0.89, and Total Volume of 79.3K. XND shows 1.21 against 0.85. Both sit above their averages, which fits the BEARISH QQQ and NDXP lights at the top.
Volume put/call ratio by index
SPX, NDX and XSP all sit above 1, so puts led on all three. VIX sits far below 1, with calls leading.
How to use the Index Trader on EZPZ: a 3-minute routine
This is the exact routine, with the real screens from the latest data. The yellow numbers show where to look.
Scan the traffic lights by pair
Open the Index Trader and start with the light strip. (1) SPX BULLISH and (2) IWM BULLISH show the S&P and small-cap ETF lights leaning up. (3) NDXP BEARISH and (4) RUTW BEARISH show the Nasdaq and the other small-cap light leaning down. With IWM and RUTW split, read small caps as mixed and the S&P vs Nasdaq split as the main theme.

Check put/call against its normal level
Move down to the table. (1) Traded Call Volume shows where call activity is heaviest, with SPX at 2.2M. (2) Volume Put/Call Ratio shows SPX at 1.16, above its 0.91 average, so puts led more than usual. (3) Total Volume confirms SPX is the busiest row at 4.8M. (4) The VIX row, 561.4K 181.4K 0.32 0.25 742.8K 35.4M, shows calls leading on volatility with a ratio a little above its average.
Zoom in where the lights disagree
When a light surprises you, look closer at that index on other tabs. The 0DTE Graph shows short-dated flow, and the Daily Net Premium Heatmap shows where premium is going by ticker. Then come back and recheck the lights before the close.
Reading the page in plain English
Put the lights and the table together and you get a quick read of where index options lean. Some common patterns:
- If SPX and SPY read BULLISH while QQQ and NDXP read BEARISH, as in the latest data, the page reads as a split market: the S&P side leans up, the Nasdaq side leans down.
- If a light is BULLISH but its put/call ratio sits above its 30-day average (SPX: 1.16 vs 0.91), the page reads as a bullish lean with extra hedging alongside it.
- If VIX reads BULLISH next to bullish equity lights, the page reads as mixed: the index lean is up, but volatility premium also leans up.
- If a pair like IWM and RUTW disagree, the page reads as no clear signal for that group.
- If most lights share one color and the ratios sit near their averages, the page reads as a broad, ordinary lean.
What this data cannot tell you
- Direction. A BULLISH or BEARISH light describes the lean of options premium, not where price goes next.
- Timing. The lights don't say when a lean starts or ends. They can change color between checks.
- Intent. The table counts contracts, not the reason behind them. A high put/call ratio can be hedging as easily as bearish bets.
Common mistakes
- Reading one light alone. SPX BULLISH means more when you check it against SPY, QQQ and VIX.
- Treating a ratio above 1 as bearish by default. Compare it with its 30-day average first.
- Ignoring split pairs. IWM BULLISH with RUTW BEARISH is a mixed read, not a bullish one.
- Skipping VIX. A bullish VIX light next to bullish index lights is a warning that the picture isn't clean.
- Using the page as a trade signal. It shows where flow leans. Your plan still decides the trade.
Tools used in this post
These are the EZPZ tools mentioned above, or useful next to the Index Trader.
Which plan you need
| Tool | Plan | Free delayed page |
|---|---|---|
| Index Trader | Pro | Yes |
| 0DTE Graph | Pro | Yes |
| 7-DTE Graph | Pro | Yes |
| Net Premium Heatmap | Pro | Yes |
| Expected Move | Pro | Yes |
| GEX Heatmap | Premium | None |
FAQ
What do the Index Trader traffic lights mean?
Each light labels the lean of options premium on one index or ETF as BULLISH or BEARISH. In the latest data, SPX, IWM, SPY and VIX are BULLISH, and NDXP, RUTW, QQQ and M & S are BEARISH.
Is a put/call ratio above 1 bearish?
Not by itself. It means more puts traded than calls. Compare it with the Avg. Vol. Put/Call Ratio (30 D) column. SPX at 1.16 stands out because its average is 0.91.
Why can SPX be bullish while QQQ is bearish?
The lights read each index on its own, so the S&P and Nasdaq can lean different ways. The page shows the split. It doesn't explain why.
How are the traffic lights worked out?
EZPZ's method is proprietary. The page is built to be read: check the color, compare pairs and cross-check with the table.
Can I use Index Trader without a paid plan?
Yes. There is a free delayed Index Trader page. The live version needs the Pro plan. For more guides, see the Learn center or our post on reading gamma exposure.