The most shorted stocks that actually trade: EZPZ Short Report, Sep 30, 2026
The highest short interest stocks at the Sep 30, 2026 FINRA settlement, with the tiny and thinly traded names stripped out. Plus the biggest increases and what our estimated synthetic short interest shows.
WOLF was the most shorted stock to pass our quality filter at the Sep 30, 2026 FINRA settlement, with 52% of its float sold short.
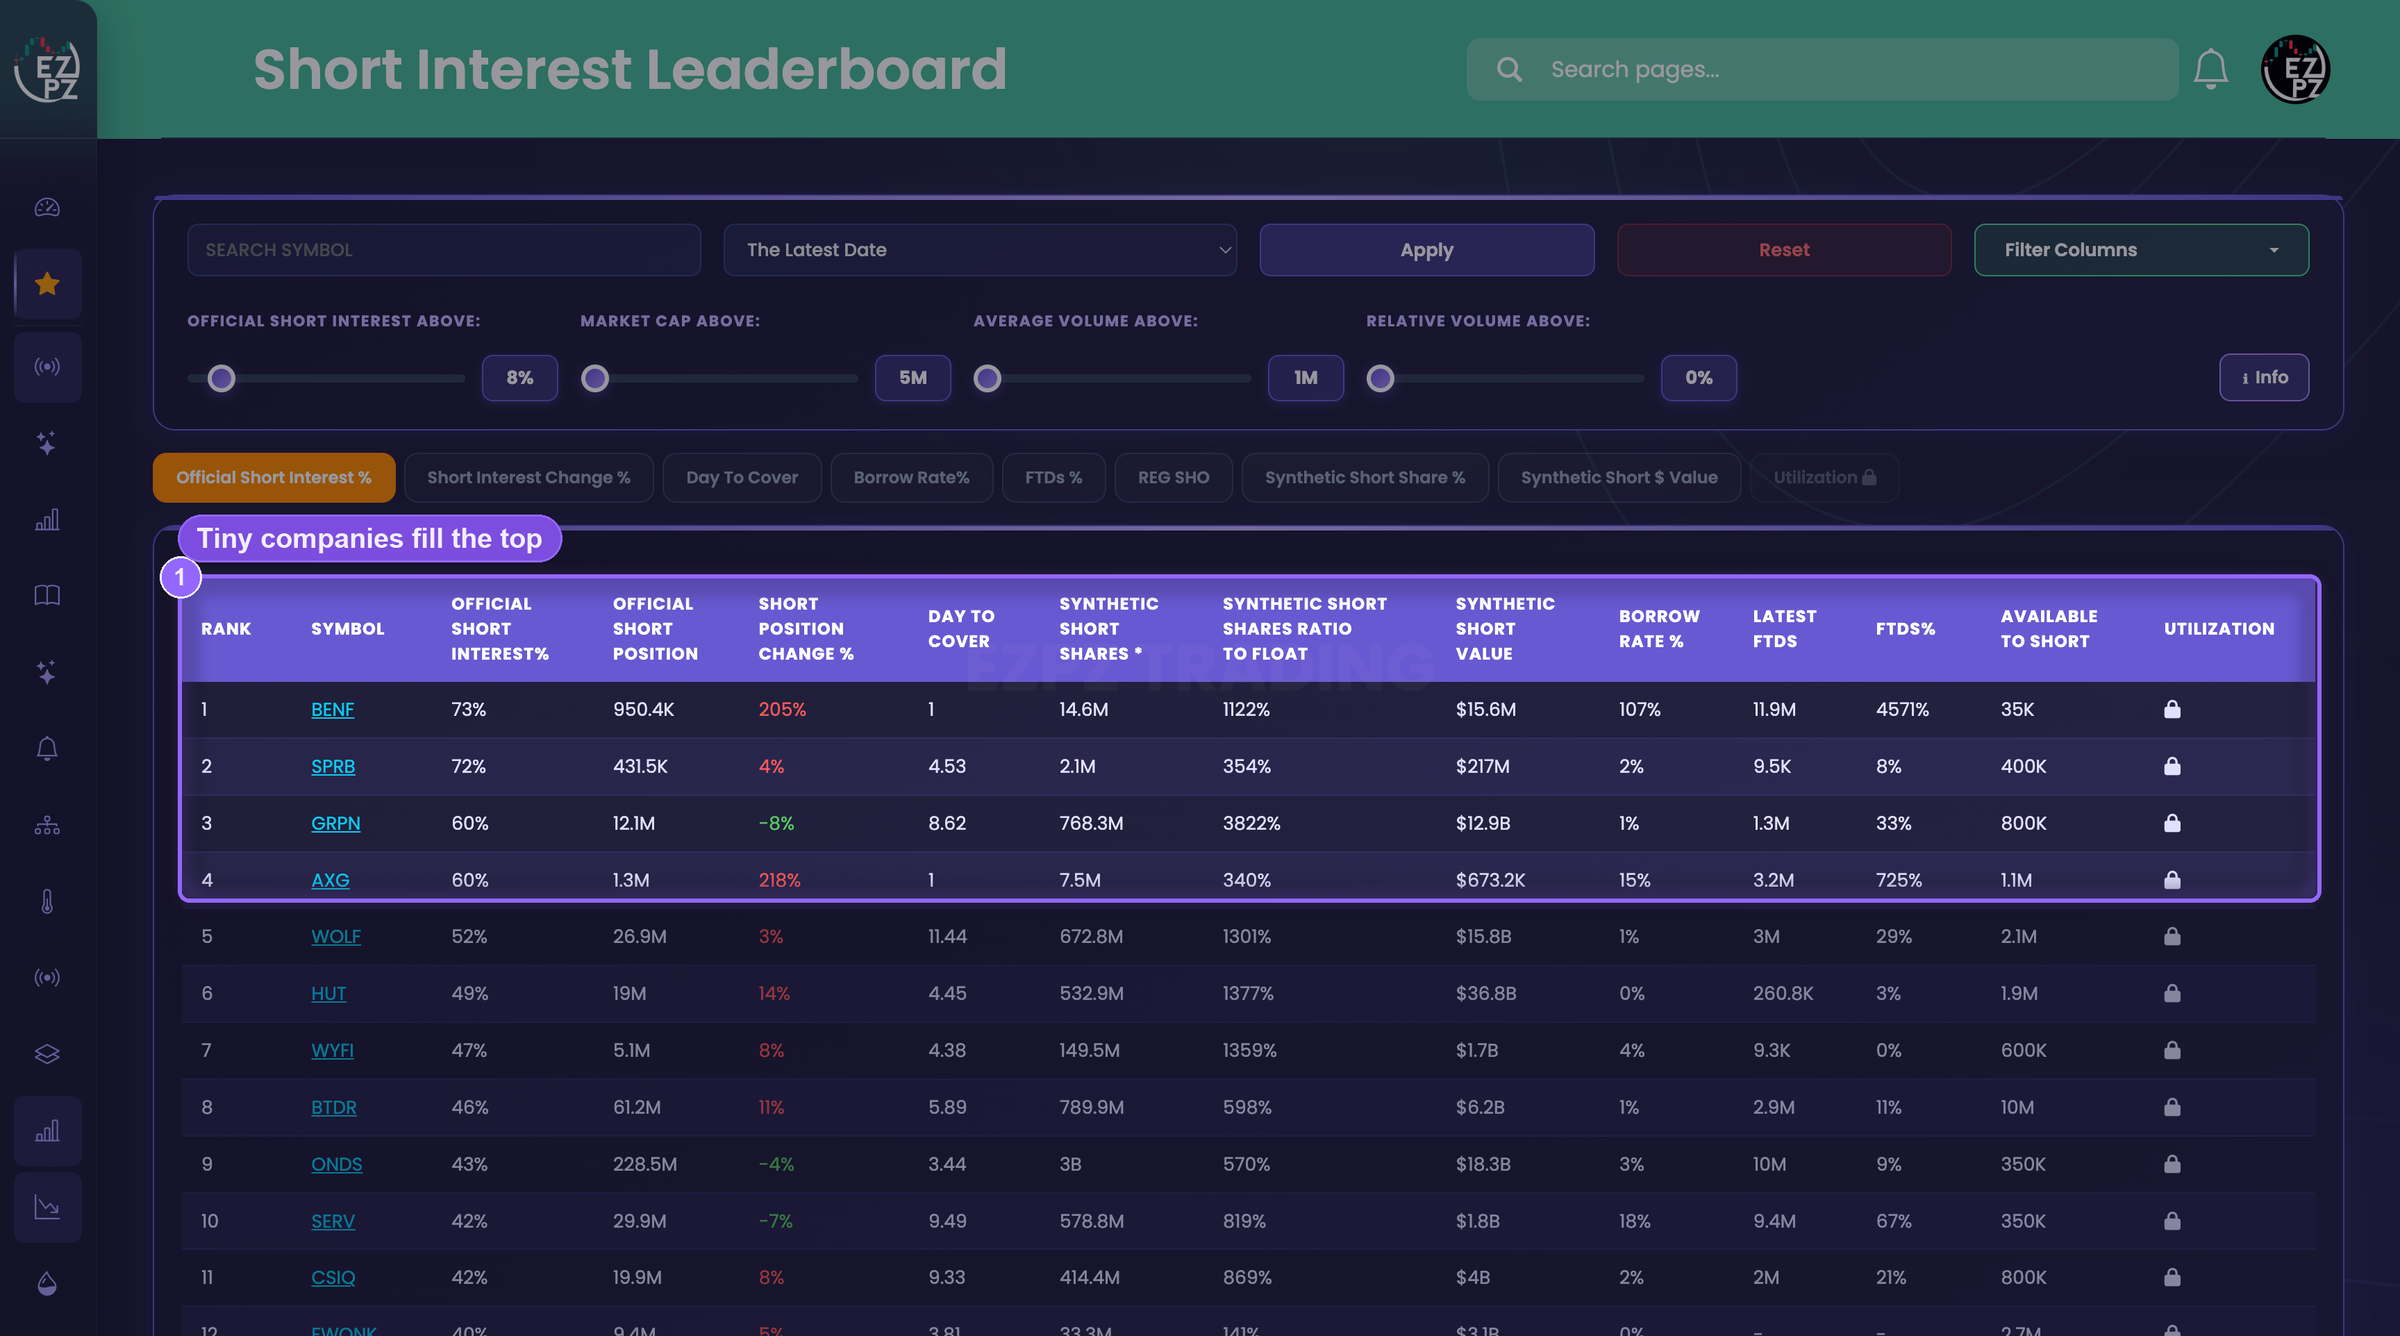
Raw "most shorted" lists are stuffed with tiny companies you can barely trade. So we kept only stocks with real size and real volume, then ranked what was left. Below you'll find the ten highest, the biggest increases since the last report, and what our estimated synthetic short interest adds.
52%
163 of 13,075
+42%
How we filtered
A small company with a thin float can post a huge short percentage on just a few hundred thousand shares, and trade too little for you to get in or out cleanly. Those names top every raw list and tell you almost nothing. So every stock here had to clear all four checks:
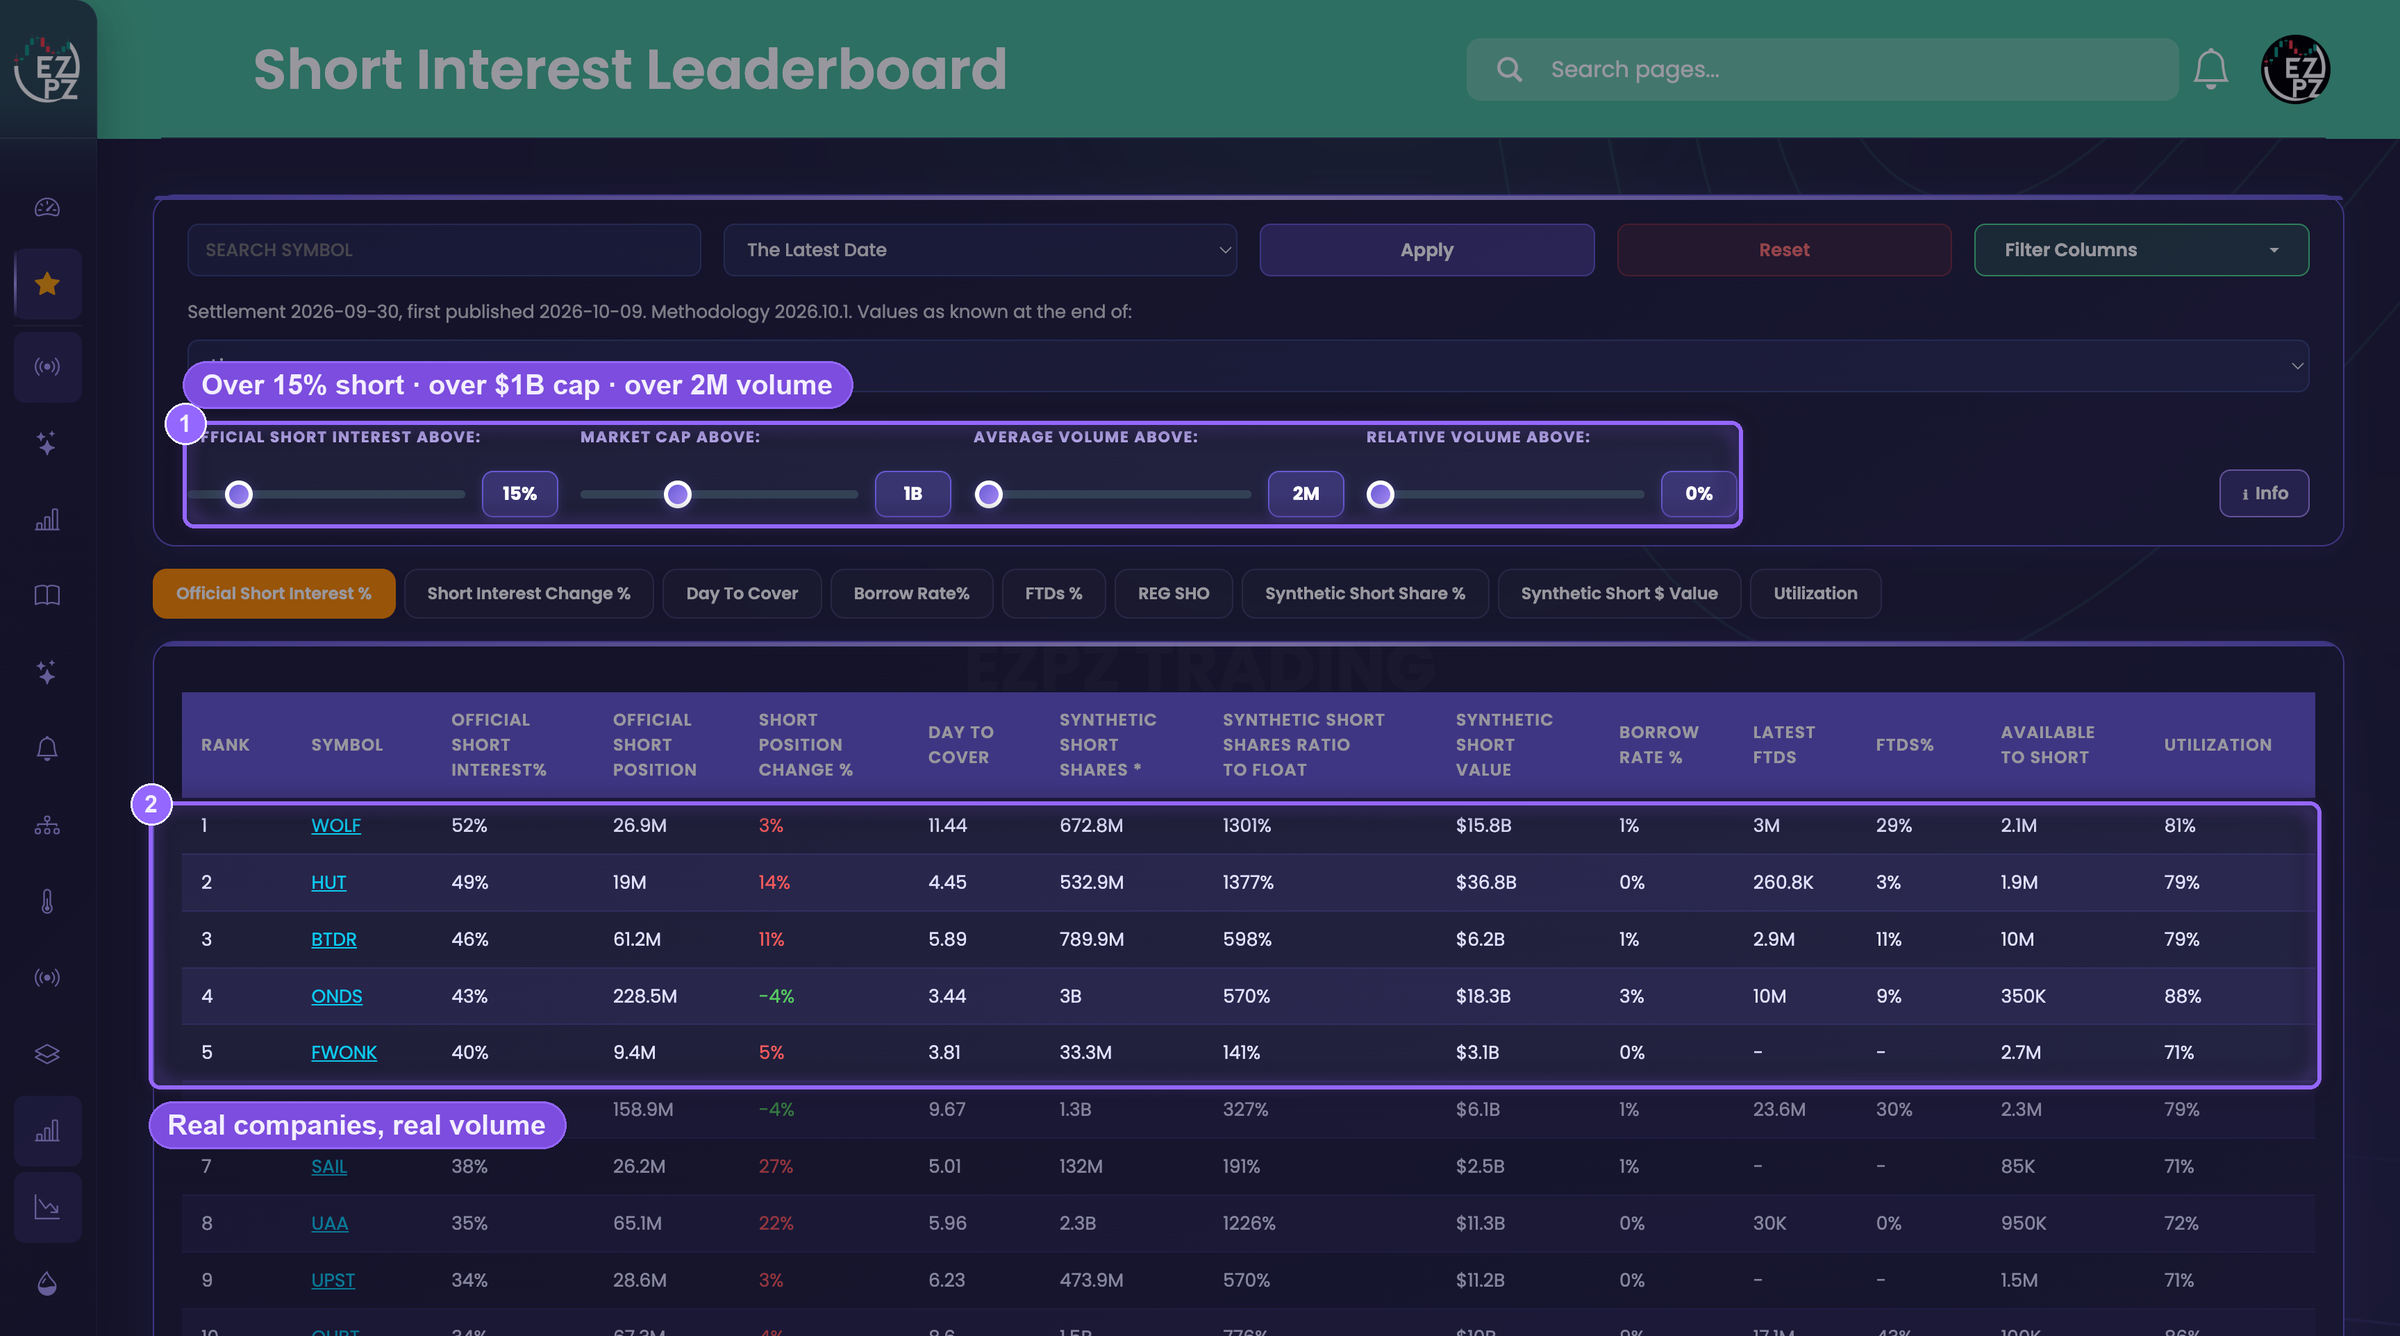
- Short interest above 15% of float
- Market cap above $1B
- Average daily volume above 2M shares
- No ETFs
We started with the 13,075 US stocks (ETFs excluded) that had both a FINRA short interest figure and a market cap at the Sep 30, 2026 settlement. 163 made it through.
You can pull up the exact same list with one link: the Short Interest Leaderboard with all four checks already set. Market caps and volumes are as of our export on Oct 21, 2026, 4:00 am ET.
The ten most shorted stocks that passed
FINRA settlement Sep 30, 2026, first published Oct 9, 2026. Change is versus the previous settlement. Synthetic is an EZPZ estimate.
| # | Ticker | Company | Short % of float | Shares short | Change | Days to cover | Est. synthetic % of float |
|---|---|---|---|---|---|---|---|
| 1 | WOLF | Wolfspeed Inc | 52% | 26.9M | +3% | 11.44 | 1301% |
| 2 | HUT | Hut 8 Corp | 49% | 19M | +14% | 4.45 | 1377% |
| 3 | BTDR | Bitdeer Technologies Group. | 46% | 61.2M | +11% | 5.89 | 598% |
| 4 | ONDS | Ondas Holdings Inc | 43% | 228.5M | −4% | 3.44 | 570% |
| 5 | FWONK | Liberty Media Corp. | 40% | 9.4M | +5% | 3.81 | 141% |
| 6 | SOUN | SoundHound AI Inc | 40% | 158.9M | −4% | 9.67 | 327% |
| 7 | SAIL | Sailpoint Inc. | 38% | 26.2M | +27% | 5.01 | 191% |
| 8 | UAA | Under Armour Inc | 35% | 65.1M | +22% | 5.96 | 1226% |
| 9 | UPST | Upstart Holdings Inc | 34% | 28.6M | +3% | 6.23 | 570% |
| 10 | QUBT | Quantum Computing Inc | 34% | 67.3M | +4% | 8.6 | 776% |
Short interest, % of float
Biggest increases in shares short
These are the filtered names whose short position grew the most, in percent, since the previous settlement. A rising number means more shares were sold short and haven't been bought back yet.
What the Estimated Synthetic Short Interest adds
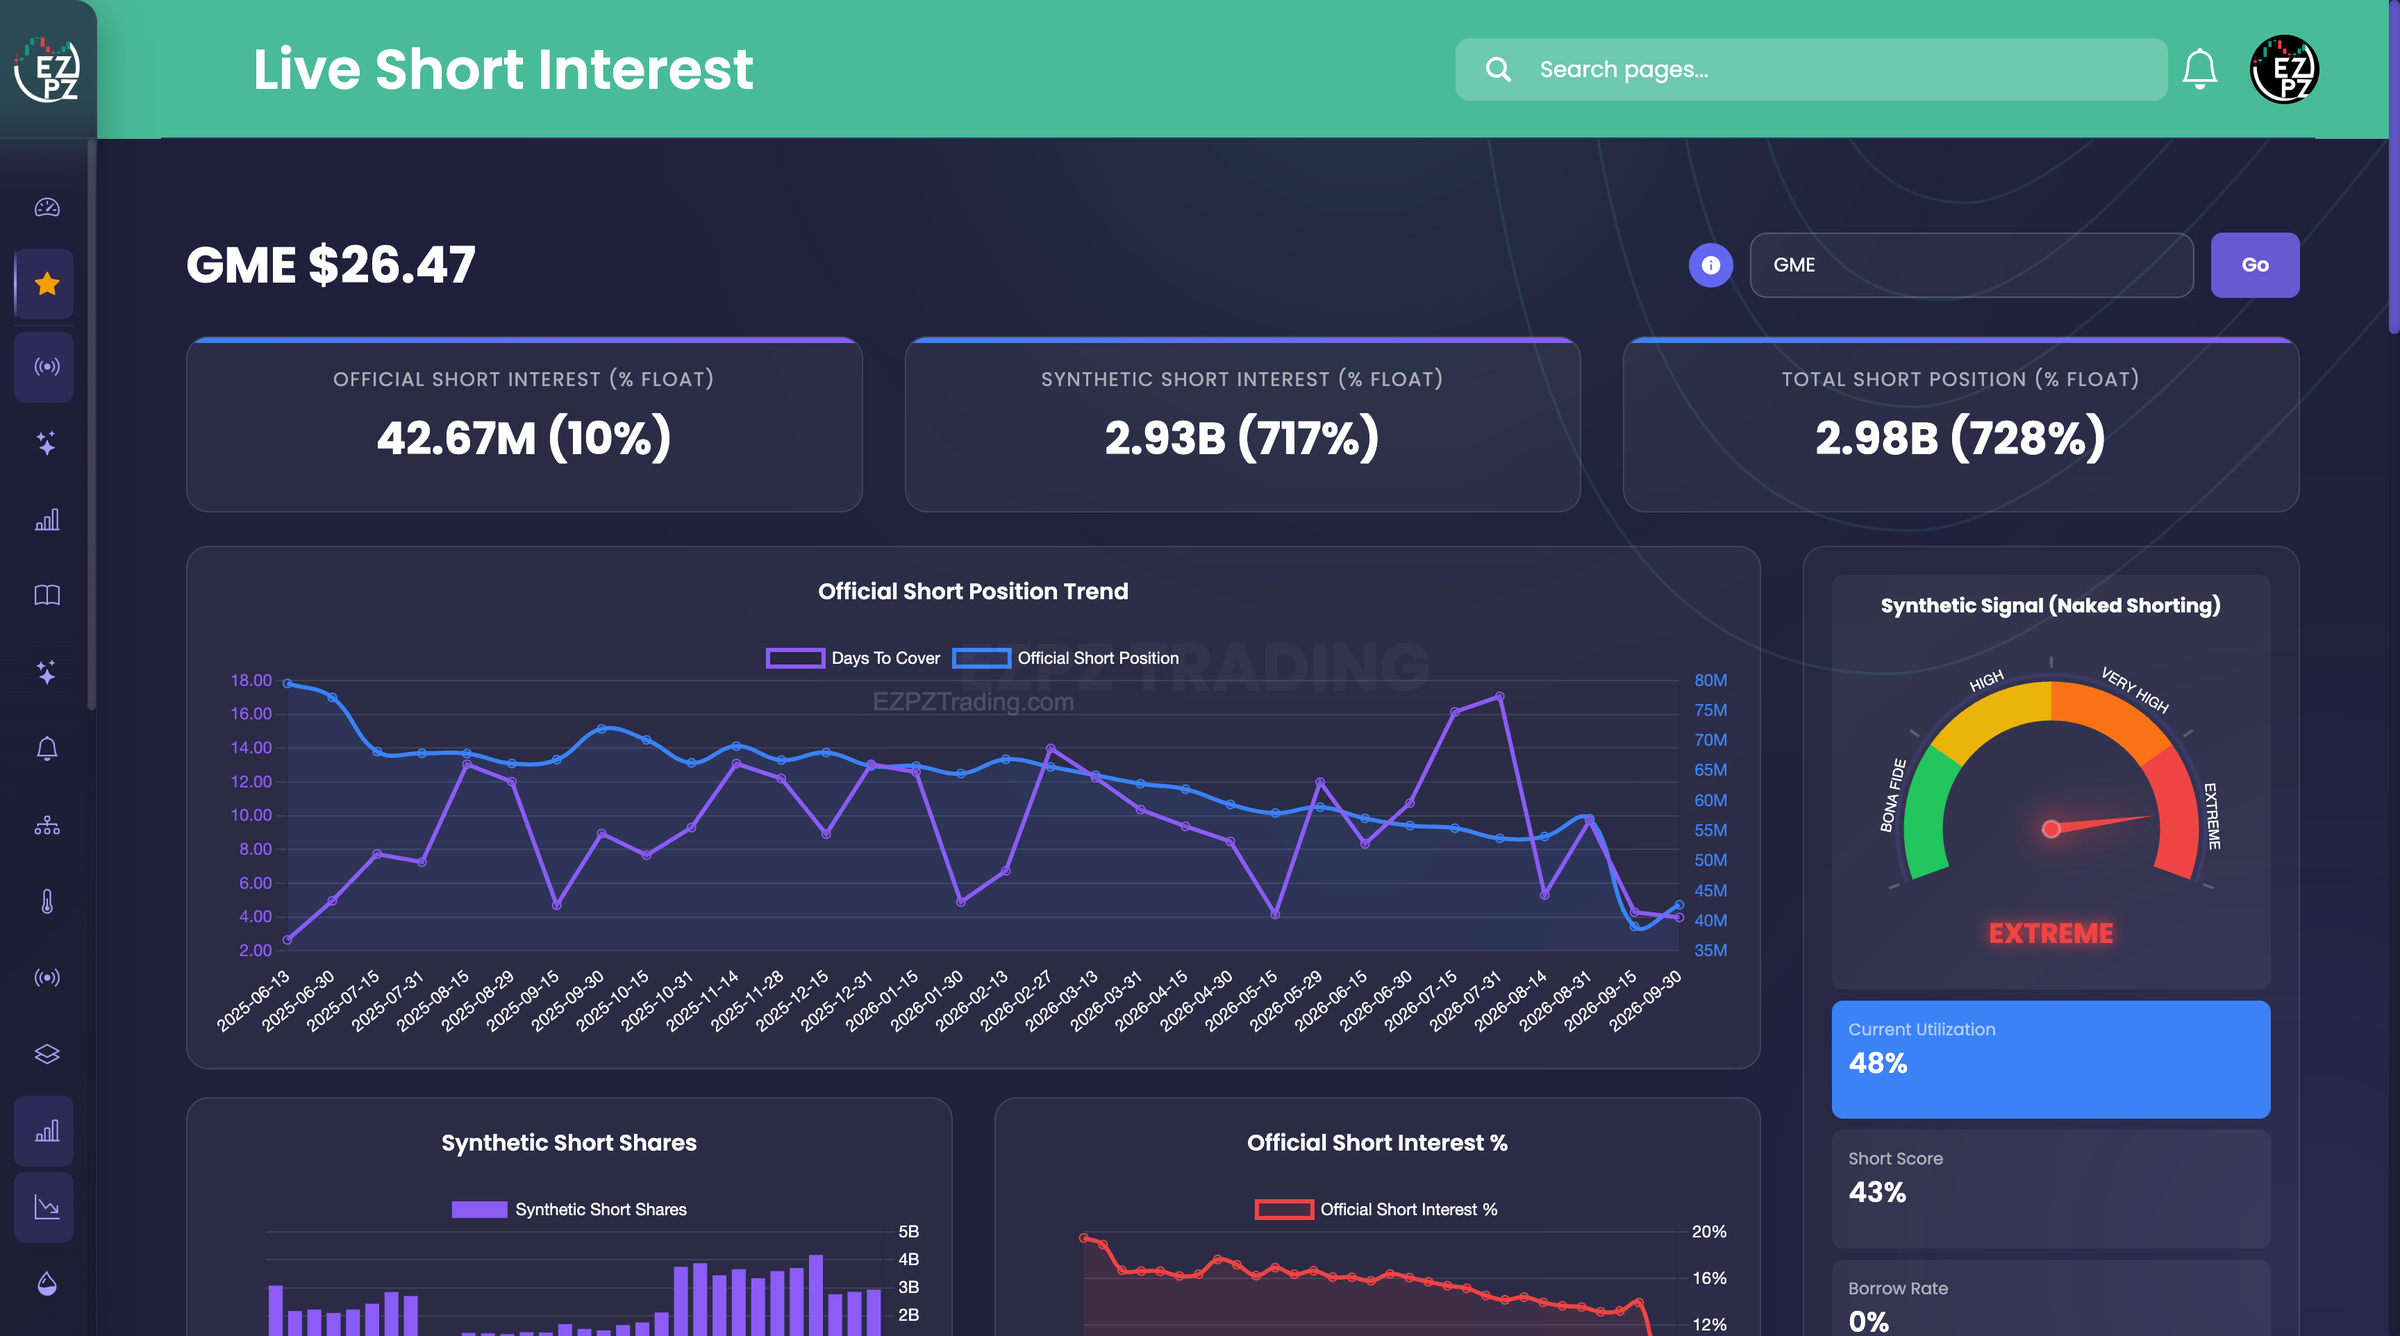
Official short interest only counts shares that were borrowed, sold short and reported. Traders can also build short exposure without borrowing a share, mostly through options. Estimated Synthetic Short Interest is our attempt to size that extra exposure.
It combines several market data sources, including options activity, securities lending and borrow data, fails-to-deliver, Reg SHO status and short interest trends. The model and its weights are proprietary, so we publish the result and keep the recipe in-house. The ratio shown is estimated synthetic shares divided by float.
Read it as a structural pressure gauge. It's an estimate, and it won't match any official count. A ratio above 100% means the estimate is larger than the float. Nobody sold more shares short than exist.
Of the ten most shorted names above, these three had the highest estimated synthetic ratio:
- HUT: estimated synthetic short interest of 1377% of float, versus official short interest of 49%. EZPZ signal band: EXTREME.
- WOLF: estimated synthetic short interest of 1301% of float, versus official short interest of 52%. EZPZ signal band: EXTREME.
- UAA: estimated synthetic short interest of 1226% of float, versus official short interest of 35%. EZPZ signal band: EXTREME.
The signal bands run Bona Fide, High, Very High and Extreme. They describe the estimate. They don't predict price.
Where shorting got expensive since settlement
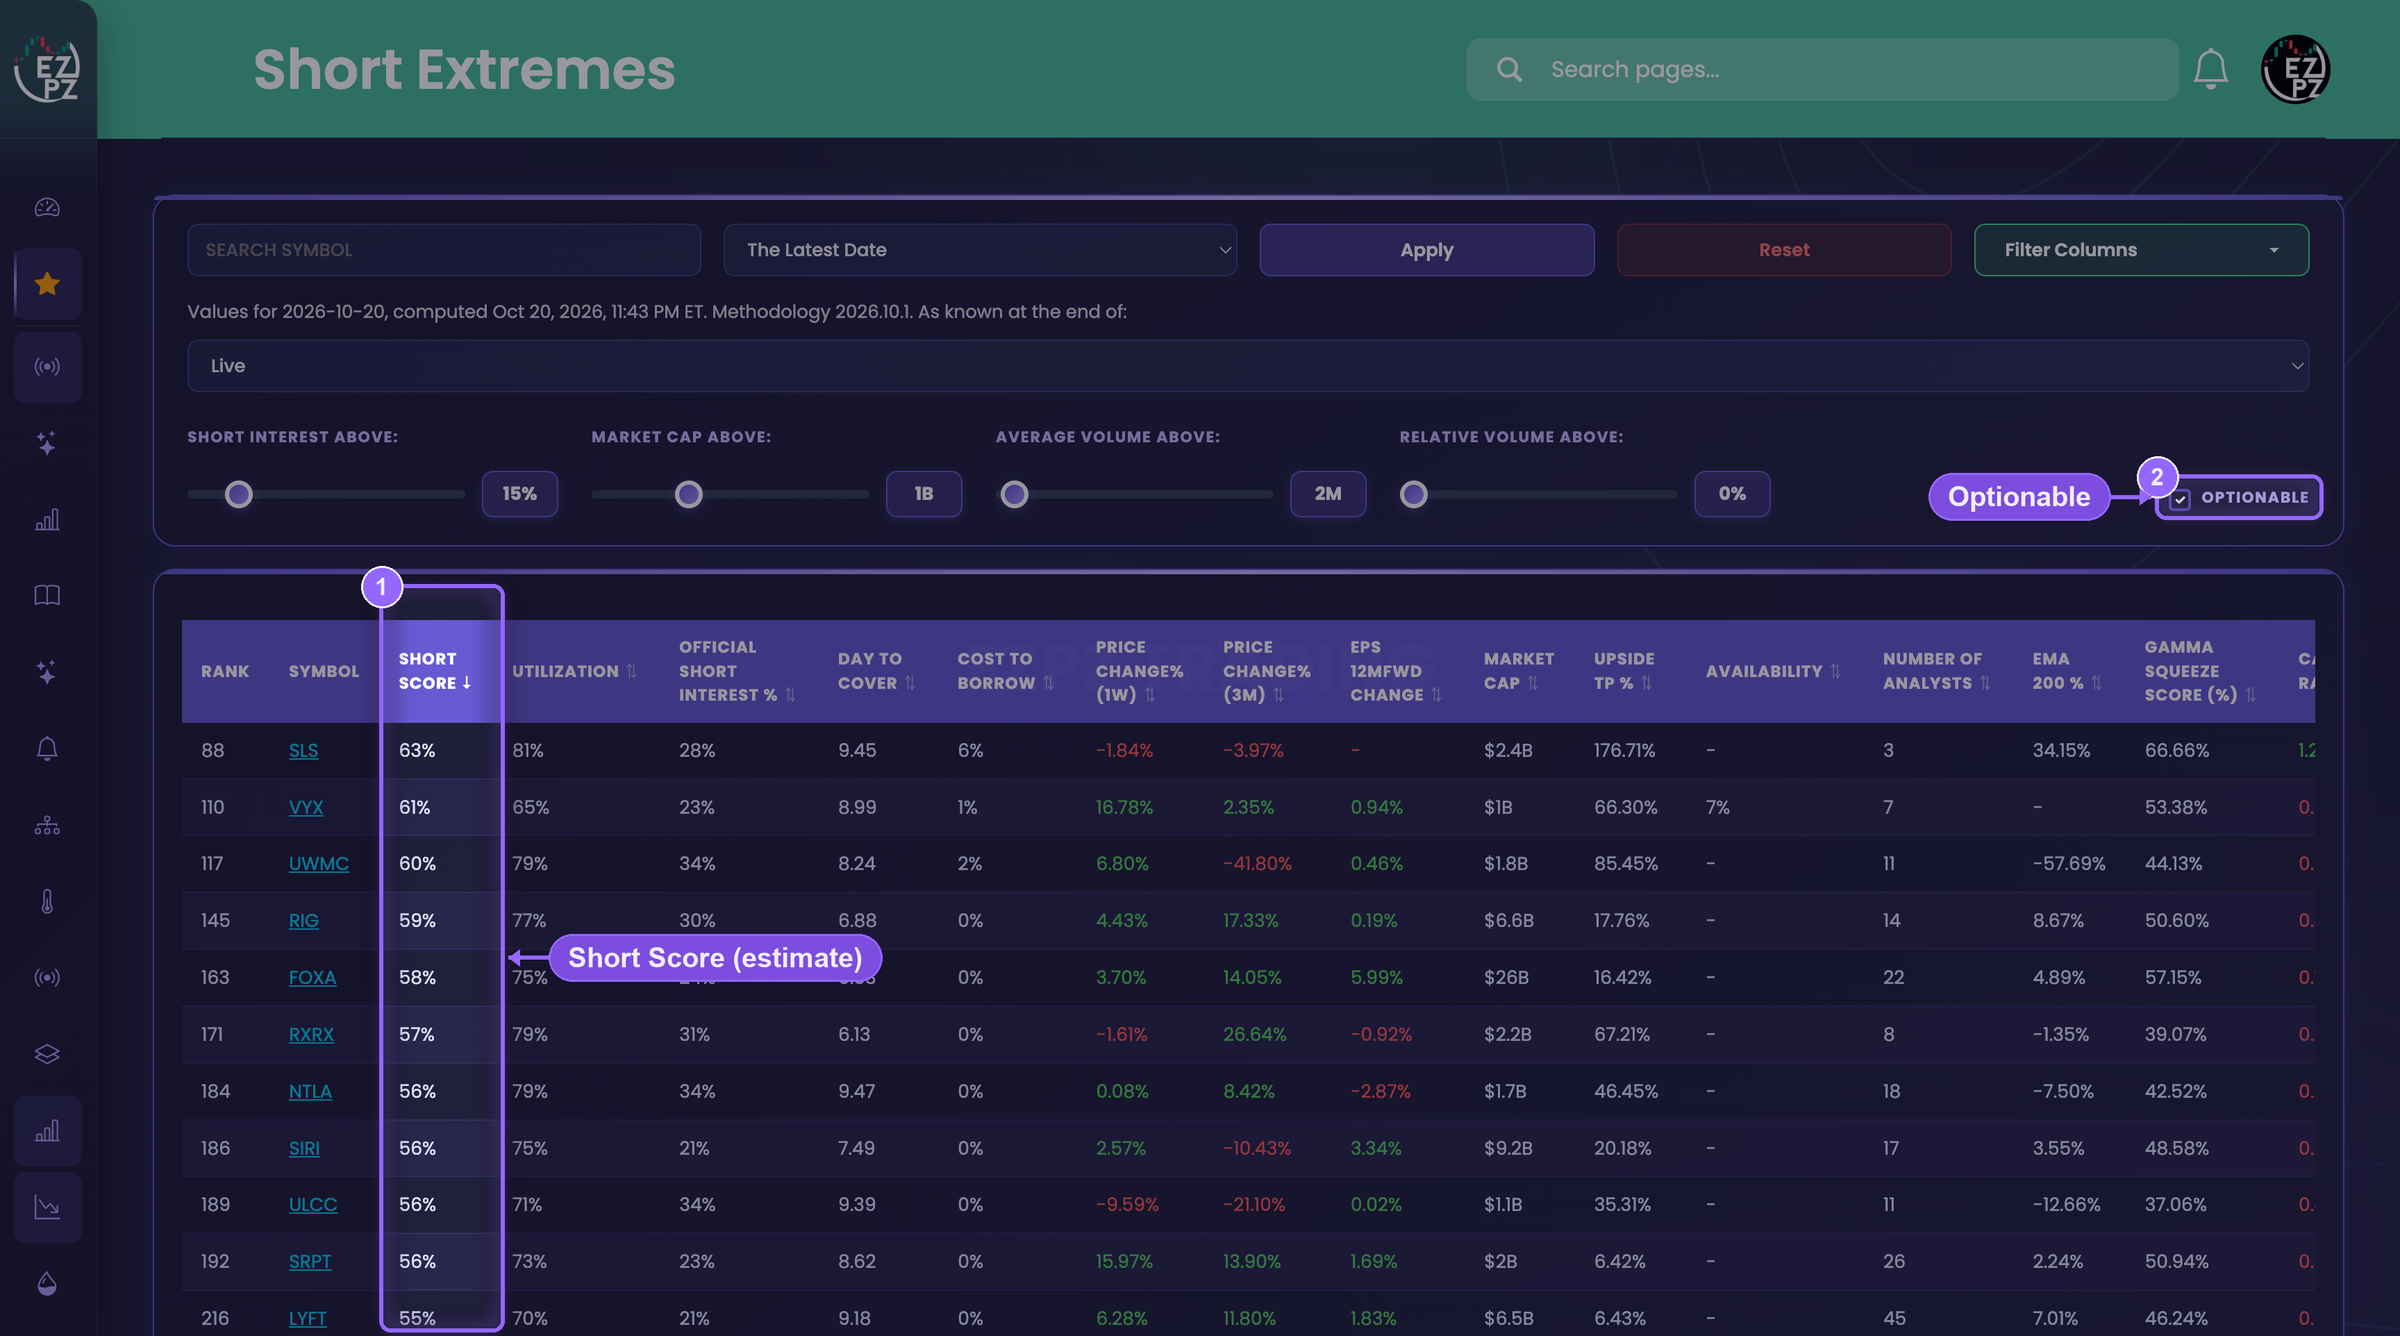
Short interest is a snapshot from Sep 30, 2026. Borrow costs and options positioning move every day. The Short Score on Short Extremes is our composite estimate of short pressure, rolling borrow, positioning and short interest data into one daily number. Here are the highest Short Score estimates among the filtered names on Oct 20, 2026:
| Ticker | Short Score (estimate) | Cost to borrow | Short % of float (Sep 30) |
|---|---|---|---|
| LCID | 66% | 14% | 29% |
| ONDS | 66% | 3% | 43% |
| SLS | 63% | 6% | 28% |
| TNGX | 63% | 0% | 28% |
| NCLH | 61% | 0% | 21% |
A high cost to borrow means shares to short are scarce, and that makes a short more expensive to hold. It doesn't tell you when shorts will cover.
How to read this
- High short interest is a crowded trade. It shows a lot of traders expect the price to fall. It doesn't say when they'll buy back, or if they will.
- Days to cover is about the exit. It's FINRA's estimate of how many average trading days it would take shorts to buy back their shares. More days means a slower, harder exit if the price rises.
- The data is already old. These positions are as of Sep 30, 2026. FINRA published them on Oct 9, 2026. The next settlement is Oct 15, 2026, published about Oct 26.
- Change matters as much as level. A rising short position on a liquid name tells you more than a high number that's sat still for months.
Methodology and caveats
- Official short interest is FINRA consolidated short interest, with settlement dates twice a month. FINRA publishes each one about seven business days later.
- Short % of float is the short position divided by float. Days to cover is FINRA's figure.
- Estimated Synthetic Short Interest and the Short Score are EZPZ's own models, and both are estimates.
- Rows are the live values for the Sep 30, 2026 settlement (first published Oct 9, 2026), methodology 2026.10.1. Short Extremes values are for Oct 20, 2026.
- Older settlements on the leaderboard show values as first published, so a backtest won't see later corrections.
- Market cap, average volume and price come from our database at export time and may differ from other sources.
Frequently asked questions
What is the most shorted stock right now?
Among stocks that passed our quality filter at the Sep 30, 2026 settlement, it was WOLF, with 52% of its float sold short.
What does short interest as a percent of float mean?
It's the number of shares sold short and not yet bought back, divided by the shares available to trade. The higher the percentage, the bigger the slice of tradable stock that's held short.
What does days to cover tell you?
How many days of average trading volume it would take every short to buy back. FINRA publishes it with each settlement.
What is estimated synthetic short interest?
It's an EZPZ estimate of extra short exposure built through synthetic methods such as options, on top of the borrowed shares reported officially. Use it as a pressure gauge. It isn't an exact count.
Does high short interest mean a squeeze is coming?
No. Many heavily shorted stocks keep falling. A squeeze needs buyers and a reason for shorts to exit, and short interest alone shows you neither.
How often is short interest updated?
FINRA collects it twice a month and publishes it about seven business days after each settlement date.
Track it live on EZPZ
Each card opens the live page, the free delayed page where there is one, and the plain-English guide.