When options flow and the tape disagree: a net flow chart walkthrough.
In the latest SPY data, call premium led put premium for a net +$7.39M. But CVD sat at -1,779,197, price was below its EMA and dark pool sells topped buys. Here is how to read every panel when they disagree.
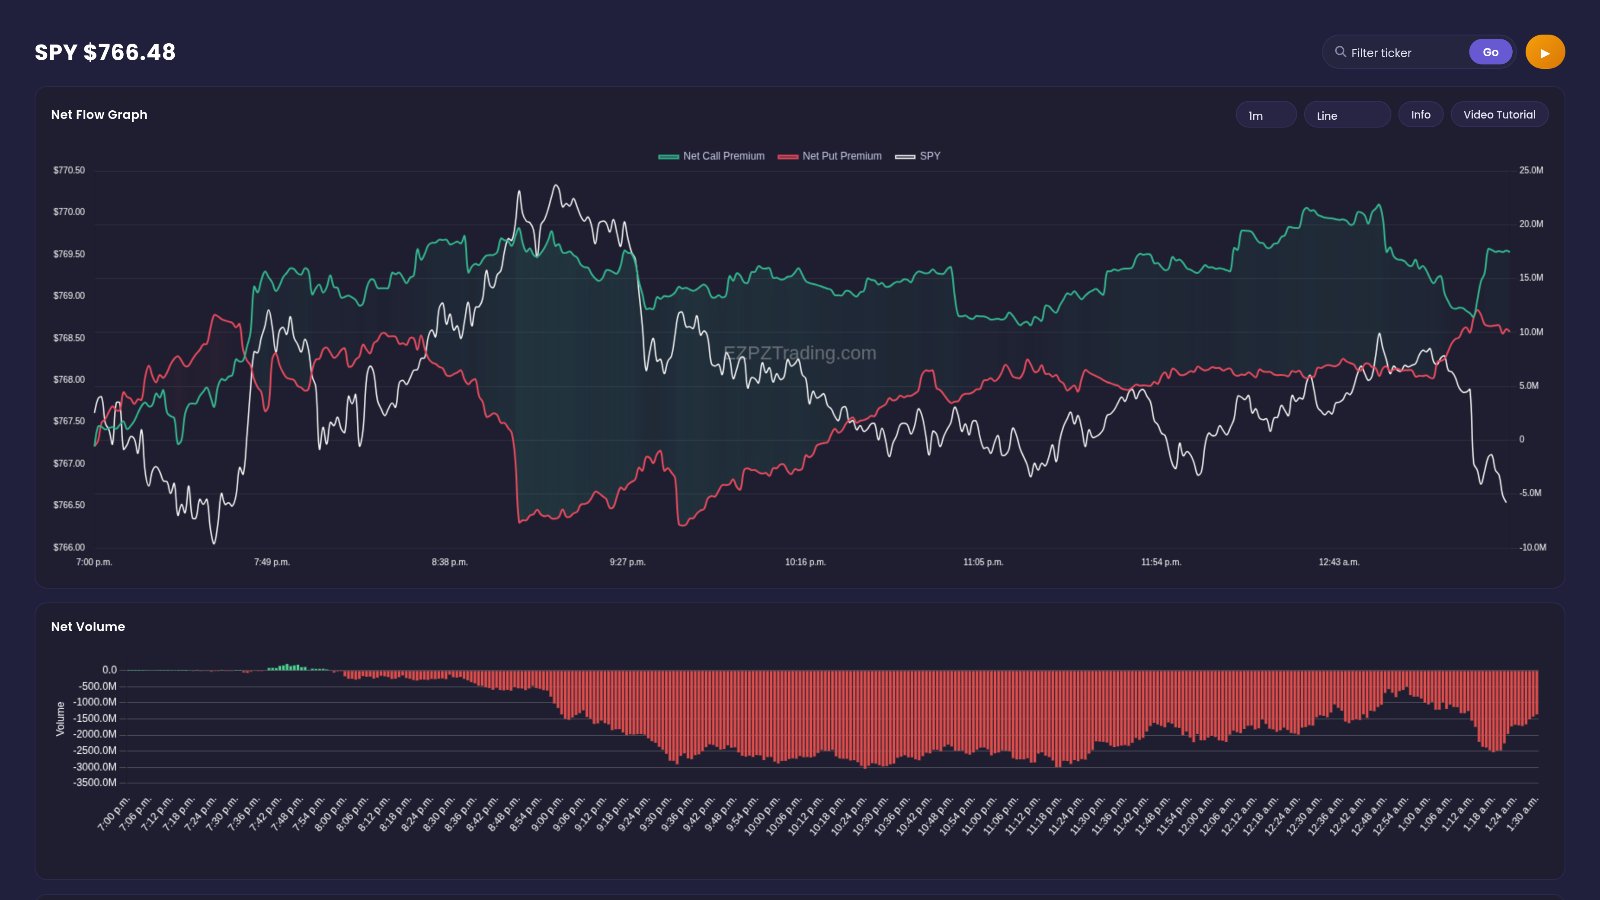
In the latest SPY data, the Net Flow Chart shows call premium at +$17.46M and put premium at +$10.07M, for a net reading of +$7.39M. That reads bullish. But the panels below tell a different story: Cumulative Volume Delta finished at -1,779,197, price at $766.50 sat under its EMA at $767.68, and dark pool sell flow of +$3668.18M topped buy flow of +$3149.95M.
That split is the most useful thing this tab can show you. One panel alone can fool you. When the panels agree, the read is clean. When they disagree, you know the picture is mixed. You can follow along on the live Net Flow Chart. No account? Open the free delayed Net Flow page.
Quick definition first. Net flow is call premium minus put premium for one ticker. Premium is the dollars paid for options. Call flow (green) is bullish-leaning premium. Put flow (red) is bearish-leaning premium. Net volume is the running count of bullish minus bearish contracts. CVD (Cumulative Volume Delta) tracks whether aggressive buyers or aggressive sellers are winning on the share tape. The EMA is a moving average of price; price above it reads as an uptrend, below it as a downtrend. Dark pool flow is share trading done off the public exchanges, split into buy and sell dollars.
+$7.39M
-1,779,197
+$3668.18M
The idea behind the Net Flow Chart: one ticker, many votes
The Net Flow Chart stacks several views of the same ticker on one tab. Options premium, options contract count, share tape aggression, price trend and dark pool flow. Each one is a separate "vote" on what traders are doing.
Why premium and price can disagree
Options flow is not a price forecast. Puts are often cheaper, so put buying can look small in dollars. Some trades are long-dated hedges or swing positions. So a bullish premium reading can sit next to a falling price, and the reverse. The tab lets you see both at once.
Confluence vs divergence
- Confluence: net flow, net volume, CVD, the EMA trend and dark pool all lean the same way. The read is clean.
- Divergence: one or two panels lean against the rest. The read is mixed, and the gap itself is information.
- In the SPY example, premium leaned bullish while net volume, CVD, the EMA trend and dark pool all leaned bearish.
Size is relative
A net +$7.39M means something different for SPY than for a smaller name. SPY trades huge premium every day. Always judge a reading against what is normal for that ticker. Watch the width of the gap between the green and red lines more than the raw number.
The Net Flow Chart, panel by panel
Here is the tab top to bottom, exactly as you see it.
Toolbar
At the top is a search box labelled Filter ticker and a Go button. Type a symbol, such as SPY, and press Go. Every panel below switches to that ticker. The whole tab is ticker-specific, so this is the first thing to set.
Net Flow Graph
This is the main chart. It plots call flow (green) and put flow (red) through the day, with a net line and a price overlay. Its controls:
- 1m / 5m -- switches the chart between one-minute and five-minute intervals. 1m shows every wiggle; 5m smooths the noise.
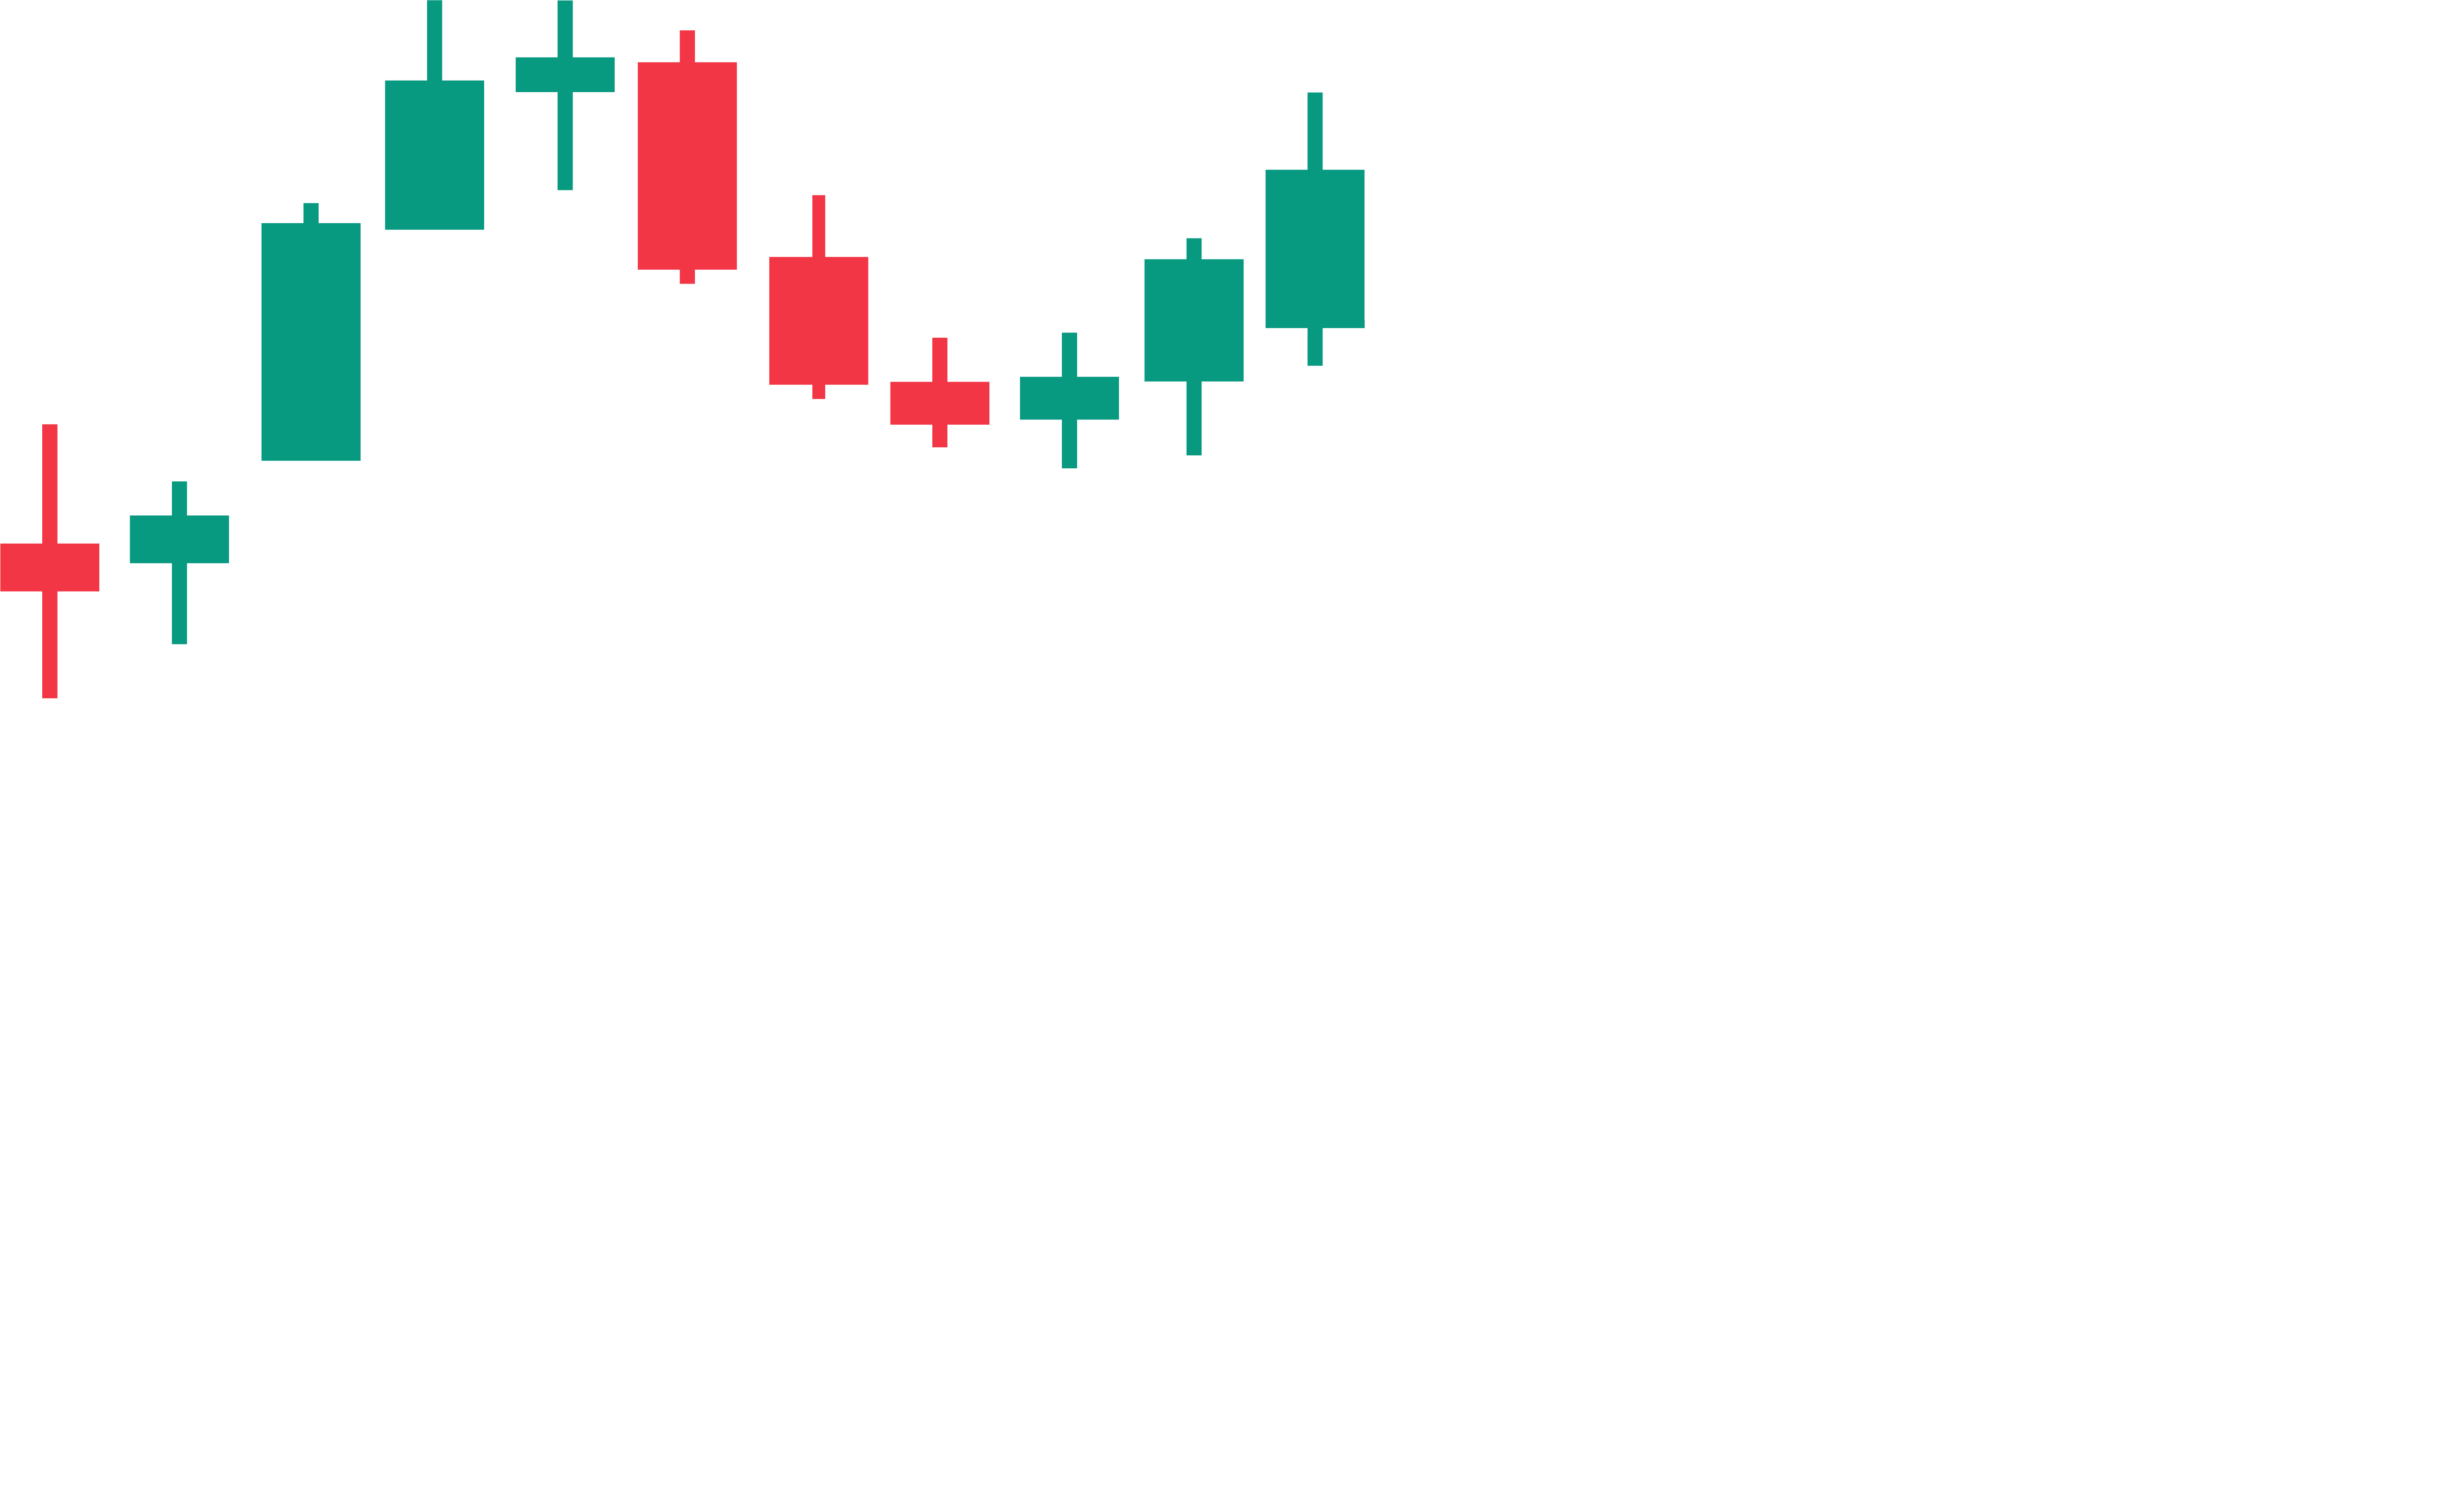
- Line / Candles -- changes how the chart is drawn: a simple line, or candles.
- Info -- opens a short explanation of the panel.
- Video Tutorial -- opens a walkthrough video of the page.
How to read it: when green sits above red, call premium leads. A widening gap means a stronger lean. In the latest SPY data, call flow ended at +$17.46M and put flow at +$10.07M, for net +$7.39M with price at $766.54. Earlier, the gap was much wider. At 9:06 PM ET, call flow was +$19.40M, put flow was -$7.26M and the net reached +$26.66M. Near the start, the net was negative, at -$7.36M at 7:24 PM ET.
SPY net flow through the latest data
Read the shape, not just the last point. The net climbed to its high, then gave back much of it. Late on, it narrowed to +$1.54M before widening again to +$7.39M.
Net Volume
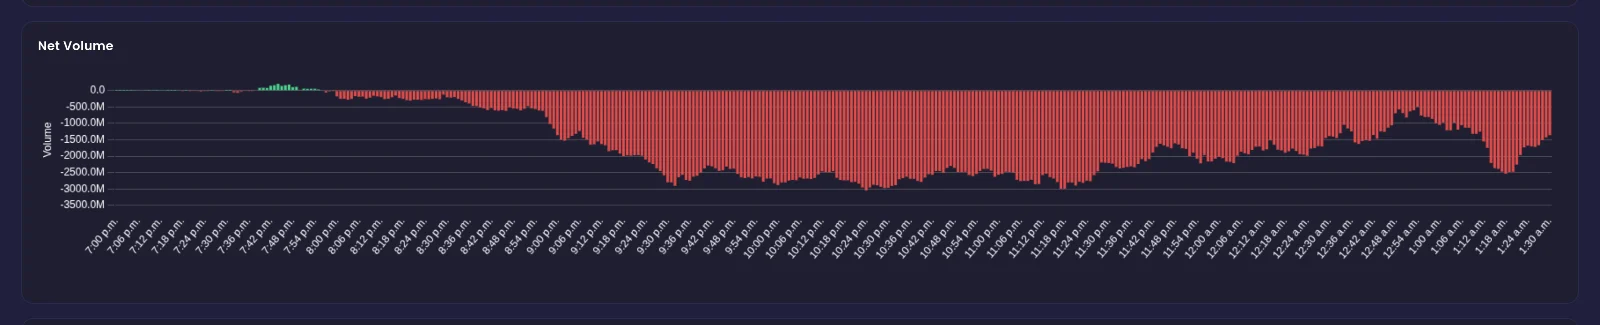
This panel shows the running total of bullish minus bearish options contracts. Above zero means more bullish contracts. Below zero means more bearish contracts. It checks the premium chart with a raw count.
In the latest SPY data, net volume ended at -1,357,780,794. That reads bearish, against the bullish premium above. Its deepest sampled point was -2,896,022,232 at 11:21 PM ET. So the dollars leaned to calls, while the contract count leaned the other way.
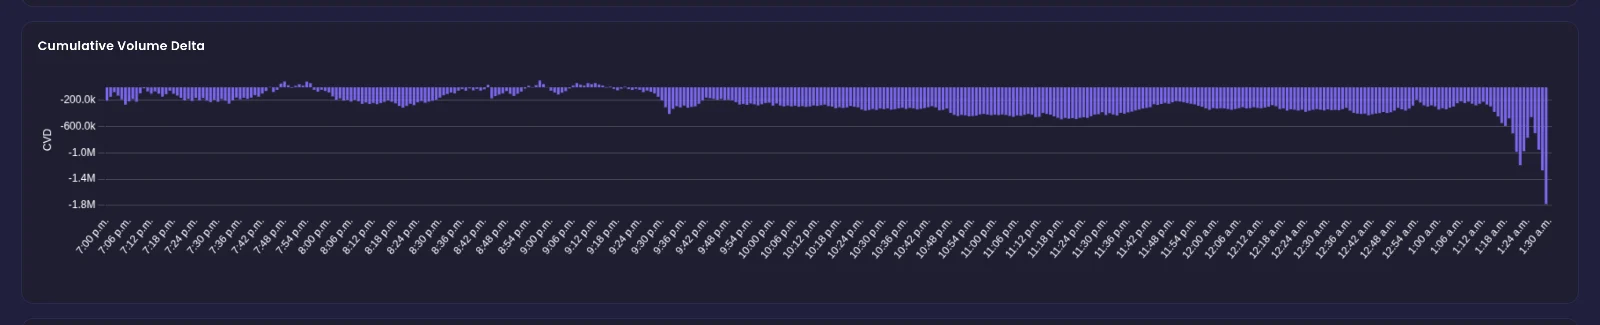
Cumulative Volume Delta
CVD tracks aggressive buyers against aggressive sellers on the share tape. Rising CVD means buyers are pushing. Falling CVD means sellers are pushing. When CVD and price move apart, that divergence is worth noting.
For SPY, CVD peaked at 103,987 and ended at its trough, -1,779,197. The drop was sharp at the end: -589,734 at 1:18 AM ET, then -949,979 at 1:27 AM ET, then -1,779,197. Sellers were the more aggressive side into the latest reading.
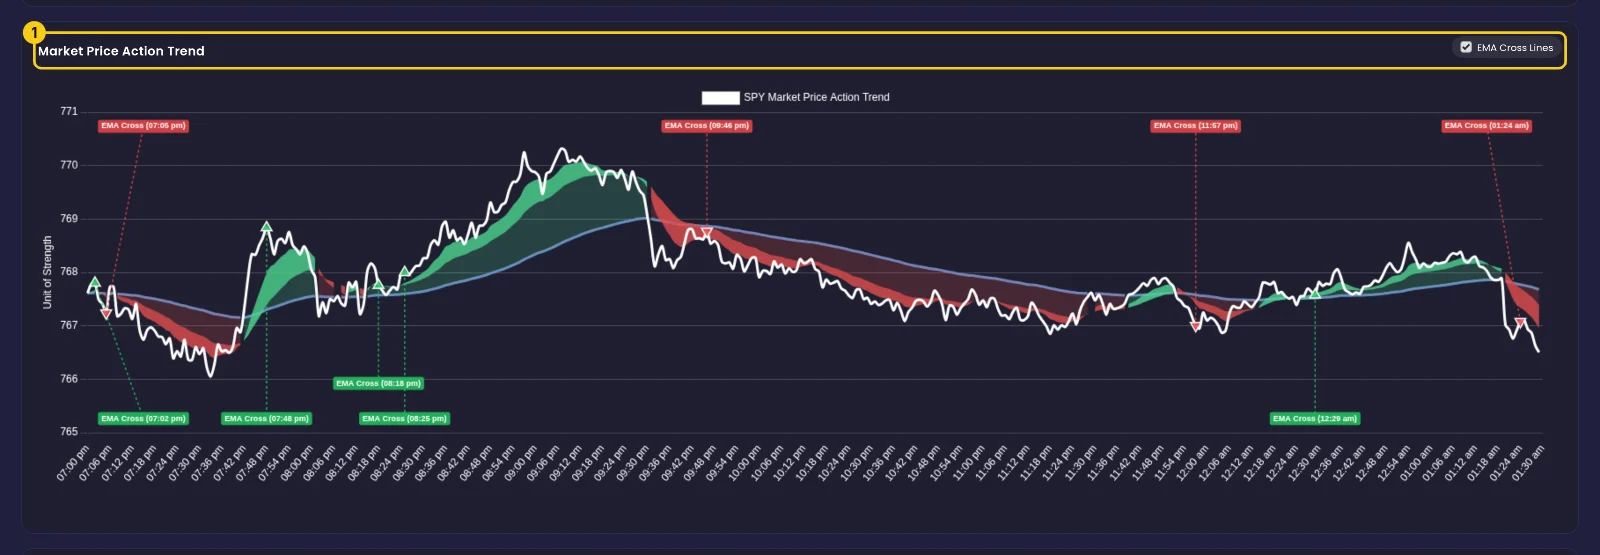
Market Price Action Trend
This panel plots price against its EMA. Price above the EMA reads as an uptrend. Price below reads as a downtrend. The EMA Cross Lines control marks the points where price crosses the EMA, so you can spot trend changes at a glance.
In the latest SPY data, price was $766.50 against an EMA of $767.68. That is below, so the trend reads bearish. The last cross came at 1:20 AM ET, when price crossed below the EMA. Before that, price had held above the EMA from 12:25 AM ET.
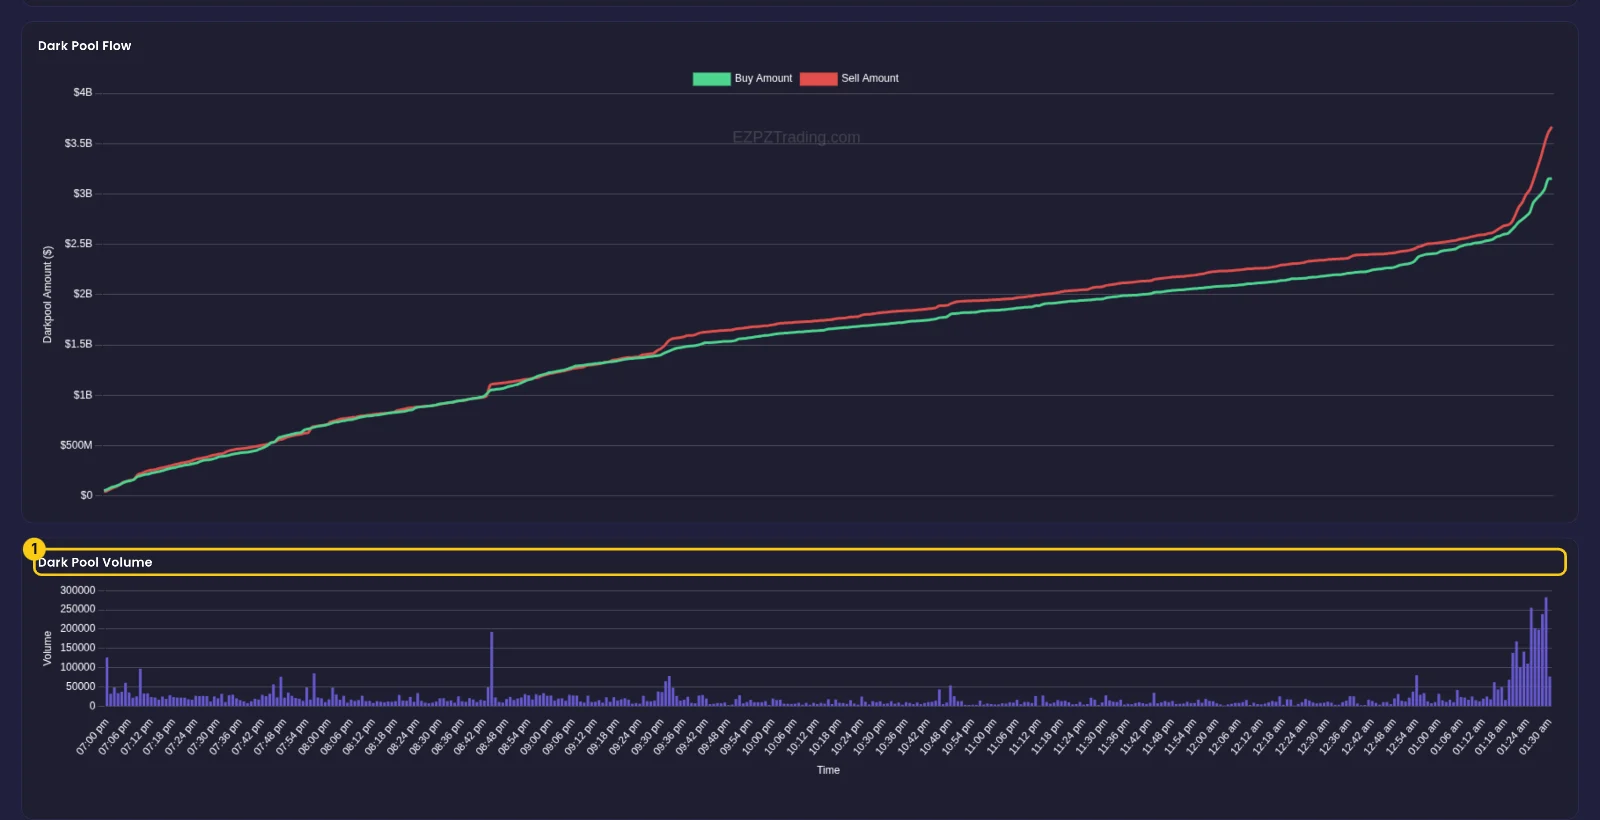
Dark Pool Flow
The bottom panel covers dark pool activity: buy dollars against sell dollars over time, plus Dark Pool Volume for each interval. When the sell line runs above the buy line, the dark pool reads sell-heavy. Tall volume bars mean busier dark pool trading.
For SPY, buy flow ended at +$3149.95M and sell flow at +$3668.18M. That reads sell-heavy. Dark pool volume for the latest interval was +$77.2K, after +$198.3K at 1:27 AM ET. Compare that with quiet stretches like +$2.2K at 11:12 PM ET. The late bars stand out as some of the busiest on the chart.
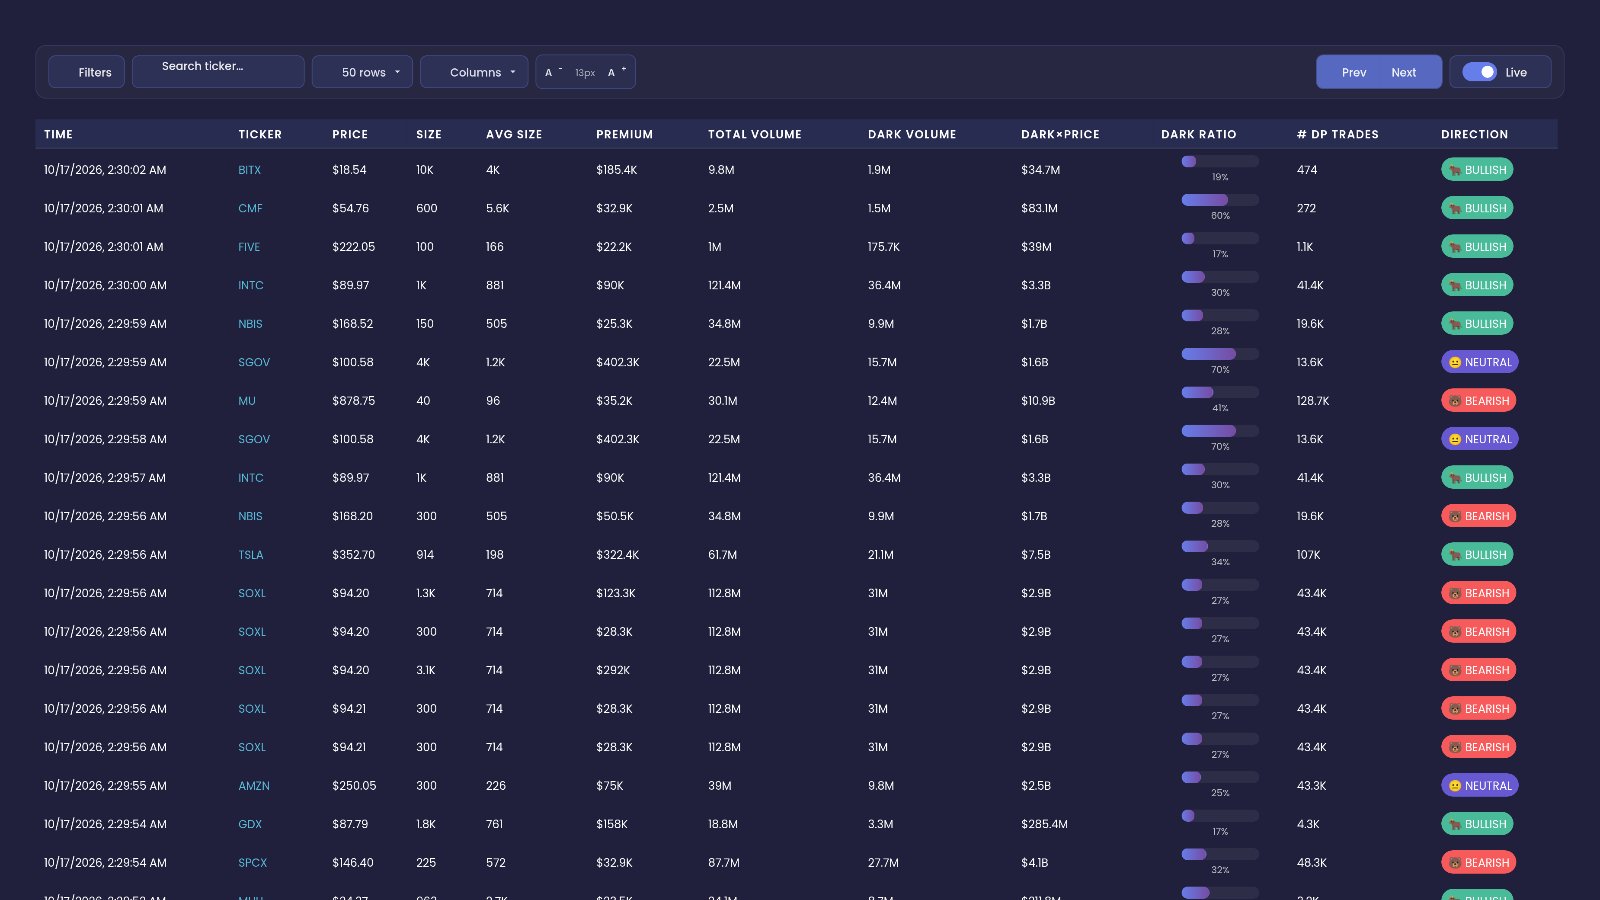
For a deeper look at single prints, see our dark pool live flow guide.
How to use the Net Flow Chart on EZPZ: a 5-minute routine
This is the exact routine, with the real screens from the latest data. The yellow numbers show where to look.
Read the premium gap first
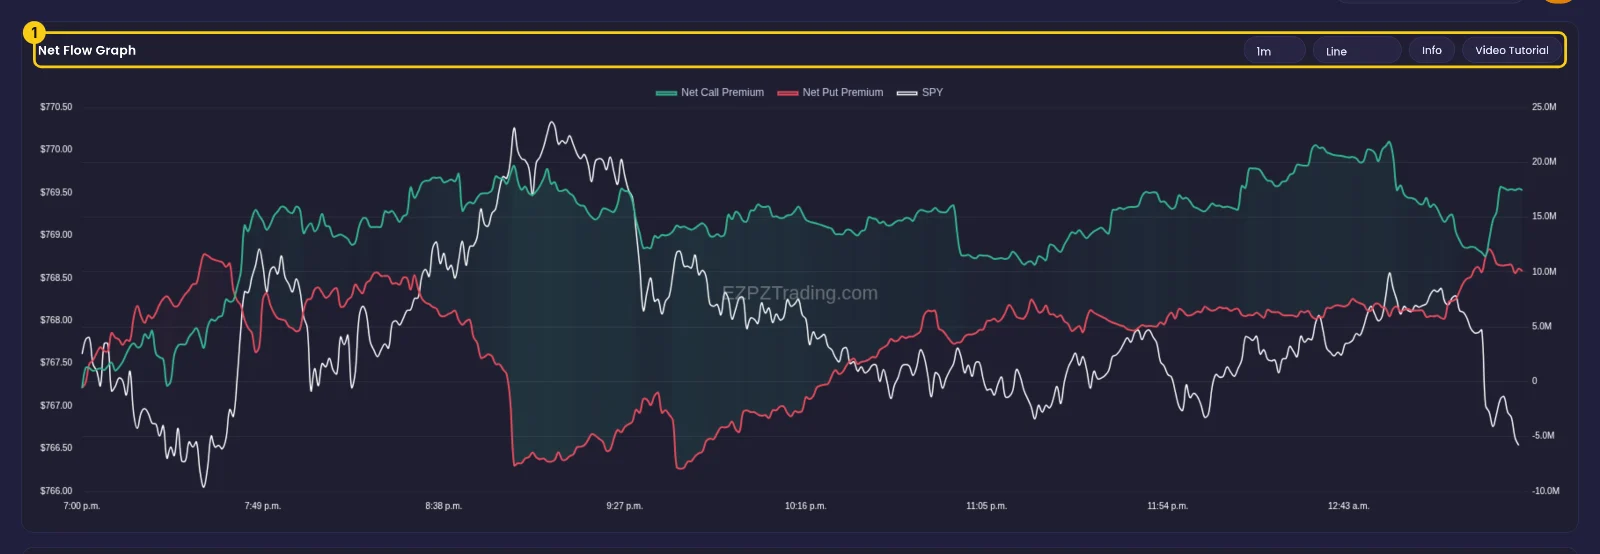
Open the Net Flow Chart and load SPY. Look at the Net Flow Graph header (1): 1m, 5m, Line, Candles, Info and Video Tutorial. Set your interval, then compare green and red. Here call flow is +$17.46M against put flow +$10.07M, a net +$7.39M lean to calls.
Check the contract count
Scroll to Net Volume. Ask one question: does it agree with premium? For SPY it reads -1,357,780,794, below zero. The count leans bearish while the dollars lean bullish.
Check who is aggressive on the tape
On Cumulative Volume Delta, find the latest point and the high. SPY peaked at 103,987 and ended at -1,779,197. Sellers led the tape into the latest reading.
Frame the trend
On Market Price Action Trend, turn on EMA Cross Lines (1). Price at $766.50 sits under the EMA at $767.68. The trend reads bearish, and the last cross was below the EMA.
Confirm with the dark pool
On Dark Pool Flow, look at Dark Pool Volume (1) and the buy and sell lines. Sell flow of +$3668.18M runs above buy flow of +$3149.95M. Late volume bars such as +$198.3K stand out against the quiet stretches.
Check again before the close
Reload the tab late in the day. Has the premium gap widened or narrowed? Has CVD turned? A change of direction in any panel matters more than one fixed number.
Reading the page in plain English
Put together, the latest SPY data reads as a split. Options dollars leaned to calls. The contract count, the tape, the price trend and the dark pool all leaned the other way. That is divergence, not confluence.
- If call flow is above put flow and every lower panel agrees, the page reads as a clean bullish lean.
- If call flow leads but CVD falls and price sits under the EMA, the page reads as mixed: options buyers and share traders disagree.
- If the premium gap narrows sharply, like the drop to +$1.54M, the page reads as a fading options lean.
- If dark pool volume spikes but options flow does not move, the page reads as dark pool activity without options confirmation.
- If put flow is above call flow and the lower panels agree, the page reads as a clean bearish lean.
What this data cannot tell you
- Direction. A bullish premium lean does not mean price goes up. In this example, price sat under its EMA while call flow led.
- Timing. The charts show what has happened so far. They do not say when a lean turns or how long it lasts.
- Intent. The tab shows dollars and contracts, not why anyone traded. A put can be a hedge, and a call can be part of a larger position.
Common mistakes
- Reading one panel alone. The net +$7.39M looked bullish until you scrolled down.
- Ignoring ticker size. Several million dollars of net flow is routine for SPY and large for a smaller name.
- Only looking at the last point. The net hit +$26.66M earlier; the path matters as much as the end.
- Treating every dark pool spike as a signal. Check whether options flow moves with it.
- Forgetting the interval. 1m and 5m can look very different; know which one you are reading.
Tools used in this post
These EZPZ tools pair well with the Net Flow Chart for a fuller read.
Which plan you need
| Tool | Plan | Free delayed page |
|---|---|---|
| Net Flow Graph | Pro | Yes |
| 0DTE Graph | Pro | Yes |
| 7-DTE Graph | Pro | Yes |
| Net Premium Heatmap | Pro | Yes |
| Expected Move | Pro | Yes |
| GEX Heatmap | Premium | None |
FAQ
What does the Net Flow Chart show?
It shows call premium, put premium and net flow for one ticker, plus net volume, CVD, price against its EMA and dark pool flow. In the latest SPY data, net flow was +$7.39M.
Why can net flow be bullish while CVD is bearish?
Options premium and share tape aggression measure different traders. For SPY, call flow led while CVD ended at -1,779,197. The page shows the split; it does not resolve it.
Should I use 1m or 5m?
Use 1m to see fast changes and 5m to cut noise. Many traders check both before reading a lean.
What does EMA Cross Lines do?
It marks where price crosses its EMA on the Market Price Action Trend panel. For SPY, the latest cross was below the EMA at 1:20 AM ET.
How is net premium worked out?
EZPZ's method is proprietary. Focus on reading the lean, the gap width and whether the panels agree.
Where can I see shorter-dated flow?
The 0DTE Graph and 7-DTE Graph focus on near-term expiries, which many traders find more useful for intraday reads.