How to read the Predictive Alpha Board: upside probability, forecast range and volatility amplification.
On November 5, 2026 the Predictive Alpha Board ranked 62 symbols. AMD sat on top with a 93.3% upside probability, NVDA showed 86.7%, and SPY was near the bottom at 13.3%. Here is how to read every part of the board.
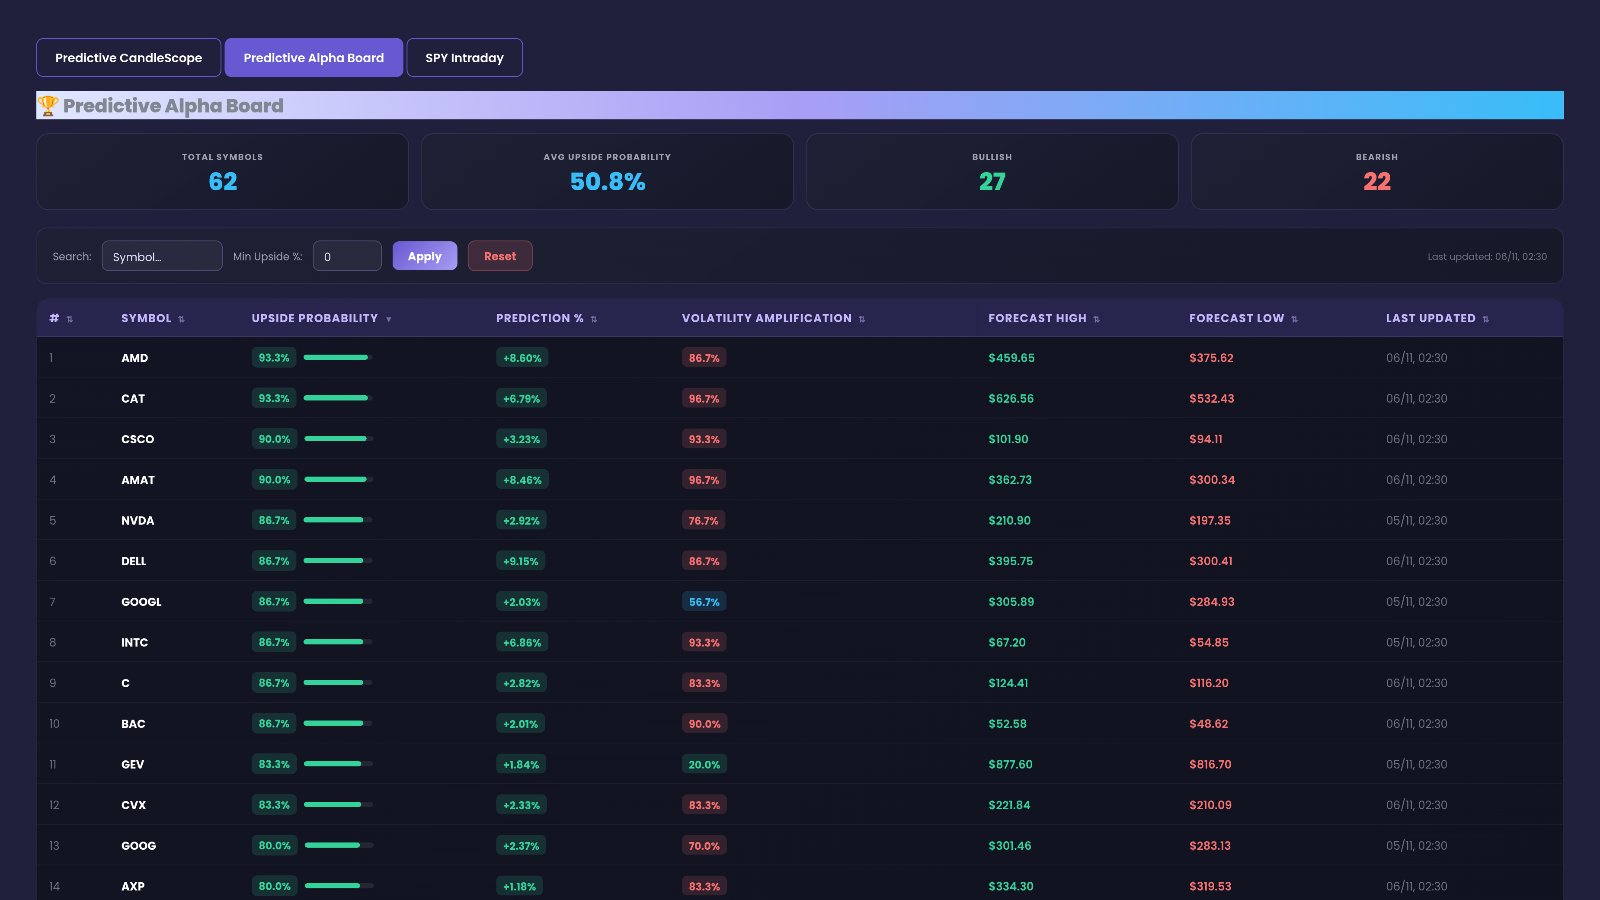
On Thursday, November 5, 2026, the Predictive Alpha Board ranked 62 symbols. AMD and CAT tied for the top spot at a 93.3% upside probability, NVDA showed 86.7%, and SPY sat near the bottom at just 13.3%. The board's average upside probability was 50.8%, so the forecast leaned bullish on some big names and bearish on others. It was not one market-wide call.
That split is the reason the board is useful. You can see in one table which large names the forecast leans up on, which it leans down on, and how wide a range it expects for each. Open the Predictive Alpha Board and follow along.
Quick definition first. The Predictive Alpha Board is a leaderboard of price forecasts, one row per symbol. Upside probability is how likely the forecast sees the stock ending the forecast window higher. Prediction % is the price change the forecast expects, with a sign. Volatility amplification shows how much more active than usual the forecast expects the stock to be. Forecast High and Forecast Low are the top and bottom of the expected price range. EZPZ's method is proprietary. This guide covers how to read the outputs.
93.3%
27
22
The idea behind the Predictive Alpha Board
Most scanners show what already happened: a gap, a range expansion, a volume spike. This board shows a forecast. It puts a lean, an expected move and an expected range next to each other for every symbol, so you can compare names fast.
Probability and size are two separate questions
Upside probability answers "how likely is up?" Prediction % answers "by how much?" They do not always line up. CSCO showed a 90.0% upside probability but a +3.23% prediction. DELL showed a lower 86.7% upside probability but a bigger +9.15% prediction. One name has a stronger lean. The other has a bigger expected move. Read both.
Volatility amplification tells you how loose the range is
Two rows can share the same upside probability and still read very differently. AMD and CAT both showed 93.3%. CAT's volatility amplification was 96.7%, higher than AMD's 86.7%. A high amplification means the forecast expects a more active stock than usual. That makes the forecast range less precise, in both directions.
Compare GEV. It showed 83.3% upside probability with a volatility amplification of only 20.0%. That is a calmer bullish read than a name with a similar lean and a high amplification.
What the board helps a swing trader see
- Breadth. The Bullish and Bearish counts show whether the forecast leans one way across the board or is split.
- Divergence between big names. NVDA at 86.7% next to SPY at 13.3% shows a strong single-stock lean against a weak index lean.
- Range context. Forecast High and Low give you a frame for how far the forecast expects price to travel.
Walking through the tab, top to bottom
The tab is one panel with three parts: the stat cards, the controls and the table. Here is each part as it appears on screen.
🏆 Predictive Alpha Board
The header row of the panel holds four stat cards. They describe whatever the table is showing right now, so they change when you filter.
- TOTAL SYMBOLS -- how many symbols the table currently lists. It read 62 with no filters on.
- AVG UPSIDE PROBABILITY -- the average upside probability of the symbols shown. It read 50.8%. That is close to the middle, which fits a split board.
- BULLISH -- how many shown symbols the board counts as bullish. It read 27.
- BEARISH -- how many shown symbols the board counts as bearish. It read 22.
Bullish and bearish together do not cover every row. The rest sit in between, closer to a coin flip. With 27 bullish against 22 bearish, the lean was mildly positive, but far from one-sided.
Search, Min Upside %, Apply, Reset and Last updated
Under the stat cards sits a control row:
- Search -- type a ticker to narrow the table to matching symbols. Useful when you only want to check NVDA or SPY.
- Min Upside % -- enter a number to show only symbols with an upside probability at or above it. This is the quickest way to list just the strongest bullish leans.
- Apply -- runs the search and the Min Upside % filter. The table and the stat cards update.
- Reset -- clears both and brings back the full board.
- Last updated -- when the board was last refreshed. It showed 06/11, 02:30.
Remember: after you filter, the four stat cards describe the filtered list, not the whole board. If you set a high Min Upside %, the average jumps and the bearish count drops. That is the filter at work, not a change in the market.
The table and its columns
The table ranks symbols by upside probability, highest first. Here is every column:
| Column | What it shows | How to read it |
|---|---|---|
| # | The row's rank in the current list | 1 is the highest upside probability shown. |
| SYMBOL | The ticker | The name the row belongs to. |
| UPSIDE PROBABILITY | How likely the forecast sees the stock ending higher | Higher means a stronger bullish lean. Low values mean a bearish lean. Values near the middle are close to a coin flip. |
| PREDICTION % | The expected price change, with a sign | A plus sign is an expected gain, a minus sign an expected drop. Bigger numbers mean a bigger expected move. |
| VOLATILITY AMPLIFICATION | How much more active than usual the forecast expects the stock to be | High values mean wider expected swings and a less precise range. Low values mean a calmer expected stock. |
| FORECAST HIGH | The top of the expected price range | The upper edge of where the forecast expects price to travel. |
| FORECAST LOW | The bottom of the expected price range | The lower edge of the same range. |
| LAST UPDATED | When that symbol's forecast was last produced | Check it. Not every row is always from the same run. |
Reading row 1 across. AMD: upside probability 93.3%, prediction +8.60%, volatility amplification 86.7%, forecast high $459.65, forecast low $375.62, last updated 06/11, 02:30. In plain English: the strongest bullish lean on the board, a large expected gain, a busy expected stock and a wide range.
Reading row 3 across. CSCO: upside probability 90.0%, prediction +3.23%, volatility amplification 93.3%, forecast high $101.90, forecast low $94.11. A strong lean, a smaller expected move than AMD, and a very high amplification. So even a modest expected move comes with a loose range.
The other end of the table. SPY showed 13.3% upside probability, a -0.29% prediction, 53.3% volatility amplification, and a range of $768.65 to $760.31. That is a bearish lean, but a small expected move and a fairly tight range. TSLA showed 16.7% with a -0.93% prediction and 50.0% amplification.
Watch the Last Updated column. In the data behind this board, some rows carried an earlier forecast date than others. NVDA, GOOGL and SPY showed an earlier date than AMD, CAT and CSCO. When you compare two names, confirm they come from the same run.
Upside probability by ticker
How to use the Predictive Alpha Board on EZPZ: a 5-minute routine
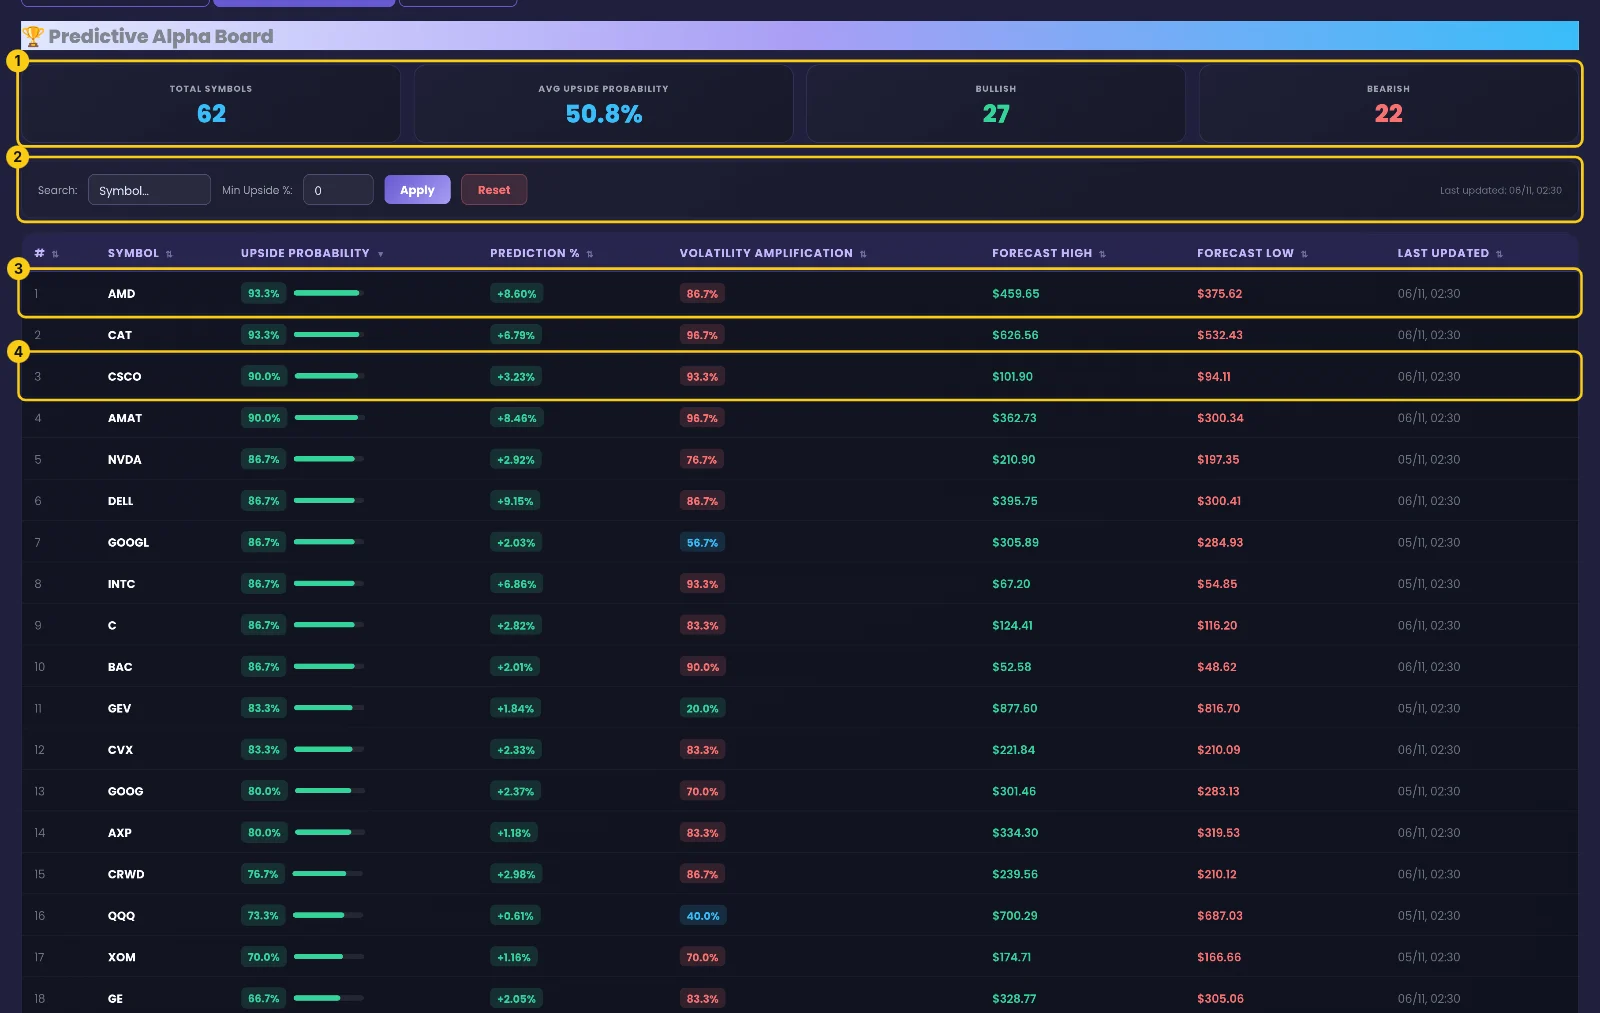
This is the exact routine, with the real screens from November 5, 2026. The yellow numbers show where to look.
Read the stat cards, then the top rows
Open the Predictive Alpha Board. Start at (1): TOTAL SYMBOLS 62, AVG UPSIDE PROBABILITY 50.8%, BULLISH 27, BEARISH 22. That is a split board with a mild bullish lean. Check (2): the Search box, Min Upside %, Apply and Reset, and Last updated 06/11, 02:30, so you know how fresh the board is. Then read (3): AMD at 93.3% upside probability, +8.60% prediction, 86.7% amplification, range $459.65 to $375.62. Compare it with (4): CSCO at 90.0%, +3.23%, 93.3% amplification, range $101.90 to $94.11. Similar lean, very different expected move.
Narrow the list with Min Upside %
Type a number in Min Upside % and press Apply. Only the stronger bullish leans stay. Watch the stat cards change with the list. Press Reset when you are done to see the full board again.
Search the names you follow
Use Search for the big names you trade. NVDA showed 86.7% with a +2.92% prediction. SPY showed 13.3% with a -0.29% prediction. Look at the Last Updated column for each before you compare them.
Cross-check with price action
The board is a forecast, so pair it with what the tape is doing. Check the Gap Up Scanner and the Historical Volatility page for the same names. For a regime read on the session, open the Intraday Market Regime Leaderboard.
Reading the page in plain English
Put the parts together. The stat cards give the overall lean. The table gives each name's lean, size and range. Volatility amplification tells you how much to trust the range.
- If upside probability is high and volatility amplification is low, like GEV at 83.3% and 20.0%, the page reads as a calm bullish lean.
- If upside probability is high and volatility amplification is also high, like CAT at 93.3% and 96.7%, the page reads as a bullish lean with wide expected swings.
- If upside probability is low but the prediction is small, like SPY at 13.3% and -0.29%, the page reads as a bearish lean with a small expected move.
- If the Bullish and Bearish counts are close and the average sits near 50.8%, the page reads as a split board, not a broad market call.
- If a large single stock leans bullish while SPY leans bearish, like NVDA at 86.7% against SPY at 13.3%, the page reads as a stock-versus-index divergence.
What this data cannot tell you
- Direction. A high upside probability is a lean, not a promise. A 93.3% reading still leaves room for the stock to fall.
- Timing. The board does not tell you when in the forecast window a move may happen, or in what order the high and low may print.
- Why. The board shows a forecast for each symbol, not the reason behind it. It does not show news, earnings or flow. Use other pages for that context.
Common mistakes
- Treating a high probability as a sure win. It is a lean. The forecast range shows how far price can travel either way.
- Ignoring volatility amplification. Two names at 93.3% can carry very different levels of uncertainty.
- Reading filtered stat cards as the whole market. After you apply Min Upside %, the cards only describe the filtered list.
- Comparing rows from different runs. Check Last Updated before you put two names side by side.
- Confusing probability with size. CSCO's 90.0% came with a +3.23% prediction, smaller than DELL's +9.15% at 86.7%.
Tools used in this post
These pages pair well with the board when you want price, volatility and regime context.
Which plan you need
| Tool | Plan | Free delayed page |
|---|---|---|
| DarkVol Leaders | Pro | Yes |
| Gap Up and Down | Pro | Yes |
| Range Change Leaders | Pro | Yes |
| Historical Volatility | Pro | Yes |
| Intraday Regime Leaderboard | Premium | None |
FAQ
What does upside probability mean on the Predictive Alpha Board?
It is how likely the forecast sees the stock ending the forecast window higher. AMD showed 93.3%, a strong bullish lean. SPY showed 13.3%, a bearish lean.
Is a high upside probability the same as a big expected move?
No. Prediction % shows the size. CSCO showed 90.0% upside probability with a +3.23% prediction, while DELL showed 86.7% with +9.15%.
What is volatility amplification?
It shows how much more active than usual the forecast expects the stock to be. High values, like CAT's 96.7%, mean wider expected swings and a less precise range.
Why do the stat cards change when I filter?
The cards describe the rows currently shown. With no filters they read 62 symbols, 50.8% average, 27 bullish and 22 bearish. A Min Upside % filter changes all four.
How is the forecast made?
EZPZ's method is proprietary. The board shows the outputs: the lean, the expected move, the amplification and the range.
Where else can I learn to read EZPZ leaderboards?
Read the guide to the intraday regime leaderboard, or browse the Learn center.