
Learn Center
Intraday Regime Leaderboard
A -100 to +100 Bullish, Neutral, or Bearish score for high-liquidity symbols, with a ticker page that shows what sits beside one symbol's score.
What is an intraday market regime score?
An intraday market regime score is a single reading from -100 to +100 that labels a symbol Bullish, Neutral, or Bearish right now. It sits beside a conviction level that says how well the underlying readings agree. Traders use it to check the day's backdrop before choosing a setup, not to pick entries.
Think of a gauge. Zero is dead center. Positive numbers lean bullish and negative numbers lean bearish. The number resolves to one of three regimes, shown in green, orange, and red. The exact cutoffs between them are not published, so read the label the page gives you instead of drawing your own line.
A score alone can mislead. Two symbols can both read Bullish and still be very different setups, because one has price action, options, and breadth all agreeing while the other has them pulling apart. That is why every row and every banner carries a Conviction chip (High, Mixed, or Conflicted) and a divergence flag. Read those first, then the number. The score describes the current session. It does not say what happens next.
On EZPZ, the same score shows up two ways. The leaderboard lists many high-liquidity symbols in one table. The ticker page opens one symbol and shows what sits behind its score. Both are Premium pages.
How the Intraday Market Regime pages work on EZPZ
Two tabs sit at the top of the page. Only one is open at a time. The page also shows a status badge on the right, such as Market Closed.
Start on the leaderboard when you want the market's mood across many names. Switch to the ticker page when you already have a name and want to know why it reads the way it does. Clicking a symbol in the leaderboard opens that symbol on the ticker page.
How this differs from other Stocks Analytics pages
This is the intraday regime page. Swing Regime Leaderboard and Investing Regime Leaderboard are separate pages for longer horizons, so open those instead when you are not looking at the current session. Technical Analysis and Top-50 Aggregate Technicals are indicator pages, not a Bullish, Neutral, or Bearish score. Predictive CandleScope is a candle-based view. Market Price Action Trend is the price trend chart. Volume Surge Trades, Top Money Flow, and Seasonal Returns each answer a different question.
Outside this category, Ticker Explorer is the one-symbol dashboard when you want quote, put to call ratio, and GEX charts instead of a regime score. Index Trader shows index lights for SPX, SPY, and QQQ. Gamma Exposure is the strike table with Call Wall and Put Wall behind the Net GEX card. Dark Pool Flow is the print-by-print view behind the Dark Pool signal. Market Dashboard is the broad market snapshot.
Leaderboard columns
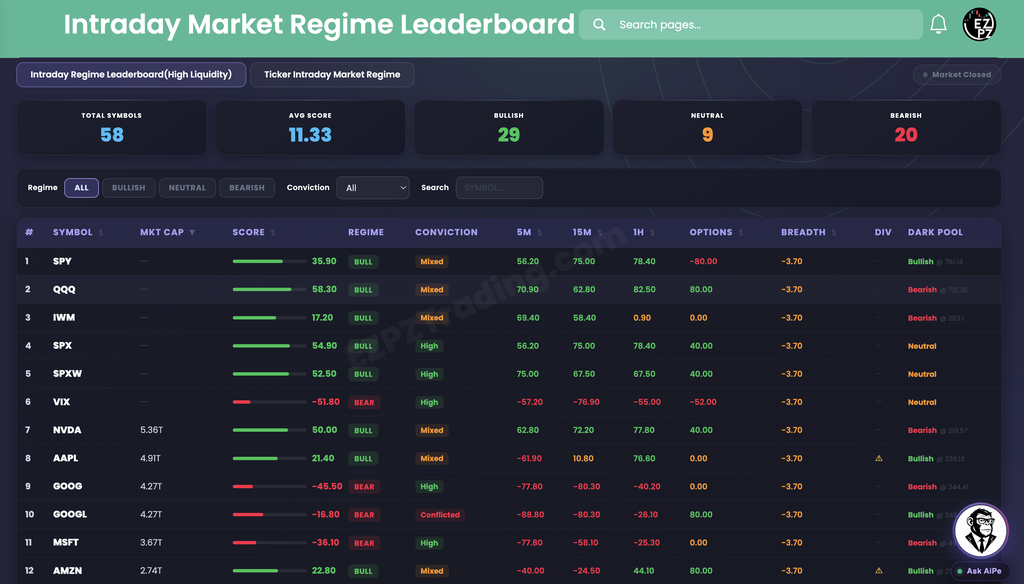
The leaderboard has five stat cards and a filter row above the table. Total Symbols, Avg Score, Bullish, Neutral, and Bearish are the quick market-wide read. In the screenshot the page shows 58 symbols, an Avg Score of 11.33, 29 Bullish, 9 Neutral, and 20 Bearish.
| Column | What you are looking at |
|---|---|
| # | Row number in the current sort. |
| Symbol | The ticker. Click it to open that symbol on the ticker page. |
| Mkt Cap | Market capitalization. The table starts sorted by this, largest first. SPY, QQQ, IWM, SPX, SPXW, and VIX have no market cap, so they show a dash and sit at the top. |
| Score | A bar and the -100 to +100 number. The bar is half full at zero. |
| Regime | BULL, NEUT, or BEAR badge. |
| Conviction | High, Mixed, or Conflicted. How well the readings behind the score agree. |
| 5M 15M 1H | Timeframe scores for that symbol, on the same -100 to +100 scale. |
| Options | An options score for that symbol, also -100 to +100. |
| Breadth | A market-wide health score. It is shared, so it reads the same on every row at a given moment. It is -3.70 on every row in the screenshot. |
| Div | A warning icon when short and long timeframes point in opposite directions. |
| Dark Pool | Bullish, Bearish, or Neutral, with a price level after it when one is available. |
The filter row has three controls. Regime has ALL, Bullish, Neutral, and Bearish. Conviction is a dropdown with All, High, Mixed, and Conflicted. Search is a Symbol box. Most column headers with a small arrow sort the table when you click them.
Reading example rows
These rows come from the screenshot above. They show why the columns to the right of Score matter.
| Symbol | Score | Conviction | 5M / 15M / 1H | Options | What stands out |
|---|---|---|---|---|---|
| SPX | 54.90 BULL | High | 56.20 / 75.00 / 78.40 | 40.00 | All three timeframes and Options lean the same way. This is the clean shape. |
| SPY | 35.90 BULL | Mixed | 56.20 / 75.00 / 78.40 | -80.00 | The timeframes are strongly positive, but the Options score is strongly negative, and the chip says Mixed. |
| AAPL | 21.40 BULL | Mixed | -61.90 / 10.80 / 76.60 | 0.00 | The 5M is negative while the 1H is strongly positive, and the Div warning icon is on. |
| GOOGL | -16.80 BEAR | Conflicted | -88.80 / -80.30 / -26.10 | 80.00 | The timeframes are negative, Options is positive, and the chip says Conflicted. |
None of these rows is a call to buy or sell. They are examples of how the same label can rest on very different agreement. A Conflicted or Mixed chip, or a Div icon, is the page telling you to be careful with the number next to it.
Ticker Intraday Market Regime tab
The second tab opens one symbol. It starts on SPY. Type another symbol in the box at the right and click Analyze. The symbol also goes into the page address, so a refresh keeps it.

| Piece | What you are looking at |
|---|---|
| Symbol and price | The symbol you loaded and its last price, such as SPY $761.47. |
| Regime banner | The BULLISH, NEUTRAL, or BEARISH label, a short line under it (23.7% Bullish in the screenshot), an action line (Look for LONG entries), a Conviction chip, and the big score number (35.90). |
| Timeframe Divergence | A warning tag beside the Conviction chip when short and long timeframes disagree. It only shows when that is the case. |
| Daily Average | Today's average score so far. It reads -16 in the screenshot. |
| Previous day Previous week | The prior day's and prior week's average score. They read +43 and -27 in the screenshot. |
| Regime Score gauge | A track from BEARISH (-100) through NEUTRAL (0) to BULLISH (+100), with a needle at the current score. |
Compare the banner to the three average cards. In the screenshot SPY reads +35.90 now, while its Daily Average is -16, so the morning was weaker than the current reading. That is a shift in the day, not a promise that the shift continues.
Score history and timeframe scores
Under the banner, the page draws today's score as a line through the session, then shows the three timeframe cards.

Chart
- The white line is the regime score through the session, with the time axis in your local time.
- Dots use the regime colors from the legend: green Bullish, orange Neutral, red Bearish.
- Short EMA, Long EMA, and Extra EMA draw a ribbon around the line. It is green when the score is above the Extra EMA and red when it is below.
- The dashed orange line is the Daily Average. It matches the Daily Average card.
- Two buttons, Daily Avg: ON and EMA: ON, switch the dashed line and the ribbon. A pill shows how many snapshots the chart holds.
Timeframe Scores
- Three cards: 5-Minute, 15-Minute, and 1-Hour.
- Each shows a score and a tag, such as BULL. In the screenshot they read 56.20, 75.00, and 78.40.
- When they point different ways, the Timeframe Divergence tag can appear on the banner.
Use the chart to see how long a regime held, not just where it is now. A score that crossed above the ribbon an hour ago is a steadier read than one that just flipped. The EMA lengths are not published.
Options Flow, Dark Pool, Market Breadth, and Session Levels
The lower part of the page shows the readings that sit beside the score. Its header carries the note "Algo is only available to admins", so the panels below are the ones you see as a member.

| Card | What you are looking at |
|---|---|
| Flow Signal | An overall options read for the symbol, Bearish in the screenshot. The card names its inputs: Net GEX, DEX, Net Flow, and 0DTE Flow. |
| Net GEX | Net gamma exposure with a Positive or Negative note, the symbol, and an expiry date. It reads -$5.00B and Negative in the screenshot. Negative gamma tends to mean dealer hedging can amplify price moves. |
| Net Flow | Call premium (C) and put premium (P) with a short read. It shows C -$14.16M, P +$28.27M, and Put buying in the screenshot. |
| Card | What you are looking at |
|---|---|
| Signal | Bullish, Bearish, or Neutral dark pool positioning. Bullish in the screenshot. |
| Major DP Level | A price level where dark pool activity clusters. It reads $761.14 and is marked display only, so it is not part of the score. |
| Bull / Bear Premium | Bullish and bearish dollars for the day in millions. It reads $3879.69M and $3765.07M in the screenshot. |
| Card | What you are looking at |
|---|---|
| Mega-Cap VWAP | How many of the Mag 7 are above their VWAP. It reads 3/7. |
| VIX | The VIX level with a direction word. It reads 15.58 and Subsiding. |
| Sector Participation | How many of the 11 SPDR sectors are above their VWAP. It reads 3/11. |
| Card | What you are looking at |
|---|---|
| Prev Day | PDH (previous day high), PDL (previous day low), and PDC (previous day close). |
| Opening Range | ORH and ORL, the high and low of the opening range. |
| Pre-Market | PMH and PML, the pre-market high and low. |
| Breadth, Options Flow, Dark Pool | Short recaps of the panels above them: the Mega-Cap and Sector counts with the VIX, then Bearish for Options Flow and Bullish for Dark Pool in the screenshot. |
Each level is green when price is above it and red when price is below it. With SPY at $761.47, PDL $759.96 and ORL $760.59 are green, while PDH $763.57 and PMH $764.16 are red.
In the screenshot the panels are mixed. The banner says Bullish and Dark Pool says Bullish, while Flow Signal says Bearish, Net Flow says Put buying, and the breadth counts are 3/7 and 3/11. That is the reason the Conviction chip says Mixed. The panels are context for the score, so check them before you lean on it.
How people actually use it
Check the day's backdrop
Open the leaderboard first. Read Avg Score and the Bullish, Neutral, and Bearish cards before you look at any single row.
Filter for cleaner reads
Set Conviction to High and pick a Regime tab. Rows with a Div icon or a Conflicted chip are the ones to double-check first.
Open a name and compare
Click a symbol. Compare the banner to the Daily Average, Previous day, and Previous week cards, then scan the score history to see how long the regime held.
Check the panels last
Look at Options Flow, Dark Pool, Market Breadth, and Session Levels for context. Use Ticker Explorer or Gamma Exposure if you want more on one symbol.