How to read the intraday regime leaderboard: stat cards, conviction and divergence flags (real 57-symbol example)
In the latest session the leaderboard tracked 57 symbols with an average score of 10.72: 24 bullish, 23 neutral, 10 bearish. Here's how to read the whole board, find the clean High-conviction names and spot the ⚠ flags.
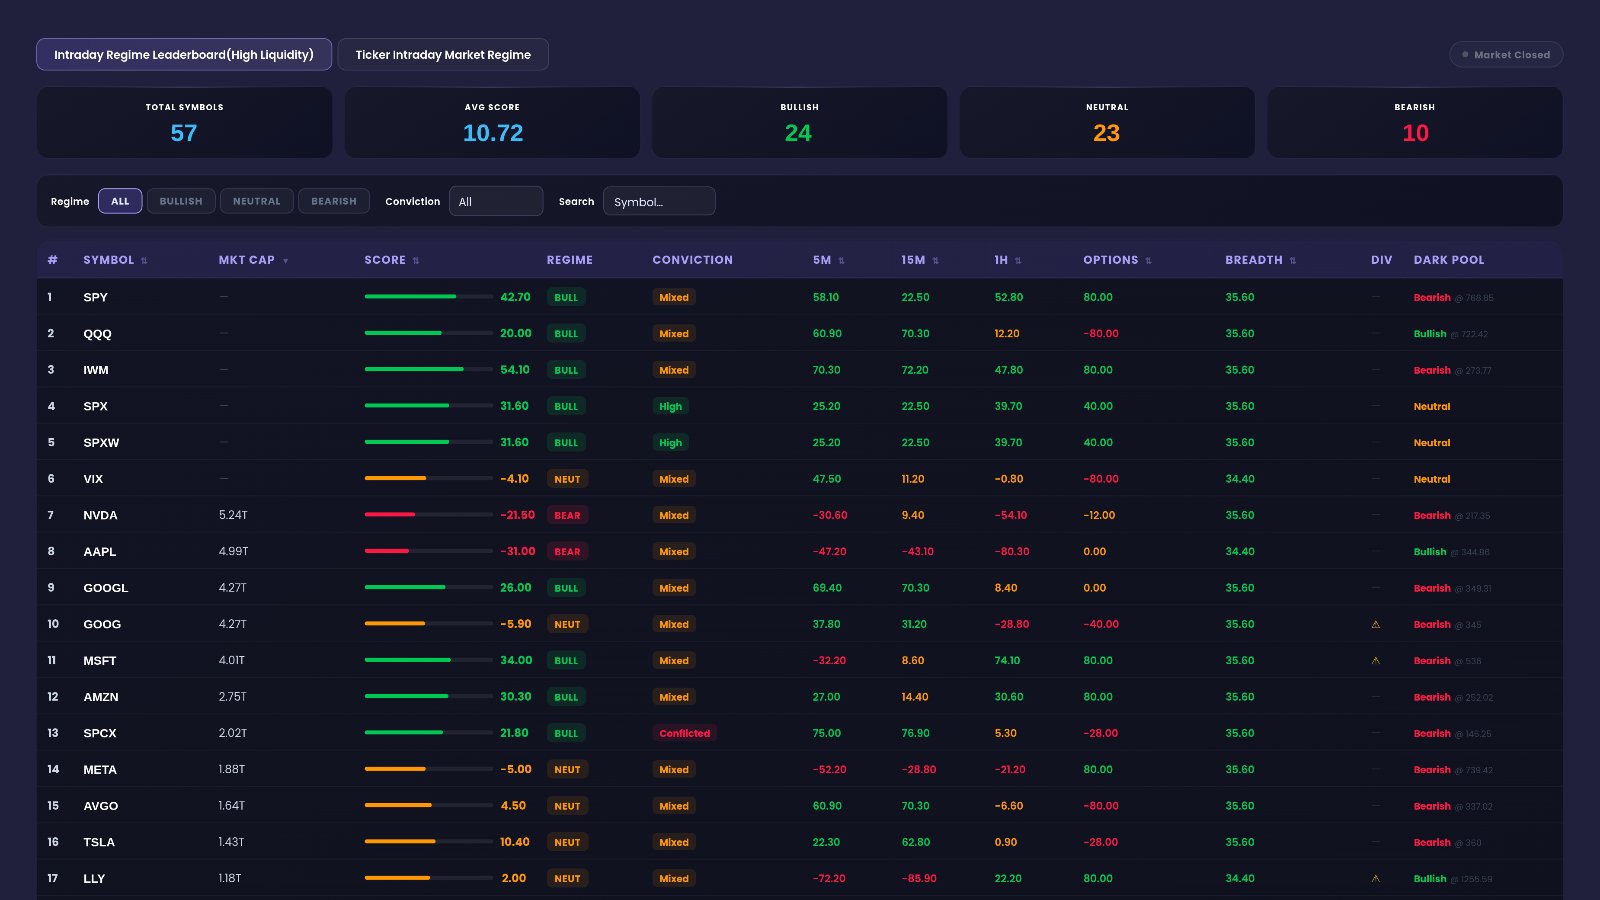
In the latest session the Intraday Market Regime Leaderboard tracked 57 symbols. The average score was 10.72, with 24 names bullish, 23 neutral and only 10 bearish. SPY sat at +42.7 BULL, but its dark pool read was Bearish@768.85. So the board leaned positive without being one-sided, and that's exactly the kind of picture this page is built to show.
Quick definition first. The Intraday Regime Leaderboard puts a regime score on many liquid symbols at once, on a −100 to +100 scale. Score is the overall reading: 0 is neutral, +100 is maximum bullish pressure, −100 is maximum bearish. Regime is the badge: BULL, NEUT or BEAR. Conviction tells you how well the underlying signals agree: High, Mixed or Conflicted. Div shows a ⚠ when the short and long timeframes point in opposite directions. Dark Pool shows whether institutional positioning reads Bullish, Neutral or Bearish around a level.
Why a whole leaderboard beats checking one ticker
A single regime score tells you about one symbol. If you want to see how one ticker's score is put together, read our walkthrough on how to read the intraday market regime score. This post is about something else: reading the whole board at once and getting a feel for the market from it.
The market is more than SPY
SPY at +42.7 looks strong by itself. The board shows more than that. NVDA was −21.5 BEAR and AAPL was −31.0 BEAR. Meanwhile HD (+74.1) and GE (+58.0) were strongly bullish. A bullish index can hide plenty of weak heavyweights. The leaderboard puts both sides on one screen.
Row order is not a signal
By default the list is sorted by market cap, with the index products (SPY, QQQ, IWM, SPX, SPXW, VIX) pinned at the top. That's on purpose. If the list were sorted by score, the top rows would always be the names that happen to be winning, and they would bias your read. So don't judge the market by the first ten rows. Judge it by the summary counts.
What the board helps you answer
- Is the market broadly bullish, mixed or weak right now?
- Which names give a clean reading, and which ones are noisy?
- Where do the timeframes disagree with each other?
- Does dark pool positioning agree with the regime?
The key things the leaderboard shows
The summary: counts and average score
The summary is your starting point. In the latest session: 57 symbols, Avg Score 10.72, BULLISH 24, NEUTRAL 23, BEARISH 10. Bullish names outnumbered bearish ones more than two to one. But almost as many names were neutral as bullish, and that's why the average stayed modest at 10.72 instead of high.
Score and Regime
The score bar fills left to right, and a half-filled bar means 0. The strongest bullish scores were HD +74.1, GE +58.0, IWM +54.1, MU +53.3 and GS +50.2. The weakest were MRK −48.4, BAC −45.1, PM −43.4, KO −38.9 and ABBV −35.2. The exact point where one regime becomes another is part of EZPZ's method, and EZPZ's method is proprietary.
Conviction
Most rows read Mixed. The High-conviction rows were SPX and SPXW (+31.6), MU (+53.3), GE (+58.0), HD (+74.1) on the bullish side, and KO (−38.9), BAC (−45.1), MRK (−48.4), PM (−43.4) on the bearish side. Two names read Conflicted: SPCX (+21.8) and MS (+21.7). Both carried a BULL badge, but their signals were divided.
The 5m, 15m and 1h columns
These show each symbol's own timeframe readings on the same −100 to +100 scale. GS lined up nicely: +80.3, +76.9, +74.1. V was the opposite: 5m −88.8, 15m −56.2, 1h +43.1. That's the short term and the longer term pulling against each other.
Options and Breadth
Options is a per-symbol reading. SPY and IWM showed +80.0, while QQQ showed −80.0. Breadth is a market-wide reading, so it looks almost the same on every row: +35.6 or +34.4. Since it barely changes from row to row, Breadth tells you about the backdrop, not about any one stock.
Div flag and Dark Pool
The ⚠ flag appeared on 12 rows, including GOOG, MSFT, LLY, V, MA, NFLX and DELL. The Dark Pool column often disagreed with the regime. IWM was +54.1 BULL with Bearish@273.77. COST was −30.9 BEAR with Bullish@1003. If you want more institutional context, the DarkVol Leaders page is a good place to look next.
How to use the Intraday Regime Leaderboard on EZPZ: a 5-minute routine
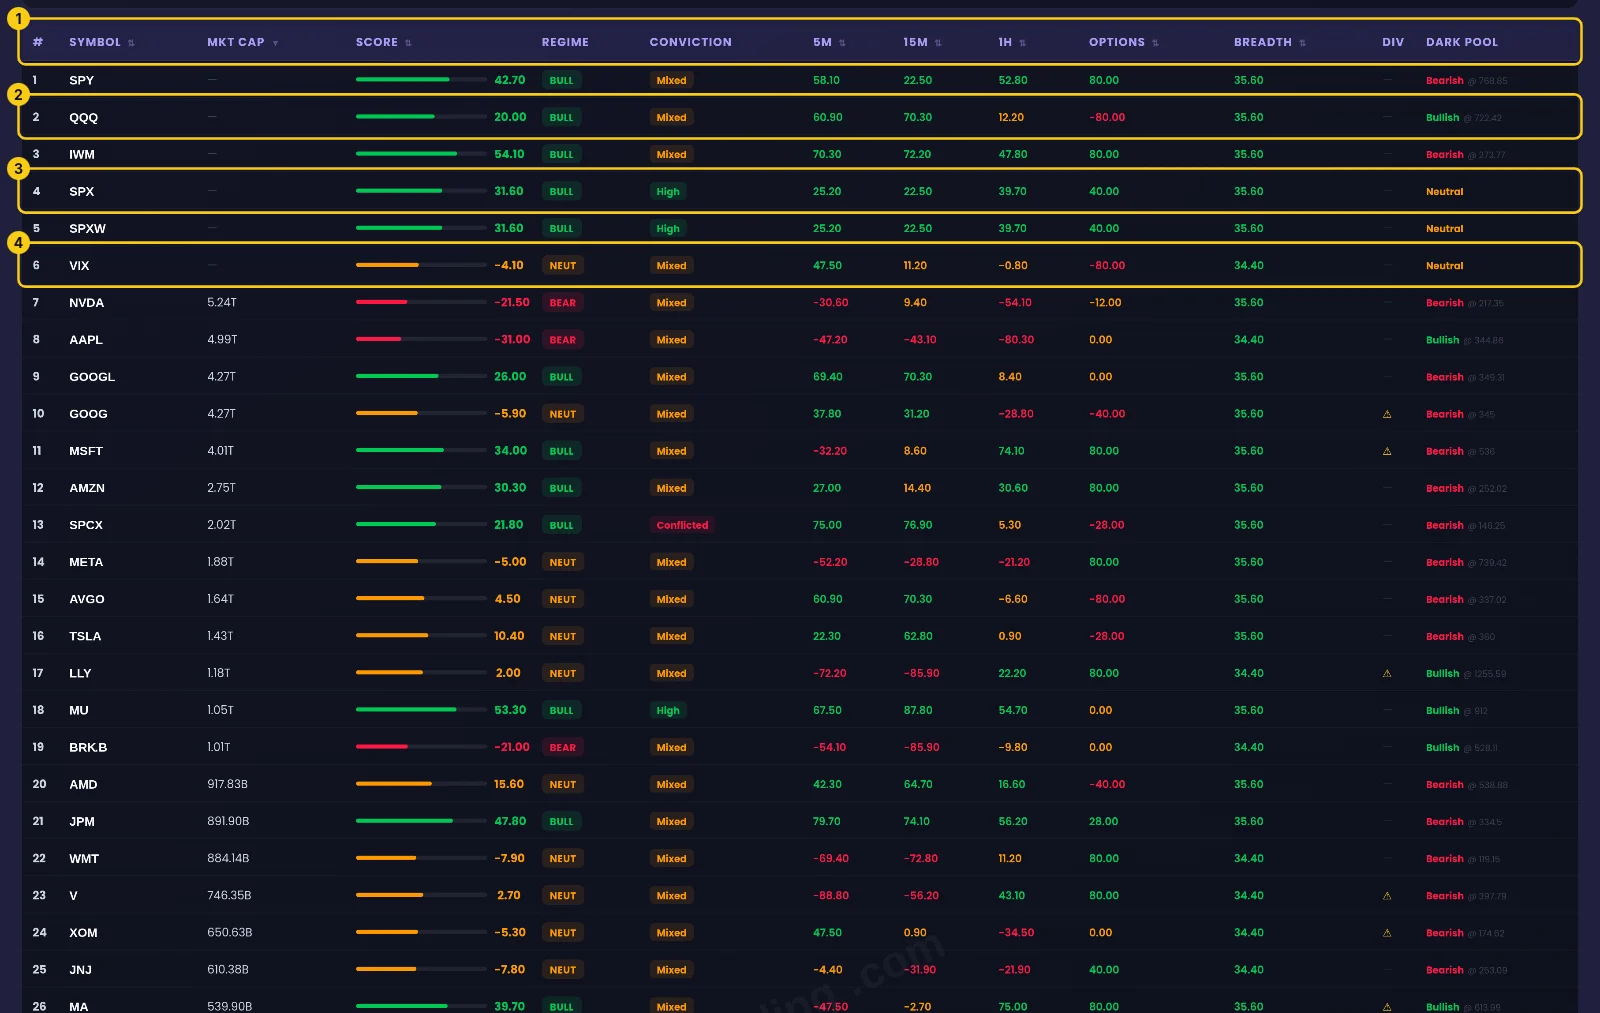
This is the exact routine, with the real screens from the latest session. The yellow numbers show where to look.
Read the header and the index rows
Open the leaderboard and learn the header row (1): # SYMBOL MKT CAP SCORE REGIME CONVICTION 5M 15M 1H OPTIONS BREADTH DIV DARK POOL. Then look at QQQ (2): score 20.00 BULL with Mixed conviction. Its 5m (60.90) and 15m (70.30) are strong, but its 1h is only 12.20 and its options read is −80.00, so this bullish badge has some friction behind it. SPX (3) reads 31.60 BULL with High conviction, and every column there is positive. VIX (4) reads −4.10 NEUT with a Neutral dark pool, so the volatility gauge isn't sending a strong message either way.
Filter for the clean reads
Check the summary first (24 bullish, 23 neutral, 10 bearish, Avg Score 10.72). Then set the Conviction dropdown to High. The list narrows to names like HD +74.1, GE +58.0 and MU +53.3 on the bullish side and MRK −48.4, BAC −45.1 and PM −43.4 on the bearish side, all without a ⚠ flag. Click any row to open that symbol's detail page.
Check again before the close
Regimes move during the day. Come back late in the session and compare the counts and the Avg Score with your earlier read. If a name you were watching picked up a ⚠ flag or slipped to Conflicted, its reading has become less clean.
Reading this session in plain English
Put it together and the board leaned bullish, but not strongly. Bullish names outnumbered bearish ones, the index products all read BULL, and Breadth sat at +35.6 on most rows. Below the surface, NVDA, AAPL and BRK.B read BEAR, and many dark pool reads were Bearish even on bullish rows.
- If the bullish count stays well above the bearish count and the Avg Score stays positive, the page reads as a broadly healthy tape.
- If a name shows High conviction and no ⚠, like HD at +74.1, the page reads it as a clean, aligned signal.
- If a name shows BULL with a ⚠, like MSFT at +34.0, the page reads it as bullish on balance but split across timeframes.
- If the regime and the dark pool disagree, like SPY at +42.7 with Bearish@768.85, the page reads it as price strength without institutional agreement at that level.
- If the neutral count grows toward the bullish count, the page reads it as the market losing direction.
Common mistakes
- Reading the top rows as "the market". The list is sorted by market cap, so row position carries no bullish or bearish signal.
- Ignoring the ⚠ flag. A BULL badge with a divergence flag, like MA at +39.7, is less clean than the number suggests.
- Treating Conflicted like High. SPCX and MS both read BULL, but their signals were divided.
- Judging stocks by Breadth. Breadth is nearly the same on every row, so it describes the backdrop, not the stock.
- Skipping the Dark Pool column. Bullish rows like IWM and JPM still showed Bearish dark pool reads.
Tools used in this post
These EZPZ pages help you read the leaderboard and add context around it.
Which plan you need
| Tool | Plan | Free delayed page |
|---|---|---|
| Intraday Regime Leaderboard | Premium | None |
| DarkVol Leaders | Pro | Yes |
| Gap Up and Down | Pro | Yes |
| Range Change Leaders | Pro | Yes |
| Historical Volatility | Pro | Yes |
FAQ
Why is the leaderboard sorted by market cap and not by score?
Sorting by score would always put whichever regime is winning at the top and skew your read. Market cap order keeps the list neutral, so you form your bias from the summary counts.
What does Avg Score 10.72 mean?
It's the average across all 57 tracked symbols. A modest positive average, with 24 bullish and 23 neutral names, describes a board that leans bullish without being one-sided.
Why do Breadth values look the same on every row?
Breadth is a market-wide reading, so it barely changes from row to row (+35.6 or +34.4 in this snapshot). The 5m, 15m and 1h columns are the symbol-specific ones.
How is the score calculated?
EZPZ's method is proprietary. The page is designed to be read through its columns: score, regime, conviction, timeframes, the ⚠ flag and dark pool.
Which rows give the cleanest reads?
High conviction with no ⚠ flag. In this session that included HD, GE and MU on the bullish side, and MRK, BAC, PM and KO on the bearish side.