
Learn Center
Gap Up and Down
Two tabs that rank stocks by the opening gap from the prior close, the biggest gap ups on one and the biggest gap downs on the other.
How do you read gap up and gap down stocks?
A gap is the jump between a stock's prior close and its next open, with no trading in between. A gap up opens above the prior close and a gap down opens below it. Gaps usually follow news that lands after the close or before the open, so the size of the gap shows how far the price repriced overnight.
The gap itself is only the opening move. What matters next is what the stock did after it opened. A gap that keeps extending has follow-through. A gap that slips back toward the prior close is fading, and one that flips through the prior close has reversed. Volume tells you whether enough traded to trust the move, and the share that printed off exchange adds context. Small, thin stocks can gap by huge percentages on very little money, so most screens filter on price and volume first. None of it says what comes next. On EZPZ, Gap Up and Gap Down are two tabs of one table layout, sorted by Gap % in opposite directions. Start with Market Dashboard if you want the whole tape before you pick names.
How Gap Up and Gap Down works on EZPZ
Two tabs sit above the table. Gap Up sorts Gap % from highest to lowest, so the biggest upward gap is first. Gap Down sorts it the other way, so the biggest downward gap is first. The active tab is highlighted, and the columns do not change.
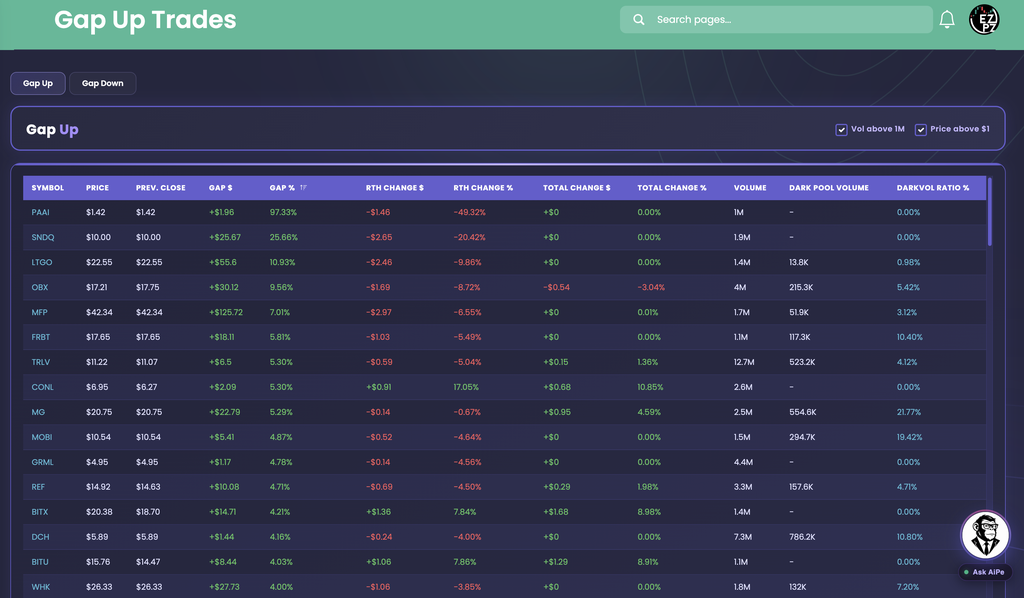
Compare Gap % with Total Change % to see what happened after the open. BITX prints a 4.21% Gap % from a $18.70 Prev. Close and a Total Change % of 8.98% at $20.38, so the gap extended during the session. It has 1.4M Volume. CONL prints a 5.30% Gap % from $6.27 and a Total Change % of 10.85% at $6.95 on 2.6M Volume, the same pattern.
The Gap Down tab
Gap Down uses the same columns with the sort reversed, so the most negative Gap % is first. Gap % prints in red, and a stock that has recovered shows it in Total Change %.

The screenshot shows both outcomes. KORU prints a -3.65% Gap % from a $20.04 Prev. Close, yet its Total Change % is +7.58% at $21.56, so the gap fully reversed and the stock is now above the prior close. MSTZ prints a -5.98% Gap % from $2.81 and a Total Change % of -15.28% at $2.38 on 4.2M Volume, so the gap extended lower.
How Gap Up and Down differs from the rest of stocks-data
This page ranks by the opening gap alone. Top Gainers and Losers ranks by the total percent move from the prior close, gap included. Volume Leaderboard ranks by how much traded against normal. Market Dashboard is the one-screen overview of indices, breadth, and Market Direction lights. Extended Hours Leaders covers pre market and after hours moves. Range Change Leaders ranks the move from today's open to now. Use this page when the question is who opened far from yesterday's close. For one name after you have picked it, Ticker Explorer is the one-symbol dashboard.
Filters
Two checkboxes in the header card control what the table includes. Both are on by default.
- Vol above 1M: keeps only stocks that have traded more than 1M shares today.
- Price above $1: drops sub-dollar stocks.
Uncheck either one to widen the list. Expect more thin names and bigger gaps when you do, because a small amount of money can move a cheap or quiet stock a long way.
Reading the columns
Read a row left to right: where it closed and where it trades, how big the gap was, what happened after the open, then how much traded.
| Column | What you are looking at |
|---|---|
| Symbol Price | The ticker and its last price. |
| Prev. Close | The prior session close. This is the baseline the gap is measured from. |
| Gap % | The jump from Prev. Close to today's open, in percent. This is the sort column, and an arrow in the header shows the direction. Green is a gap up, red is a gap down. |
| Gap $ | The same jump shown in dollars. Read Gap % to compare stocks at different prices. |
| Column | What you are looking at |
|---|---|
| RTH Change $ RTH Change % | The change during regular trading hours, dollars and percent. |
| Total Change $ Total Change % | The change from Prev. Close, including the gap. |
| Column | What you are looking at |
|---|---|
| Volume | Shares traded today. |
| Dark Pool Volume | Shares that traded on dark, off-exchange venues. A dash means none. |
| DarkVol Ratio % | Dark Pool Volume as a percent of total Volume. Higher means more of the day traded off the public order book. |
How people actually use it
Find the gappers
Start at the top of each tab. The biggest gaps up and down are the names that repriced most overnight.
Check what happened next
Put Gap % beside Total Change %. Extending, fading, and reversing gaps tell very different stories about the same open.
Weigh the volume
A big gap on heavy Volume has more participation behind it than the same gap on a thin tape. Keep Vol above 1M on when you want liquid names.
Pick a name to research
Treat the list as a starting point. Open the chart and the news for the reason behind the gap, or check Volume Leaderboard to see whether the volume is unusual for that stock.