How to read the swing regime score: timeframes, category scores and entry quality.
On November 2, 2026, SPY's swing score sat at -20.7, a Bearish Watch reading with Entry Quality 0/100 and all three timeframes labeled Bear. Here is how to read every panel of the Ticker Swing Market Regime page.

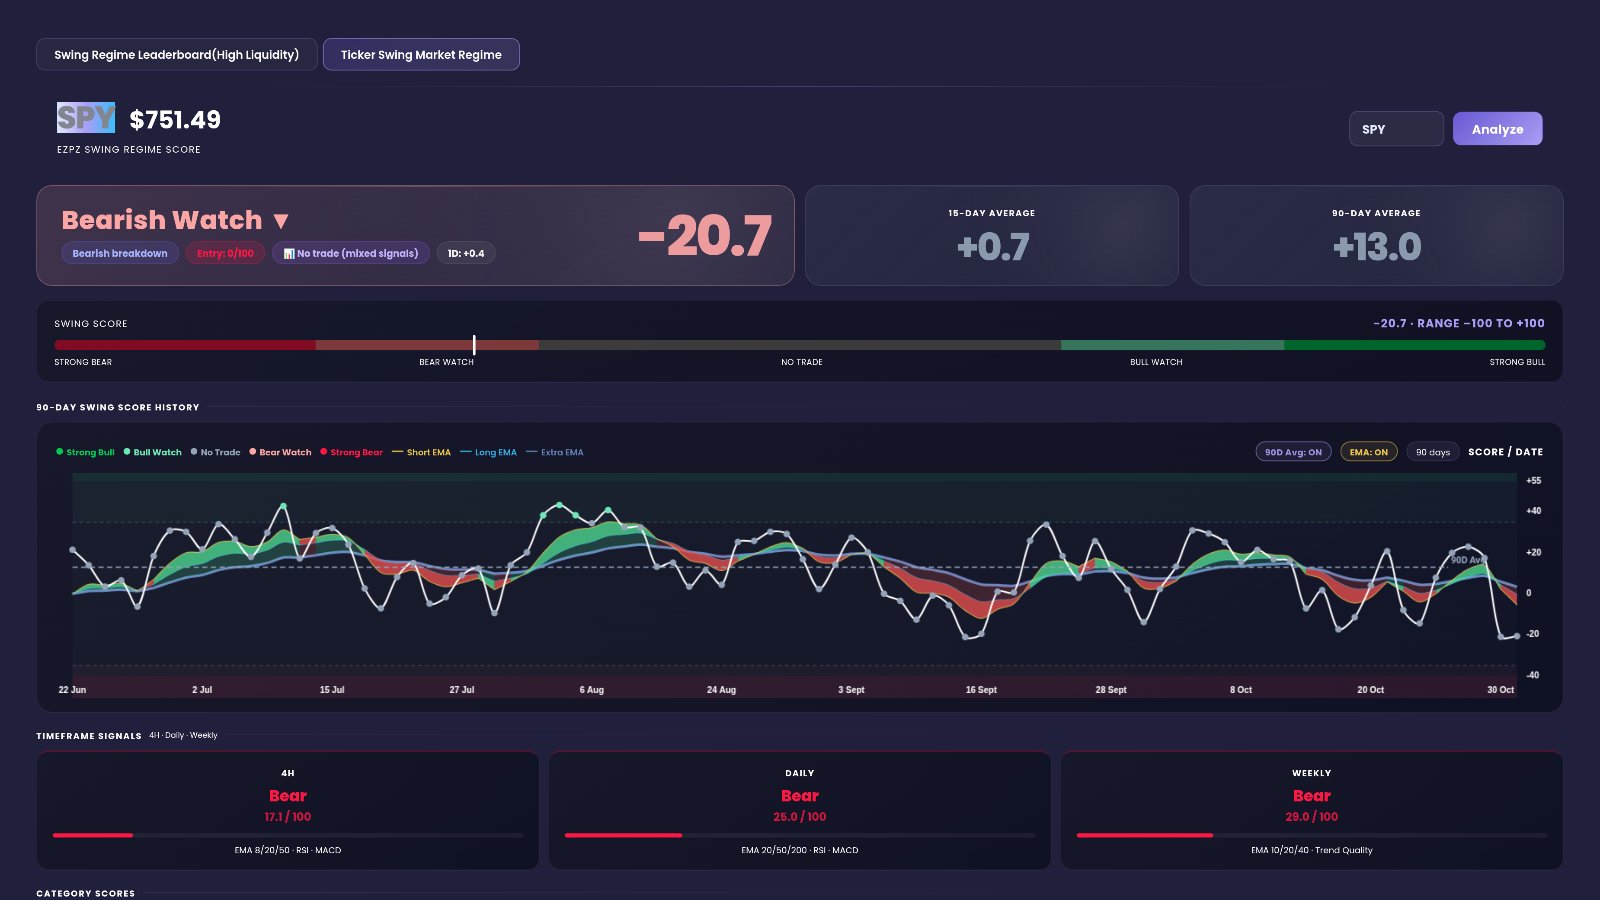
At 4:01 PM ET on Monday, November 2, 2026, SPY's swing score read -20.7. The banner said Bearish Watch, the setup was a "Bearish breakdown", and the 1-week change was -28.5. Even so, Entry Quality sat at 0/100 and the strategy line read "No trade (mixed signals)". That mix of a falling score and no clean signal is exactly what the Ticker Swing Market Regime page is built to show you.
Quick definition first. The swing score is one number from -100 to +100. It sums up how a ticker's swing setup looks over a horizon of several days to a few weeks. Positive means the setup leans bullish. Negative means it leans bearish. Near zero means there's no clear edge. The regime is the label for where the score sits: Strong Bull, Bull Watch, No Trade, Bear Watch or Strong Bear. Setup Type names the pattern behind the score. Entry Quality is a separate 0–100 timing reading. It tells you whether right now is a clean moment to act, apart from direction. Think of the whole page as a gauge of setup quality, not a price forecast.
-20.7
-28.5
0/100
What the swing regime page helps you see
Most charts show you price. This page shows you the quality of the setup around the price. It puts trend, momentum, options activity, volume and the market backdrop on one screen. Then it boils them down into a single score and a label.
Direction and timing are two different questions
The swing score answers "which way does the setup lean?" Entry Quality answers "is now a clean moment?" They can disagree. On November 2, SPY leaned bearish at -20.7, yet Entry Quality was 0/100. That reads as a setup that is forming, not one that is ready.
The trend of the score matters as much as the score
A single reading is a photo. The period averages and the 90-day chart turn it into a film. SPY's 15-day average was +0.7 and its 90-day average was +13.0. The current -20.7 sits well below both. That reads as recent deterioration, not a long-standing bearish trend.
Agreement builds conviction
The page splits the picture so you can check where pieces agree:
- Timeframes: do 4H, Daily and Weekly point the same way?
- Categories: are Momentum and Trend on the same side?
- Backdrop: does the broad market support the read?
When most of these line up, the score is cleaner. When they split, as several did for SPY here, the page tells you so.
Walking through the tab, top to bottom
Open the Ticker Swing Market Regime page and look up a ticker. Here is every panel, in the order you see it, with SPY from November 2, 2026.
Bearish Watch ▼
This is the regime banner. Its title changes with the regime, so for SPY it read "Bearish Watch ▼". It carries the headline read:
- Score: -20.7, the big number.
- Setup type tag: "Bearish breakdown", the pattern behind the score.
- Entry chip: "Entry: 0/100", the timing reading.
- Strategy line: "📊 No trade (mixed signals)".
- 1D: +0.4, the change in the score since the prior day.
Read it left to right. The label gives direction. The setup tag says what kind of move the score is describing. The entry chip and strategy line tell you if the picture is clean enough to act on. For SPY, a bearish lean met a "no trade" verdict. The small +0.4 day change says the score barely moved from the prior session.
15-DAY AVERAGE and 90-DAY AVERAGE
Two cards sit beside the banner. The 15-DAY AVERAGE was +0.7. The 90-DAY AVERAGE was +13.0. Both are colored by their regime zone. Compare them with the live score. A score far below both averages reads as a recent slide. A score far above both reads as a recent improvement. SPY's -20.7 was below both, so the short-term picture had turned weaker than its usual baseline.
90-DAY SWING SCORE HISTORY
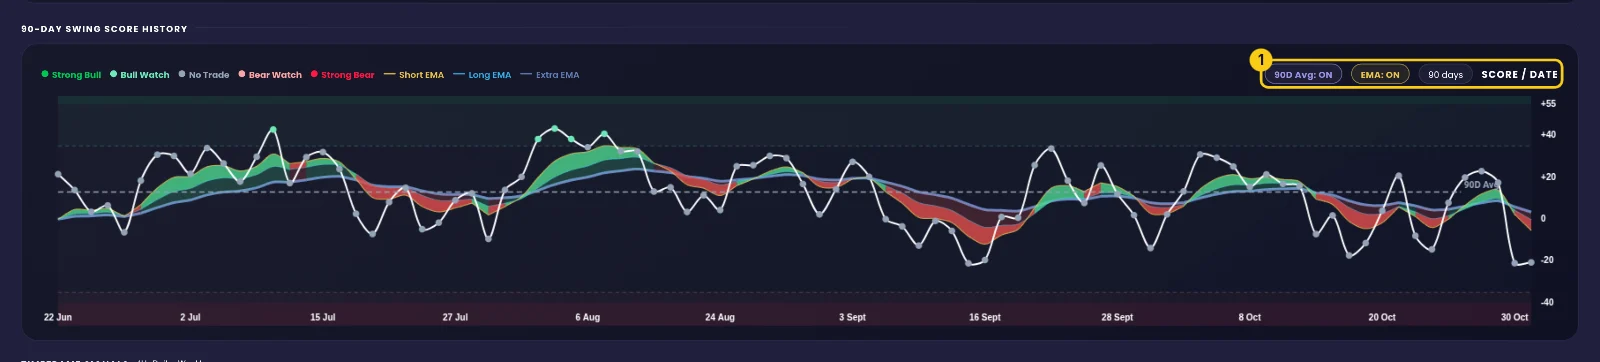
This is a daily line chart of the score. The background bands carry the five zone names in the legend: Strong Bull, Bull Watch, No Trade, Bear Watch and Strong Bear. Three ribbon lines sit on top: Short EMA, Long EMA and Extra. The ribbon turns green when the score is above the Extra line and red when it is below. For SPY the ribbon was red, which reads as bearish momentum in the score itself. The latest lines read Short EMA -5.4, Long EMA -0.2 and Extra +3.4.
Two toggles sit on the chart: 90D Avg: ON shows or hides the dashed average line, and EMA: ON shows or hides the ribbon. The range label reads "90 days". Hover any point to read its SCORE / DATE. Across the visible history, SPY read +23.0 on October 28 and -21.0 on October 30. That swing is the drop you see in the 1-week change.
TIMEFRAME SIGNALS 4H · Daily · Weekly
Three cards show the signal on each timeframe, each on a 0–100 scale with a label:
- 4H: Bear, 17.1 / 100. The fastest view, with RSI and MACD listed under it.
- DAILY: Bear, 25.0 / 100. The middle view, also listing RSI and MACD.
- WEEKLY: Bear, 29.0 / 100. The slowest view, listing Trend Quality.
All three said Bear for SPY. That alignment is the strongest part of the bearish read. When they disagree, treat the setup as in transition. The Weekly card is the main directional filter for a swing trader.
CATEGORY SCORES
Seven tiles, each from -100 to +100, show which part of the picture is helping or hurting the score:
- MOMENTUM -- how price speed and push look. SPY: -26.3, the main bearish pressure.
- OPTS FLOW -- how options activity leans. SPY: +1.0, close to neutral.
- TREND -- the bigger trend backdrop. SPY: +16.9, still positive.
- VOL STRUCT -- how options pricing and volatility look. SPY: -7.3, mildly negative.
- EVENT DRIFT -- the effect of upcoming events. SPY: 0.0, nothing showing.
- VOLUME -- how trading volume supports the move. SPY: -11.2, negative.
- RISK -- how tradeable the name looks right now. SPY: +84.5, strongly positive.
SPY category scores
The key split for SPY: Momentum was negative while Trend stayed positive. Price was losing push inside a trend that still looked fine. That tension is one reason the strategy line said "mixed signals".
INDICATOR BREAKDOWN
This panel shows the individual technical readings, each with its own label:
- RSI DAILY -- overbought or oversold context. SPY: "Neutral zone".
- MACD -- momentum direction. SPY: "Bearish ▼".
- 3M RS RANK -- strength against the wider universe over three months. SPY: "Average vs universe".
- MA POSITION -- where price sits against its daily moving averages. SPY: "At MAs".
- WEINSTEIN -- the stage of the longer trend. SPY: "Stage 2 ▲", an advancing stage.
- STRUCTURE -- the pattern of recent swings. SPY: "Lower Lows".
- BB SQUEEZE -- whether the bands are tight. SPY: "🔥 Squeeze ▲", a squeeze is on.
- P/C RATIO -- puts against calls. SPY: 1.54, "Put-heavy (bear)".
- CALL SWEEPS -- call sweep premium, with put sweeps under it. SPY: $232.1M calls against $222.2M puts.
- RVOL -- volume against normal. SPY: 1.75×, "Above avg".
- EARNINGS -- the next report. SPY: "—", none shown.
Read it as a checklist of agreement. For SPY, MACD, Structure and the P/C ratio leaned bearish. Weinstein Stage 2 leaned bullish. The squeeze label says the bands are tight. Together, that's a split picture.
MARKET CONTEXT
Three cards show the market backdrop:
- 😨 VIX Regime: MID, "Moderate volatility".
- 📊 Market Breadth: 50.0%, "Mixed breadth".
- 📐 IV Rank (IVR): 27.0%, labeled "Low IV — buy premium/spreads". A low IVR means options are cheap compared with their own history.
For SPY, the backdrop was middle-of-the-road. Nothing here was extreme.
TRADE SETUP
This panel repeats the banner's verdict in more detail. 📈 Strategy Fit read "No trade (mixed signals)" under "Recommended approach". 🎯 Setup Type read "Bearish breakdown", with Entry Quality 0 / 100. ⏱ Score Performance showed 1 Day ▲ +0.4 and 1 Week ▼ -28.5. The time stamp read "Updated: 2026-11-02 21:01 UTC", which is 4:01 PM ET.
Below it sits OPTIONS FLOW & DARK POOL, subtitled "Smart money positioning". The 🌑 Dark Pool Net Flow card read "Balanced", with Buy $4212.3M and Sell $3841.0M over 5 days. Buy was larger than sell, but the label still called it balanced. Next to it is the 🔥 Unusual Sweep card for the ticker's sweep activity.
MARKET BREADTH
Four cards check whether the broad market backs the setup:
- 📈 RS vs SPY: +0.0%, Score: 45/100. For SPY itself, relative strength against SPY is flat by nature.
- 😨 VIX Directional: 55/100, "Moderate — neutral".
- 🏭 Sector Breadth: 3/6 sectors above their moving average, Score: 45/100.
- ⚖️ RSP vs SPY: +0.99%, "Broad market rally".
TOP 2 SCORE DRIVERS & TOP 2 DETRACTORS
The last panel names what helped and hurt the most. Drivers: 📈 Risk/Tradeability +4.2 bullish and 📈 Trend/Structure +3.0 bullish. Detractors: 📉 Momentum -7.1 bearish and 📉 Volume -0.9 bearish. Momentum was the single largest pull on SPY's score. A note under the panel says not every indicator behind the score is shown. EZPZ's method is proprietary.
How to use the Ticker Swing Market Regime page on EZPZ: a 10-minute routine
This is the exact routine, with the real screens from November 2, 2026. The yellow numbers show where to look.
Read the banner first
Open the Ticker Swing Market Regime page and look up SPY. (1) "Bearish breakdown" names the setup. (2) "Entry: 0/100" says timing is not clean. (3) "📊 No trade (mixed signals)" is the overall verdict, and (4) "1D: +0.4" shows the score barely moved since the prior day.

Compare the score with its averages
Find (1) the 90-DAY AVERAGE card. Read (2) the 15-day average of +0.7 and (3) the 90-day average of +13.0. With the live score at -20.7, both averages sit well above it, which reads as a recent slide.

Check the score's own trend
On the history chart, keep (1) "90D Avg: ON" and "EMA: ON" switched on over the "90 days" range, and hover for SCORE / DATE. Look at the ribbon color. For SPY it was red, meaning the score was below its Extra line.
Line up the three timeframes
Read (1) 4H Bear at 17.1 / 100, (2) DAILY Bear at 25.0 / 100 and (3) WEEKLY Bear at 29.0 / 100. All three agree on Bear. That is the clearest bearish piece on the page.

Find the story in the categories
Read (1) MOMENTUM -26.3, (2) OPTS FLOW +1.0, (3) TREND +16.9 and (4) VOL STRUCT -7.3. Momentum is negative while Trend is positive. Options flow is near flat, so it doesn't break the tie.

Confirm with the indicators
Check (1) RSI DAILY "Neutral zone", (2) MACD "Bearish ▼", (3) 3M RS RANK "Average vs universe" and (4) MA POSITION "At MAs". Price sitting at its averages with a bearish MACD fits a setup that hasn't committed yet.

Look at the backdrop
Read (1) VIX Regime MID, "Moderate volatility", (2) Market Breadth 50.0%, "Mixed breadth" and (3) IV Rank 27.0%, "Low IV". A calm, mixed market does not push hard either way. Then scroll to Market Breadth and the drivers panel to finish the picture.

Check again before the close
Come back late in the session and compare the banner, the 1D change and the ribbon color with your morning read. A label change that holds across several days means more than a one-day move.
Reading the page in plain English
Put together, SPY on November 2, 2026 read as a bearish lean that was still forming. The timeframes agreed on Bear. Momentum, Volume and Structure leaned bearish. But Trend and Weinstein Stage 2 stayed positive, and Entry Quality was 0/100. The page called it "No trade (mixed signals)".
- If the score is negative, all timeframes say Bear and Entry Quality is 0, the page reads as a bearish setup that isn't clean enough yet.
- If the score is far below both period averages, the page reads as a recent deterioration rather than a long-running trend.
- If Momentum is negative but Trend is positive, the page reads as a pullback inside a still-intact trend, with the outcome undecided.
- If the ribbon flips from red to green and stays there, the page reads as the score's own momentum turning up.
- If the timeframes split, with 4H one way and Weekly another, the page reads as a setup in transition.
- If Market Context and Market Breadth are neutral, the page reads as a backdrop that neither helps nor hurts the setup.
What this data cannot tell you
- Direction. A bearish score describes the current setup. It does not say where SPY goes next.
- Timing. Entry Quality rates the present moment only. It does not say when a better moment arrives.
- The full picture. The page notes that not every indicator behind the score is displayed, so the panels show the key readings, not everything.
Common mistakes
- Reading the label without Entry Quality. SPY was Bearish Watch, yet Entry Quality was 0/100; both matter.
- Ignoring the averages. A -20.7 score means more when you see the 90-day average at +13.0.
- Treating one day as a trend. The 1D change was only +0.4; the 1-week change of -28.5 told the bigger story.
- Looking at one category alone. Risk at +84.5 looks great, but Momentum at -26.3 pulled the other way.
- Skipping the backdrop. Market Context and Market Breadth show if the wider market supports the read.
Tools used in this post
These EZPZ tools pair well with the swing regime page when you want more detail on flow, gaps, range and volatility.
Which plan you need
| Tool | Plan | Free delayed page |
|---|---|---|
| DarkVol Leaders | Pro | Yes |
| Gap Up and Down | Pro | Yes |
| Range Change Leaders | Pro | Yes |
| Historical Volatility | Pro | Yes |
| Intraday Regime Leaderboard | Premium | None |
FAQ
What does a swing score of -20.7 mean?
It means the setup leans bearish. For SPY on November 2, 2026, it came with a Bearish Watch label, a "Bearish breakdown" setup and a "No trade (mixed signals)" verdict.
Why can Entry Quality be 0 when the score is bearish?
Entry Quality is a separate timing reading. A score can lean one way while the timing still isn't clean. SPY showed exactly that, with Entry: 0/100.
What does the red ribbon on the history chart mean?
Red means the score is below its Extra line, which reads as bearish momentum in the score itself. Green means the opposite.
Which timeframe matters most?
For swing traders, the Weekly card is the main directional filter. On November 2, all three, 4H, Daily and Weekly, read Bear.
Can I turn off the average line and ribbon?
Yes. Use the "90D Avg" and "EMA" toggles on the 90-DAY SWING SCORE HISTORY chart to show or hide each one.
How is the score calculated?
EZPZ's method is proprietary. The page shows you the readings and labels so you can read the setup, not how it is put together.