How to read the Ticker Investing Score: zone, entry engine and category scores.
AAPL scores 68.5 on the Ticker Investing Score, sits in the WATCHLIST zone and shows Entry: READY with a Normal Add. Here is how to read every panel, from the seven category scores to the drivers and detractors.
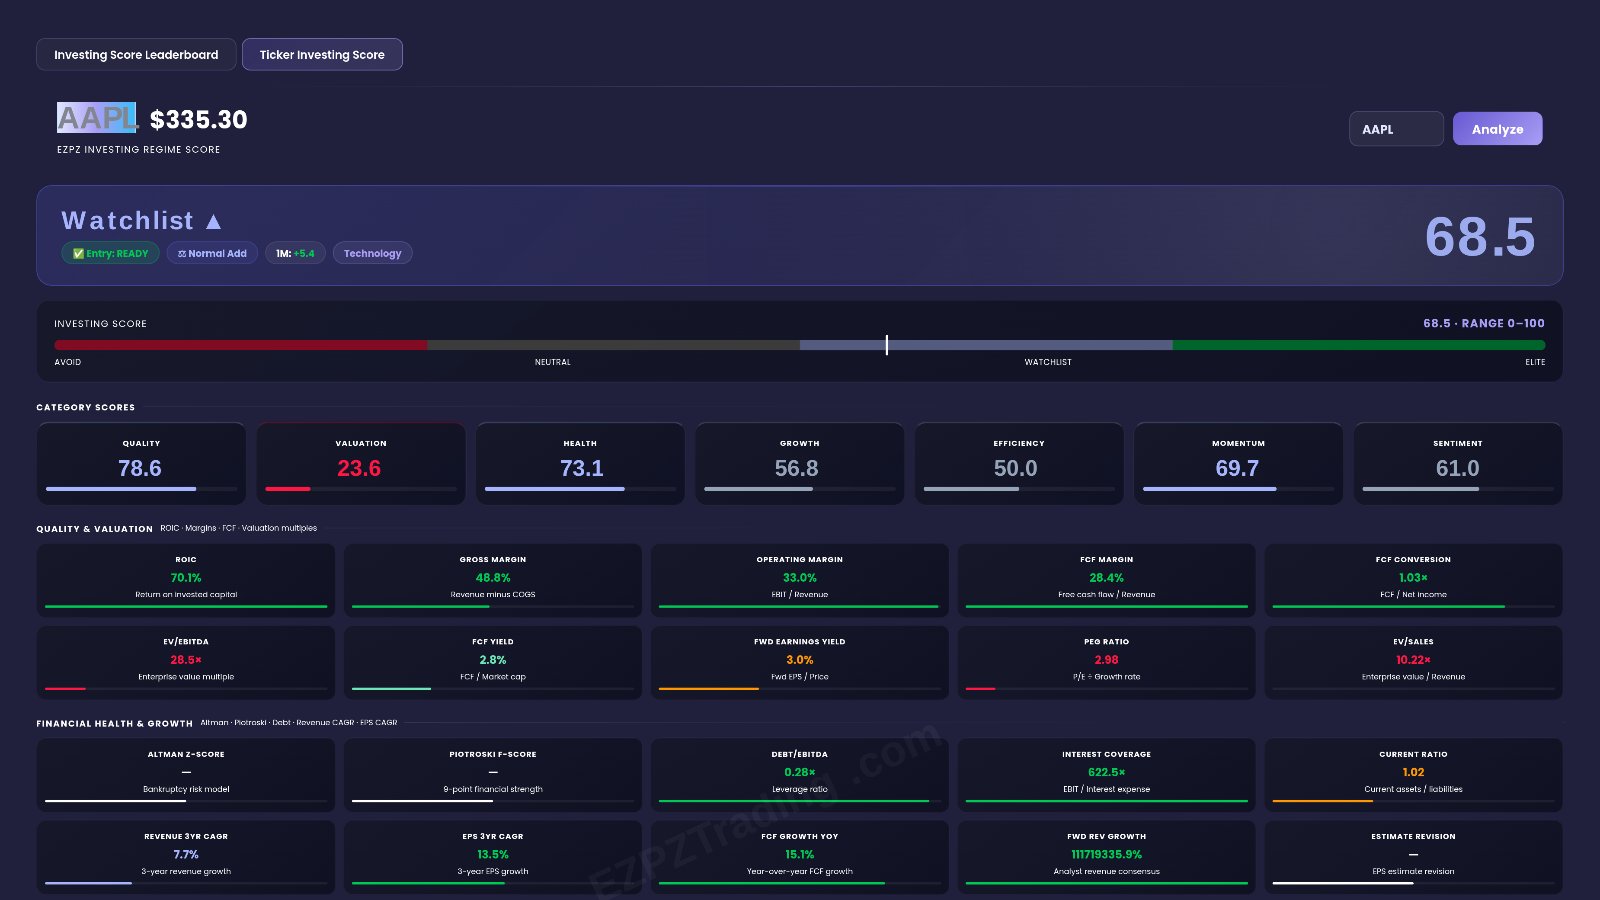
On Tuesday, November 3, 2026, AAPL scores 68.5 on the Ticker Investing Score. It sits in the WATCHLIST zone, its entry engine reads READY with a Normal Add, and the score is up +5.4 over one month. Under that headline sits a split story: Quality reads 78.6, but Valuation reads only 23.6.
That split matters. One number can hide two very different stocks. The Ticker Investing Score page breaks the headline into parts, so you can see what holds a score up and what pulls it down.
Quick definition first. The Investing Score is a single reading of how strong a stock looks as a longer-term investing candidate. Higher is stronger. The zone is the label for where that score falls (AAPL is in WATCHLIST). The entry status tells you if a timing trigger has fired (READY) or not. The position size label (here, Normal Add) suggests how large an addition the page considers fitting. The category scores are seven separate readings, Quality, Valuation, Health, Growth, Efficiency, Momentum and Sentiment, that explain the headline.
68.5
+5.4
23.6
What the Investing Score helps you see
Most swing traders and investors check price first. Price tells you what the market did. It does not tell you what kind of company you are holding. The Investing Score page puts business quality, price and timing on one screen.
One headline, seven stories
The big number is the summary. The seven category scores are the detail. Two stocks can both score 68.5 for very different reasons. One might be cheap and slow. Another might be strong and expensive. AAPL is the second kind on this date: high Quality, high Health, low Valuation.
Quality versus timing
The page keeps two questions apart:
- Is this a strong candidate? The score and zone answer that.
- Has a timing trigger fired? The entry engine answers that, with READY or a different status.
A stock can score well and still have no trigger. A READY status with a middling score is also possible. Reading both keeps you from mixing up "good company" with "good moment".
Direction of change
Retail traders care most about a change of direction. The 1 Month score change shows it. AAPL's +5.4 means the score rose over the month. A falling number would mean the picture is getting weaker, even if the zone has not changed yet.
Walking through the tab, top to bottom
Here is the tab exactly as you see it for AAPL, panel by panel.
Watchlist ▲
The top strip is the headline. For AAPL it reads: Watchlist ▲, ✅ Entry: READY, ⚖ Normal Add, 1M: +5.4, Technology and the score 68.5.
- Watchlist ▲: the zone. WATCHLIST describes quality stocks worth tracking that are not yet exceptional across every category.
- ✅ Entry: READY: the score qualifies and a timing trigger has fired.
- ⚖ Normal Add: the position size label. It sits between a small starter size and a full, aggressive size.
- 1M: +5.4: how far the score moved over one month. Plus means improving.
- Technology: the sector.
- 68.5: the Investing Score itself.
Read it left to right as one sentence: "AAPL is a WATCHLIST stock, the entry is READY, the size label is Normal Add, and the score has been rising."
CATEGORY SCORES
This panel shows seven cards, each with its own score. For AAPL:
- QUALITY 78.6: profitability, return on capital and earnings quality. The highest card on the panel.
- VALUATION 23.6: how attractively priced the stock is against its fundamentals. A low reading means the stock looks expensive. This is the lowest card.
- HEALTH 73.1: financial safety and balance sheet strength.
- GROWTH 56.8: the growth path of the business, past and expected.
- EFFICIENCY 50.0: how well the company turns growth into real cash.
- MOMENTUM 69.7: price trend strength and relative strength against the market.
- SENTIMENT 61.0: options market signals and positioning.
AAPL category scores
The shape tells the story. Quality, Health and Momentum stand tall. Valuation sits far below the rest.
Under the cards sits the QUALITY & VALUATION detail block, labelled "ROIC · Margins · FCF · Valuation multiples". Each metric shows its value and a short label:
- ROIC 70.1%: return on invested capital. A high number means the business earns a lot on the money put into it.
- GROSS MARGIN 48.8%: revenue minus cost of goods, as a share of revenue.
- OPERATING MARGIN 33.0%: profit from operations as a share of revenue.
- FCF MARGIN 28.4%: free cash flow as a share of revenue.
- FCF CONVERSION 1.03×: free cash flow compared with net income. Near or above 1× means profits show up as cash.
- EV/EBITDA 28.5×: the enterprise value multiple. A high multiple is one reason a Valuation card can read low.
These metrics put real business numbers behind the cards. AAPL's 70.1% ROIC and 33.0% operating margin fit a 78.6 Quality score. Its 28.5× EV/EBITDA fits a 23.6 Valuation score.
ENTRY ENGINE & SCORE PERFORMANCE
This panel has three boxes.
- ✅ Entry Engine: reads READY, with ⚖ Normal Add and the entry reason 50-DMA pullback test. The reason is the plain-language trigger. Here, price is testing its 50-day moving average after a pullback.
- 📈 Score Performance: 1 Month +5.4, with Updated: 2026-11-04 03:01 UTC (10:01 PM ET). Always check this time so you know how fresh the reading is.
- 🏭 Sector: Technology, and Score Zone: WATCHLIST.
If you only had time for one panel, this is the one that answers "what does the page say about timing right now?"
TOP SCORE DRIVERS & DETRACTORS
This panel names what holds the score up and what pulls it down. For AAPL:
- 📈 Quality 78.6: Strength driver.
- 📈 Financial Health 73.1: Strength driver.
- 📉 Efficiency 50.0: Weakest factor.
- 📉 Valuation 23.6: Weakest factor.
It is a shortcut. Instead of scanning seven cards, you see the top two and bottom two at once. For AAPL, the score is held up by business quality and balance sheet strength. Price and cash efficiency are the drag.
Under the list, the panel carries a note: not every technical indicator behind the ticker or regime score is shown. Only the ones displayed are meant for comparison and decision-making. EZPZ's method is proprietary.
How to use the Ticker Investing Score on EZPZ: a 5-minute routine
This is the exact routine, with the real screens from November 3, 2026. The yellow numbers show where to look.
Read the headline strip
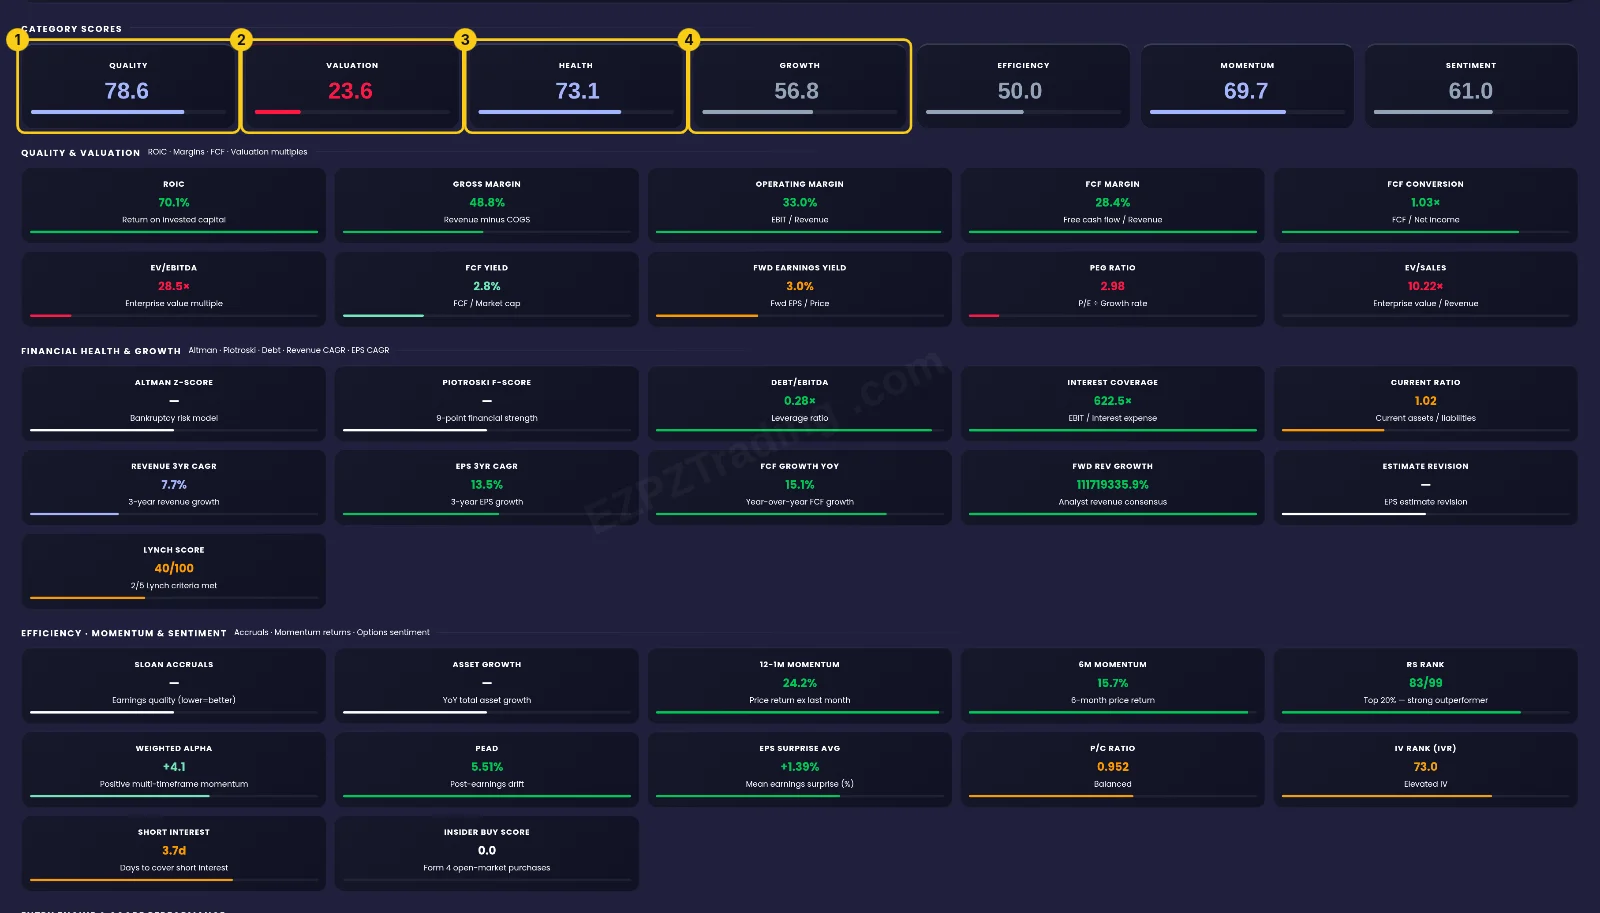
Open the Ticker Investing Score and look at the top strip. The score (1) is 68.5. The entry status (2) reads ✅ Entry: READY, and the size label (3) is ⚖ Normal Add. The sector (4) is Technology. Together they say AAPL is a WATCHLIST candidate with a live trigger.

Scan the category scores
Move to the cards. QUALITY 78.6 (1) is the strongest. VALUATION 23.6 (2) is the weakest by a wide gap. HEALTH 73.1 (3) backs up the quality story, and GROWTH 56.8 (4) sits in the middle. This tells you AAPL's score rests on a strong business, not a cheap price.
Check the entry engine and freshness
The Entry Engine (1) reads READY, Normal Add, with the reason "50-DMA pullback test". Score Performance (2) shows 1 Month +5.4, updated 2026-11-04 03:01 UTC. The Sector and Score Zone box (3) confirms Technology and WATCHLIST. A rising score plus a READY trigger is the combination to note.

Confirm drivers and detractors
Quality 78.6 (1) and Financial Health 73.1 (2) are the strength drivers. Efficiency 50.0 (3) and Valuation 23.6 (4) are the weakest factors. Ask yourself if you are comfortable owning a strong business at a rich valuation. Then compare with peers on the Investing Score Leaderboard.

Check again after the next update
Come back after the next update time. Watch whether the 1 Month change stays positive and whether the entry status stays READY. A change of direction in either is the first thing to notice.
Reading the page in plain English
Put the panels together and AAPL reads as: a high-quality, financially healthy Technology stock with a rising score and a live pullback trigger, held back by a stretched valuation.
- If the zone is WATCHLIST and the entry is READY, the page reads as "a solid candidate, and a timing trigger has fired".
- If Quality and Health are high but Valuation is low, the page reads as "strong business, expensive price".
- If the 1 Month change is positive, the page reads as "the picture is improving".
- If the 1 Month change turns negative, the page reads as "the picture is weakening", even before the zone changes.
- If Momentum is high but Quality and Health are low, the page reads as "price is running ahead of the fundamentals".
What this data cannot tell you
- Direction. A READY status and a 68.5 score describe the current setup. They do not say where AAPL's price goes next.
- Timing. The entry trigger describes a condition on the latest update. It does not say how long that condition lasts.
- Your fit. The size label is a general reading. It does not know your account, your other positions or your risk limits.
Common mistakes
- Reading only the big number. 68.5 hides a 78.6 Quality and a 23.6 Valuation. Open the cards.
- It means a trigger fired, not that the trade works.
- Ignoring the update time. Check the "Updated" line so you are not reading old data.
- Skipping the 1 Month change. A stable zone can hide a score that is sliding.
- Confusing this with a day-trading signal. The investing score is a longer-term reading. For intraday context, use the intraday regime score, and for medium-term swings, the swing regime score.
Tools used in this post
These EZPZ tools pair well with the Investing Score when you want price, volume and regime context around a name like AAPL.
Which plan you need
| Tool | Plan | Free delayed page |
|---|---|---|
| DarkVol Leaders | Pro | Yes |
| Gap Up and Down | Pro | Yes |
| Range Change Leaders | Pro | Yes |
| Historical Volatility | Pro | Yes |
| Intraday Regime Leaderboard | Premium | None |
FAQ
What does a WATCHLIST zone mean?
It marks a quality stock worth tracking that is not yet exceptional in every category. AAPL is in WATCHLIST with a 68.5 score.
What does Entry: READY mean?
The score qualifies and a timing trigger has fired. For AAPL, the trigger reads "50-DMA pullback test".
What is a Normal Add?
It is the position size label. It sits between a small starter size and a full, aggressive size. It is a general reading, not a plan for your account.
Why is AAPL's Valuation score so low?
The Valuation card reads 23.6, which says the stock looks expensive against its fundamentals. The EV/EBITDA of 28.5× on the same panel fits that reading.
How often does the score change?
Check the "Updated" line in the Score Performance box. This reading shows 2026-11-04 03:01 UTC, and the 1 Month change of +5.4 shows how far it moved over the month.
Can I compare AAPL with other stocks?
Yes. The Investing Score Leaderboard lists scores across many names, so you can see where a ticker ranks.