How to read the Theta Farming Scanner: Fit Scores, IV Rank and strategy picks
In the latest data, QQQ tops the Theta Farming Scanner with an 83.94% IV Rank and a Short Strangle 63 badge, SPY's best fit is Iron Condor 67, and a CAUTION — NEGATIVE GEX badge sits on top. Here is how to read every panel.
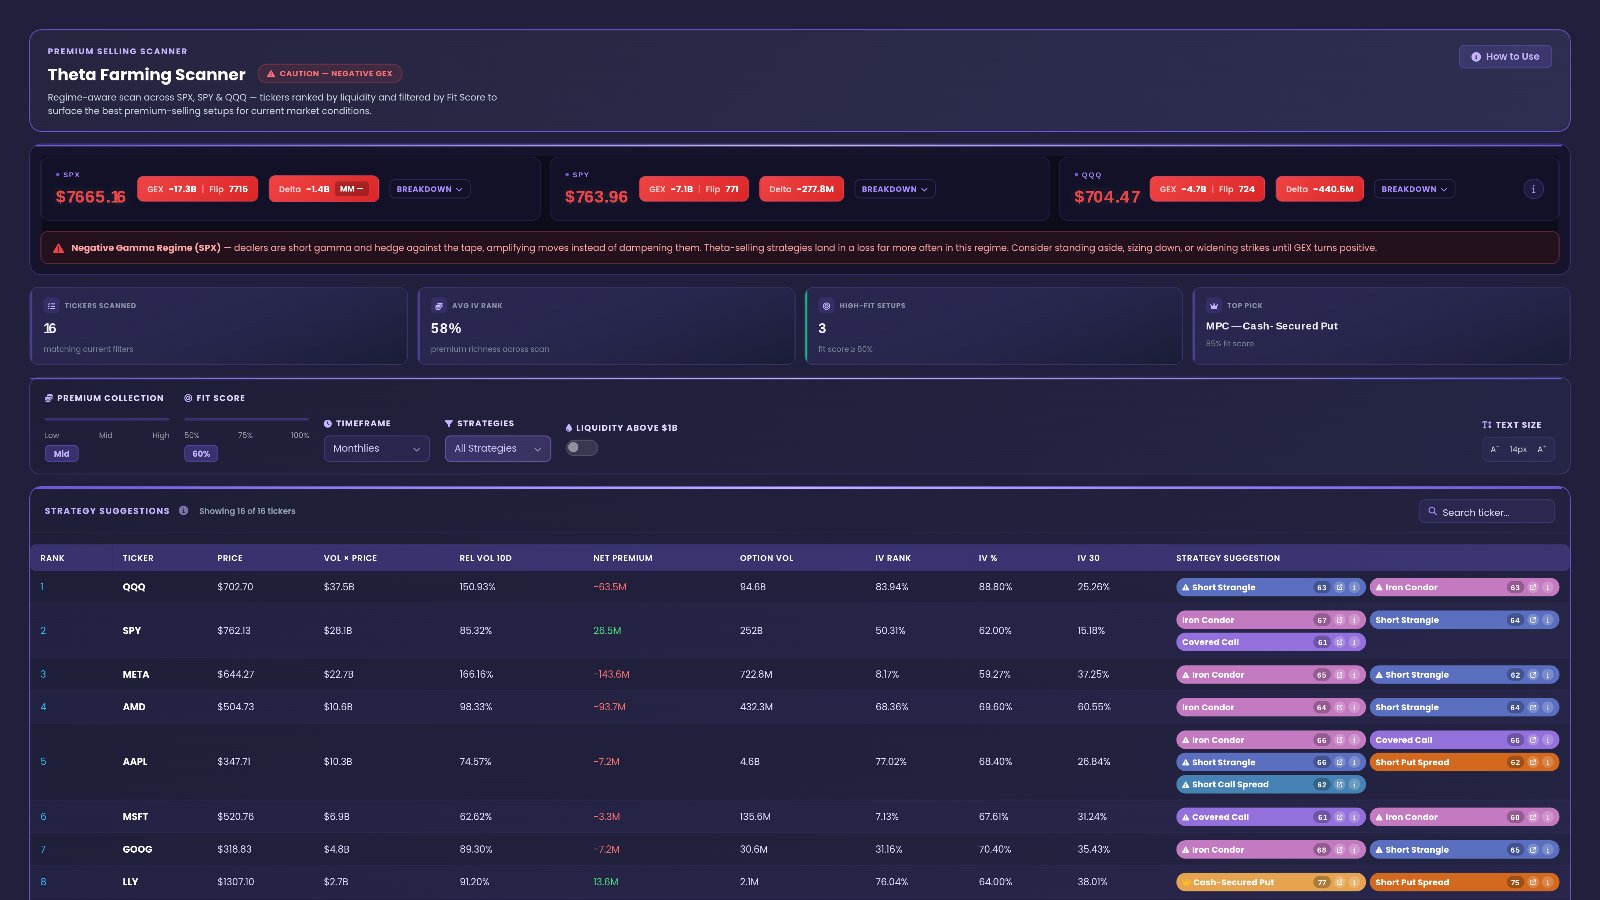
In the latest data, QQQ sits at rank 1 on the Theta Farming Scanner at $702.70, with an IV Rank of 83.94% and two badges: Short Strangle 63 and Iron Condor 63. SPY is right behind at $762.13, and its best badge is Iron Condor 67. Above it all sits a CAUTION — NEGATIVE GEX badge. Premium is rich, but the backdrop calls for care. That mix is exactly what this page is built to show.
You can open the live Theta Farming Scanner, or follow along on the free delayed Theta Farming page if you don't have an account.
Quick definition first. Theta is the value an option loses each day as time passes. A theta farmer sells options to collect that slow decay. Implied volatility (IV) is how much movement option prices expect. Higher IV means fatter premium to sell. IV Rank and IV % show whether the latest IV is high or low against the ticker's own history. A Fit Score is EZPZ's read of how well current conditions match a strategy's ideal setup. Higher means a better match. GEX (gamma exposure) describes the market-maker backdrop. Negative GEX means price swings can stretch further, which is harder for sellers.
83.94%
67
84.7%
The idea behind the Theta Farming Scanner
Selling premium works best in the right weather. You want enough premium to make the trade worth it. You want a market that isn't about to run away from your strikes. And you want a strategy whose shape fits the trend. This page puts those three questions on one screen.
Premium: is there enough to sell?
The IV columns answer this. QQQ's IV Rank of 83.94% says its implied volatility sits high in its own history. META shows the opposite picture: IV Rank 8.17%, even though its IV 30 is 37.25%. A high raw IV is not the same as a high IV for that ticker.
Backdrop: is the market calm enough?
The regime badge at the top answers this. In the latest data it reads CAUTION — NEGATIVE GEX. Across the data behind the page, SPY shows GEX of -7.1B with a flip at 771, while SPY trades at $763.96, below that flip. SPX shows -17.3B with a flip at 7715. In plain English: the backdrop is one where moves can run, so premium sellers face more risk.
Fit: which strategy matches?
The Strategy Suggestion badges answer this. Each ticker gets one or more strategy names with a Fit Score. EZPZ's method is proprietary. Your job is to read the score, not rebuild it.
- Liquidity first. Rows are ranked so the easiest names to trade sit on top.
- Premium second. IV Rank, IV % and IV 30 show how rich the options are.
- Fit last. The badges show which strategy lines up best right now.
Walking through the tab, top to bottom
Toolbar
The toolbar runs across the top. It holds five controls:
- BREAKDOWN opens a fuller breakdown of the market backdrop behind the regime badge.
- Monthlies shows the timeframe the suggestions apply to. In the latest data it is set to monthly expirations.
- All Strategies shows which strategies are included. Here all six from the Quick Reference are on.
- A- and A+ shrink or enlarge the text, handy on a small screen.
Change the timeframe or strategy set and the badges in the table change with it. A ticker can fit an Iron Condor on monthlies and look different elsewhere.
Theta Farming Scanner
This is the header card. It carries the label PREMIUM SELLING SCANNER and the page title. Next to it sits the regime badge, which in the latest data reads CAUTION — NEGATIVE GEX. The line underneath explains the scan: a regime-aware scan across SPX, SPY and QQQ, with tickers ranked by liquidity and filtered by Fit Score.
The How to Use button opens the page's own guide. It lists the Fit Score bands and what each one means. Read it once. After that, the badge colour and number will make sense at a glance.
How to read the regime badge: a caution label doesn't block any strategy. It tells you every Fit Score below it sits in a riskier backdrop. Many sellers treat it as a reason to be pickier and trade smaller.
STRATEGY SUGGESTIONS
This is the main table. Its header reads Showing 16 of 16 tickers, so every ticker in the scan is visible with the current filters. Here is every column:
- RANK -- the row's place by liquidity. 1 is the most liquid name on the page.
- TICKER -- the symbol.
- PRICE -- the latest share price. QQQ shows $702.70.
- VOL × PRICE -- dollar volume, a quick liquidity gauge. QQQ shows $37.5B, SPY $28.1B. Bigger means easier fills.
- REL VOL 10D -- the latest volume against its 10-day average. Above 100% means busier than usual. QQQ at 150.93% is busy; SPY at 85.32% is quieter than normal.
- NET PREMIUM -- calls minus puts in option flow. A negative number means put premium leads. QQQ shows -63.5M, SPY 26.5M, META -143.6M.
- OPTION VOL -- total options activity on the ticker. SPY shows 252B, QQQ 94.6B, META 722.8M.
- IV RANK -- where current IV sits in the ticker's own range. High means premium is rich for that name.
- IV % -- the IV percentile, another way of placing the latest IV against its own history.
- IV 30 -- the 30-day implied volatility as a raw level. QQQ 25.26%, SPY 15.18%, META 37.25%.
- STRATEGY SUGGESTION -- badges with a strategy name and its Fit Score. Higher is a closer match.
Reading QQQ across: rank 1, $702.70, $37.5B dollar volume, REL VOL 10D 150.93%, NET PREMIUM -63.5M, OPTION VOL 94.6B, IV RANK 83.94%, IV % 88.80%, IV 30 25.26%. Badges: Short Strangle 63 and Iron Condor 63. So: very liquid, unusually busy, put-leaning flow, and rich premium. The fit is decent, but not the best on the page.
Reading SPY across: rank 2, $762.13, $28.1B, REL VOL 10D 85.32%, NET PREMIUM 26.5M, OPTION VOL 252B, IV RANK 50.31%, IV % 62.00%, IV 30 15.18%. Badges: Iron Condor 67, Short Strangle 64, Covered Call 61. Middling premium, calmer volume, call-leaning flow. Three strategies clear the bar, and Iron Condor leads.
META is a useful contrast. It shows REL VOL 10D 166.16% and NET PREMIUM -143.6M, yet IV RANK is only 8.17%. Its top badge is still Iron Condor 65. A low IV Rank doesn't rule out a fit; it just means the premium is not rich for META.
The filters active in the latest data were Monthlies, a Mid premium setting and a 60% Fit Score floor. That is why every badge you see sits at 60 or above. Further down the list, the best fits climb: across the visible rows, the highest are Cash-Secured Put scores.
Best Fit Score by ticker
Notice the pattern. The most liquid names at the top have the lowest best fits. The strongest scores, like WMT's Cash-Secured Put at 80.5%, sit lower in the liquidity ranking. Rank and fit answer different questions.
STRATEGY QUICK REFERENCE
At the bottom sits a cheat sheet for the six strategies. Its columns:
- STRATEGY -- the strategy name, matching the badges above.
- VOLATILITY CONDITION -- the IV setting it suits best.
- TREND -- the price trend it prefers: Flat, Up, Down or Mild trend.
- RISK -- Defined (losses capped) or Unlimited.
- THETA STRENGTH -- how much decay it collects, in 🔥 icons.
| STRATEGY | VOLATILITY CONDITION | TREND | RISK | THETA STRENGTH |
|---|---|---|---|---|
| Short Strangle | High IV, low realized vol | Flat | Unlimited | 🔥🔥🔥 |
| Iron Condor | High IV, low realized vol | Flat | Defined | 🔥🔥 |
| Short Put Spread | High IV, uptrend | Up | Defined | 🔥🔥 |
| Short Call Spread | High IV, downtrend | Down | Defined | 🔥🔥 |
| Cash-Secured Put | Normal IV, low vol | Mild trend | Defined | 🔥 |
| Covered Call | Normal IV, low vol | Mild trend | Defined | 🔥 |
Read the Iron Condor row across: high IV with low realized vol, a flat trend, defined risk, two flames. The Short Strangle wants the same weather and collects more decay, but its risk is Unlimited. That is the trade-off behind QQQ's tie at Short Strangle 63 and Iron Condor 63.
How to use the Theta Farming Scanner on EZPZ: a 5-minute routine
This is the exact routine, with the real screens from the latest data. The yellow numbers show where to look.
Check the backdrop first
Open the Theta Farming Scanner. Confirm you are on the PREMIUM SELLING SCANNER (1). If it's your first visit, open How to Use (2) to see the Fit Score bands. Then read the regime badge (3): CAUTION — NEGATIVE GEX tells you the backdrop is riskier for sellers, so every score below needs a closer look.
Scan the badges, row by row
Go to the STRATEGY SUGGESTION column (1). For SPY (2), the badges read Iron Condor 67, Short Strangle 64 and Covered Call 61, so Iron Condor is the closest match. Further down, one row shows Iron Condor 64 and Short Strangle 64 (3), a tie between the two. Another shows Covered Call 61 and Iron Condor 60 (4), right at the edge of the 60% floor.
Match the badge to the strategy profile
Scroll to the Quick Reference. Find the strategy (1) from your badge, then check its TREND (2) and THETA STRENGTH (3). For Iron Condor (4), the row reads Flat, Defined risk, 🔥🔥. If the chart of your ticker isn't flat, the badge alone isn't the full story.
Check again before the close
Come back late in the day. See whether the regime badge has changed and whether your ticker's top badge still clears the floor. Then cross-check the range with the Expected Move page.
Reading the page in plain English
Put the pieces together and each row tells a short story: how liquid, how rich the premium, and which strategy fits.
- If IV RANK is high and the top badge is a neutral strategy, as with QQQ at 83.94% and Short Strangle 63, the page reads as rich premium with a fair, not strong, fit.
- If IV RANK is low but a badge still appears, as with META at 8.17% and Iron Condor 65, the page reads as a fit on conditions, with thinner premium for that name.
- If several badges clear the floor, as with SPY's 67, 64 and 61, the page reads as a ticker where more than one structure fits, led by the highest score.
- If NET PREMIUM is negative, as with QQQ's -63.5M, the page reads as put-led flow on that ticker.
- If the regime badge says CAUTION — NEGATIVE GEX, the page reads as a riskier backdrop for every suggestion below it.
For more on the backdrop, see how to read gamma exposure. For the bigger picture on selling premium, read the complete premium-selling framework.
What this data cannot tell you
- Direction. A Fit Score says a strategy matches current conditions. It doesn't say where price goes next.
- Timing. The scan shows the latest data. It doesn't tell you when to open or close a trade.
- Your strikes and size. The table picks a strategy, not the exact strikes, size or exit that suit your account.
Common mistakes
- Treating rank as quality. RANK is liquidity. QQQ is rank 1, but its best fit is lower than names further down.
- Ignoring the regime badge. CAUTION — NEGATIVE GEX applies to every row, not just SPY and QQQ.
- Reading IV 30 alone. META's IV 30 of 37.25% looks high, but its IV RANK of 8.17% says premium is low for META.
- Forgetting the risk column. Short Strangle shows Unlimited risk in the Quick Reference, even when it ties an Iron Condor.
- Missing the filters. With a 60% floor, weaker badges are hidden. "Showing 16 of 16 tickers" refers to tickers, not every strategy.
Tools used in this post
These are the EZPZ tools that pair well with the scanner.
Which plan you need
| Tool | Plan | Free delayed page |
|---|---|---|
| Theta Farming | Premium | Yes |
| 0DTE Graph | Pro | Yes |
| 7-DTE Graph | Pro | Yes |
| Net Premium Heatmap | Pro | Yes |
| Expected Move | Pro | Yes |
| GEX Heatmap | Premium | None |
FAQ
What is a Fit Score on the Theta Farming Scanner?
It is EZPZ's read of how well current conditions match a strategy's ideal setup. Higher is a closer match. SPY's Iron Condor 67 beats its Covered Call 61. EZPZ's method is proprietary.
Why is QQQ ranked first if its Fit Score isn't the highest?
RANK sorts by liquidity, shown in VOL × PRICE. QQQ leads at $37.5B. Fit Scores are a separate reading, shown in the badges.
What does CAUTION — NEGATIVE GEX mean for premium sellers?
It flags a backdrop where price moves can stretch further. That is tougher for short-premium trades, so many traders get more selective while it shows.
What is the difference between IV RANK and IV 30?
IV 30 is the raw implied volatility level. IV RANK places it against the ticker's own history. META shows IV 30 of 37.25% but IV RANK of 8.17%.
Why do some tickers show only two badges?
Only strategies that clear the active Fit Score floor appear. In the latest data that floor was 60%, so QQQ shows two badges and SPY shows three.
Can I try it without an account?
Yes. The free delayed Theta Farming page shows the same layout with delayed data.