
Learn Center
Theta Farming
A premium selling approach built around collecting an option's time decay, and the tradeoffs that come with it.
What is theta farming?
Theta farming is selling options to collect time decay. Theta is the rate an option loses value as expiration gets closer. On EZPZ, Theta Farming is a scanner: SPX, SPY, and QQQ show GEX, Flip, and Delta, then Strategy Suggestions ranks names by liquidity and Fit Score. A badge is a candidate, not a trade.
Sellers collect premium up front. The position benefits if implied volatility stays contained and the underlying stays inside the structure. Time decay is not linear. It usually speeds up later in the life of the option. That is why many sellers pick a window, then close or roll before expiration. The same sale also takes on risk if price or volatility moves hard against the short options. Defined-risk structures such as Iron Condor, Short Put Spread, and Short Call Spread cap that loss. Short Strangle does not. A large Fit Score does not remove that risk.
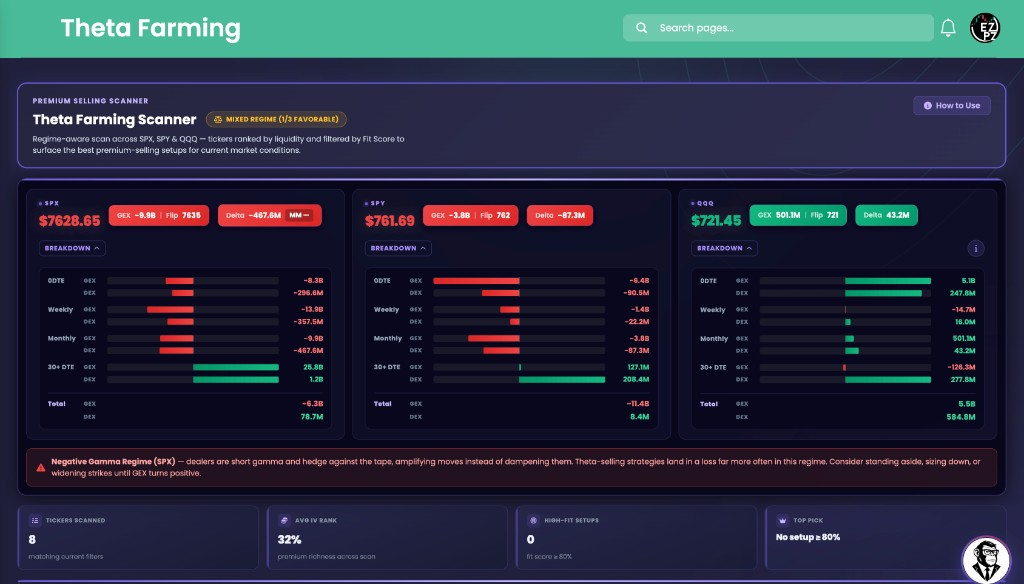
On EZPZ, the live page title is Theta Farming. How to Use opens Theta Farming Scanner, User Guide. The regime card is SPX, SPY, and QQQ. Each side prints last price, then GEX, Flip, and Delta. Breakdown opens 0DTE, Weekly, Monthly, 30+ DTE, and Total, with a GEX bar and a DEX bar on each row. Filters sit under that card: Premium Collection, Fit Score, Timeframe, Strategies, Liquidity above $1B, and Text Size. Timeframe starts on Monthlies. Fit Score starts at 60%. Premium Collection starts on Mid. Liquidity above $1B starts off. Strategy Suggestions is the table. Strategy Quick Reference sits under it. AiPe in the corner is labeled Theta Farming Analyst. IV Rank Explorer is Current IV (30D) and IV Rank (1Y) for one ticker you search. Gamma Exposure is the strike table with Call Wall and Put Wall. GEX and DEX is the Intraday GEX and DEX chart pair with Gamma Flip. Expected Move is DEM and VEM bands by expiration. Historical Volatility is 10D through 90D Volatility versus Price. Top 20 Optionable ranks listed-option names by Vol. * Price. Ticker Explorer is the one-symbol dashboard after you already picked a name. Theta Performance tracks a rule set over time. Custom Strategies is the payoff builder. Volatility Risk Premium (VRP) compares implied volatility with later realized volatility. Directional Options Pressure is Chart View and Table View for Short Straddle, Short Strangle (Δ20), Directional Pressure, and Net Volume. Greek Gods Dashboard is Ares, Hermes, Apollo, and Zeus on SPY Dashboard or SPX Dashboard. Contract Prices (XVWAP) is Price candles against XVWAP on one strike. Option Chain is the listed book for one ticker. Gamma Short Squeeze is Squeeze Score(%) ranks.
How Theta Farming works on EZPZ
Read SPX, SPY, and QQQ first, leave Timeframe on Monthlies, then scan Strategy Suggestions. It is not a score you trade. Most people start at GEX and Flip on SPX. If that card looks loud, open Breakdown and compare 0DTE with Weekly, Monthly, and 30+ DTE. Then set Fit Score and Strategies. Click a ticker when you want Ticker Explorer. Open How to Use if you want the scanner labels again.
How this differs from IV Rank Explorer
IV Rank Explorer is one ticker: Current IV (30D), IV Rank (1Y), period IV Rank, and IV Percentile (1Y). This page is a universe scan. IV Rank is a column on the row, not the whole page. Use IV Rank Explorer when you already have a name and want the 1Y clock. Use this page when you want Fit Score next to Iron Condor or Covered Call on many names. Use Gamma Exposure when you want Call Wall and Put Wall on one ticker. Use GEX and DEX when you want Gamma Flip on a strike chart. Use Expected Move when you want DEM versus VEM. Use Historical Volatility when you want 10D through 90D versus Price. Use Top 20 Optionable when you want Vol. * Price without strategy badges. Use Ticker Explorer when you want quote, IV Rank, and unusual activity on one symbol. Use Theta Performance when you want a track record, not a scan. Use Custom Strategies when you want a payoff diagram. Use Volatility Risk Premium (VRP) when you want implied versus realized. Use Directional Options Pressure when you want Straddle Profit % next to Directional Pressure on one ticker. Use Option Chain when you want listed strikes.
SPX, SPY, and QQQ regime
The top card is the index backdrop for the scan. It is not a row in Strategy Suggestions. Click Breakdown on a side to open the bars. The info button opens Market Regime: GEX + Delta Exposure.
Each panel is one underlier: SPX, SPY, or QQQ.
| On the card | What you are looking at |
|---|---|
| SPX SPY QQQ | Last price for that index or ETF. |
| GEX | Net gamma exposure on that name. Green leans positive. Red leans negative. |
| Flip | The flip level printed next to GEX. |
| Delta | Dealer delta on that name. SPX also prints an MM tag. |
Breakdown splits GEX and DEX by tenor. Total sits at the bottom.
| Row | What you are looking at |
|---|---|
| 0DTE | Same-day GEX and DEX bars. |
| Weekly | Near-dated GEX and DEX after 0DTE. |
| Monthly | Monthly-tenor GEX and DEX. |
| 30+ DTE | Longer-dated GEX and DEX. |
| Total | The summed GEX and DEX for that side. |
The title is Market Regime: GEX + Delta Exposure. Three blocks: SPX (S&P 500 Index), SPY (S&P 500 ETF), and QQQ (Nasdaq-100 ETF).
| Label | What you are looking at |
|---|---|
| +GEX or -GEX | Positive GEX Regime, Theta Selling Favorable, or Negative GEX Regime, Avoid Theta Selling. |
| Delta regime | Whether market makers look net long or net short delta on that name. |
Filter the scanner
The filter card sits between the regime card and Strategy Suggestions. These are the live labels. Defaults below are the ones on the product page.
| Control | What you are looking at |
|---|---|
| Premium Collection | Low, Mid, High. Starts on Mid. How to Use says this filters by IV Rank. |
| Fit Score | Floor from 50% to 100%. Starts at 60%. The extra screenshot uses 50%. |
| Timeframe | Monthlies starts on. Weeklies and 0DTE & 1DTE are the other picks. How to Use maps Monthlies to 15 to 45 day trades, Weeklies to 3 to 7 days, and 0DTE & 1DTE to same-day or next-day. |
| Strategies | Starts on All Strategies. Checkboxes: Short Strangle, Iron Condor, Short Put Spread, Short Call Spread, Cash-Secured Put, Covered Call. |
| Liquidity above $1B | Toggle. Starts off. |
| Text Size | A- and A+ around 14px. |
| How to Use | Opens Theta Farming Scanner, User Guide. |
Strategy Suggestions
The table title is Strategy Suggestions. How to Use says tickers are ranked by market cap times price. Rank 1 in the extra screenshot is SPY at $761.39. Click the palette icon next to the title for Strategy Color Guide. Click a strategy badge info icon for Strategy Details. The other icon is Strategy Builder.

Read left to right: rank and ticker, then liquidity and volume, then IV, then badges.
| Column | What you are looking at |
|---|---|
| Rank | Position in the liquidity rank. |
| Ticker | The underlying. Click it to open Ticker Explorer. |
| Price | Last price on that name. |
| Vol × Price | Dollar liquidity proxy on the row. |
| Rel Vol 10D | Volume versus the 10-day average. |
| Net Premium | Net premium flow, calls minus puts. |
| Option Vol | Total options volume on the name. |
These columns are why a name showed up after you moved Fit Score or Premium Collection.
| Column | What you are looking at |
|---|---|
| IV Rank | Current IV in the 52-week range, 0 to 100%. The screenshot prints 38.99% on SPY. |
| IV % | IV percentile. How to Use says this is the share of days IV sat below today. A dash means that cell is empty. |
| IV 30 | 30-day implied volatility. The screenshot prints 12.53% on SPY. |
| Strategy Suggestion | Badges that cleared Fit Score. Each badge has a name and a number. The screenshot shows Iron Condor 53 and Covered Call 51 on SPY. |
Strategy Details
This drawer is the ticker-level read behind a badge. The extra screenshot uses Iron Condor on SPY. Days to Expiry prints 30-45. FIT Score prints 53.23%. Timeframe prints 1D when Monthlies is on. Delta Range prints 15-20. None of those cards is an order.

The first row is Days to Expiry, FIT Score, and Timeframe. Delta Range sits on the next row.
| On the drawer | What you are looking at |
|---|---|
| Days to Expiry | The DTE window for that suggestion. The screenshot prints 30-45. |
| FIT Score | The same 0 to 100 fit as the badge, with two decimals. The screenshot prints 53.23%. |
| Timeframe | The filter window in short form. 1D is Monthlies. The screenshot prints 1D. |
| Delta Range | The delta band for the short strikes. The screenshot prints 15-20. N/A means that structure has no band on this page. |
Market Conditions is Trend and Regime. Advanced Metrics is IV Rank, IV/RV Ratio, and Expected Move. Strike Information appears when Strike Distance is present.
| On the drawer | What you are looking at |
|---|---|
| Trend | Bull, Bear, or a milder label after the word Trend is stripped. The screenshot prints Bear. |
| Regime | The regime badge. The screenshot prints Expansion. How to Use also names Range, Squeeze, and Transition. |
| IV Rank | The same 52-week IV Rank as the table, with two decimals. The screenshot prints 38.99%. |
| IV/RV Ratio | Implied volatility versus realized volatility. The screenshot prints 1.21. |
| Expected Move | A dollar expected move on this ticker. The screenshot prints $32.91. Use Expected Move if you want DEM versus VEM by expiration. |
| Strike Distance | How far the short strike sits from spot, as a percent. The screenshot prints 26.33%. This block hides when the structure has no distance. |
Strategy Quick Reference
This card is a static map of the six badges. It does not rank tickers. Theta Strength is a flame count on the row, not a forecast.

| Strategy | Volatility Condition | Trend | Risk |
|---|---|---|---|
| Short Strangle | High IV, low realized vol | Flat | Unlimited |
| Iron Condor | High IV, low realized vol | Flat | Defined |
| Short Put Spread | High IV, uptrend | Up | Defined |
| Short Call Spread | High IV, downtrend | Down | Defined |
| Cash-Secured Put | Normal IV, low vol | Mild trend | Defined |
| Covered Call | Normal IV, low vol | Mild trend | Defined |
How people actually use it
Read the regime first
Start at SPX GEX and Flip. Open Breakdown if 0DTE disagrees with Monthly. Then look at Strategy Suggestions.
Raise Fit Score
Leave Timeframe on Monthlies. Move Fit Score up from 60% if the table is too wide. Turn Liquidity above $1B on when you only want larger names.
Lock one structure
Open Strategies and leave one box on, such as Iron Condor. Compare that badge with Strategy Quick Reference Risk.
Open the name
Click Ticker for Ticker Explorer, then IV Rank Explorer or Custom Strategies if you want the 1Y clock or a payoff.