How to read the intraday market regime score: timeframes, options flow and dark pool (real SPY example)
SPY printed a -26.50 BEARISH regime score with Mixed conviction. The 5-minute was flat at 0.60 while the 1-hour sat at -45.90, and dark pool flow leaned bullish. Here is how to read every panel.
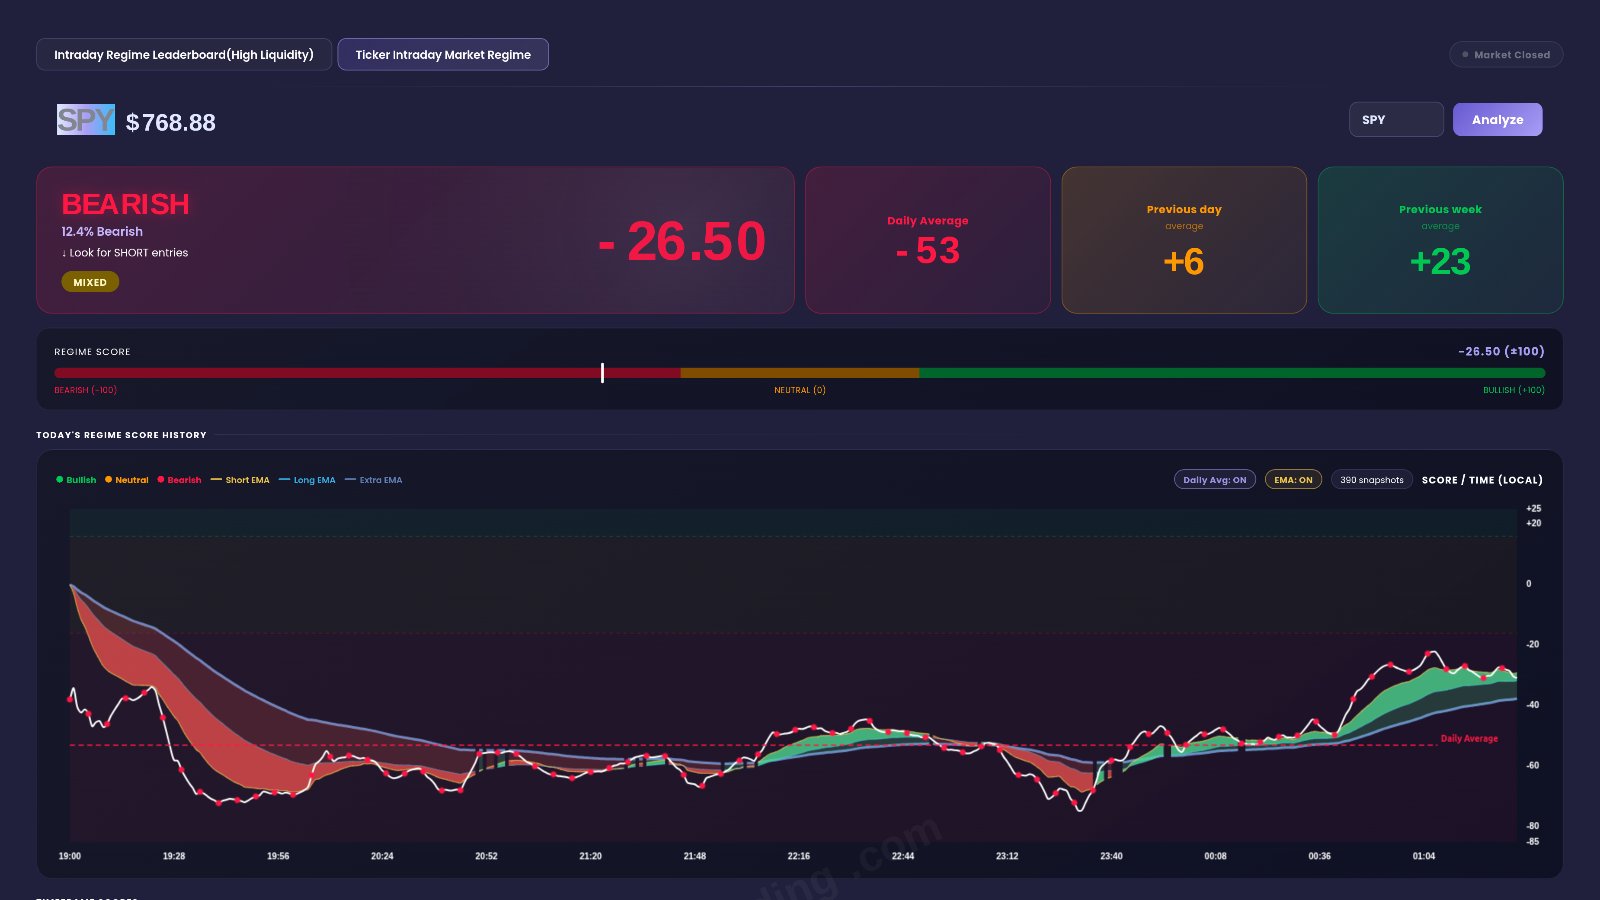
In the latest session, SPY's intraday regime score finished at -26.50. That is BEARISH, with Mixed conviction. Price sat at $768.88, below every session level on the page. But the 5-minute score had climbed back to 0.60 and dark pool flow read Bullish. When one page shows bearish and bullish signals together, you need a clear way to read it, and that is what this guide gives you.
Quick definition first. The Ticker Intraday Market Regime page gives any symbol one score from -100 to +100. Zero means neutral. Positive means bullish pressure. Negative means bearish pressure. The score sorts into a regime: BULLISH (green), NEUTRAL (orange) or BEARISH (red). Conviction tells you how well the inputs agree. High means strong agreement, Mixed means mostly aligned with some friction, and Conflicted means the signals are split. The score blends four areas: price action on three timeframes, options flow, market breadth and dark pool positioning. EZPZ's method is proprietary, so this guide is about reading the score, not building it.
Why one regime score is useful
Most traders juggle a dozen charts and panels during the day. The regime score puts them into one number so you can see the overall state of a ticker at a glance. The number is only the headline, though. The real value is in seeing which parts agree and which don't.
It separates direction from confidence
A score tells you the lean. Conviction tells you how much to trust that lean. SPY's -26.50 with Mixed conviction is a bearish lean with some friction. Earlier in the session the page showed readings like -76.3 with High conviction. Both were "BEARISH", but they were very different readings.
It shows when timeframes disagree
Fast charts react first. Slow charts confirm. When the 5-minute turns up while the 1-hour stays down, the page is showing a bounce inside a weaker trend, not a new trend. You can watch that tension in real time.
It adds context price charts can't show
- Options flow shows how dealers and options buyers are positioned.
- Dark pool shows the balance of off-exchange dollar volume.
- Breadth shows whether the wider market supports the move.
What the page shows for SPY
Main banner and gauge
The banner read BEARISH, -26.50, 12.4% Bearish, with a MIXED conviction chip. The gauge needle sat left of center, in bearish territory but far from the -100 end.
Daily, previous-day and previous-week averages
The Daily Average was -53 (BEARISH). The previous day averaged +6 (NEUTRAL) and the previous week +23 (BULLISH). So the session was a clear step down from the prior baseline.
Timeframe scores
The 5-minute read 0.60 (NEUT), the 15-minute -11.60 (NEUT) and the 1-hour -45.90 (BEAR). Only the slowest chart was firmly bearish.
Indicator breakdown (1-hour)
Price was below VWAP at $770.18. It sat at 16% of its Donchian channel, with 0/3 EMAs above. Structure was Ranging. RSI was in the bearish zone at 27.9, the MACD histogram was -1.0819 and rate of change was -1.06%. ATR was Expanding at a ratio of 1.25, and price was 10% into its Bollinger Band. The one outlier was OBV, which showed a Rising trend.
Options flow
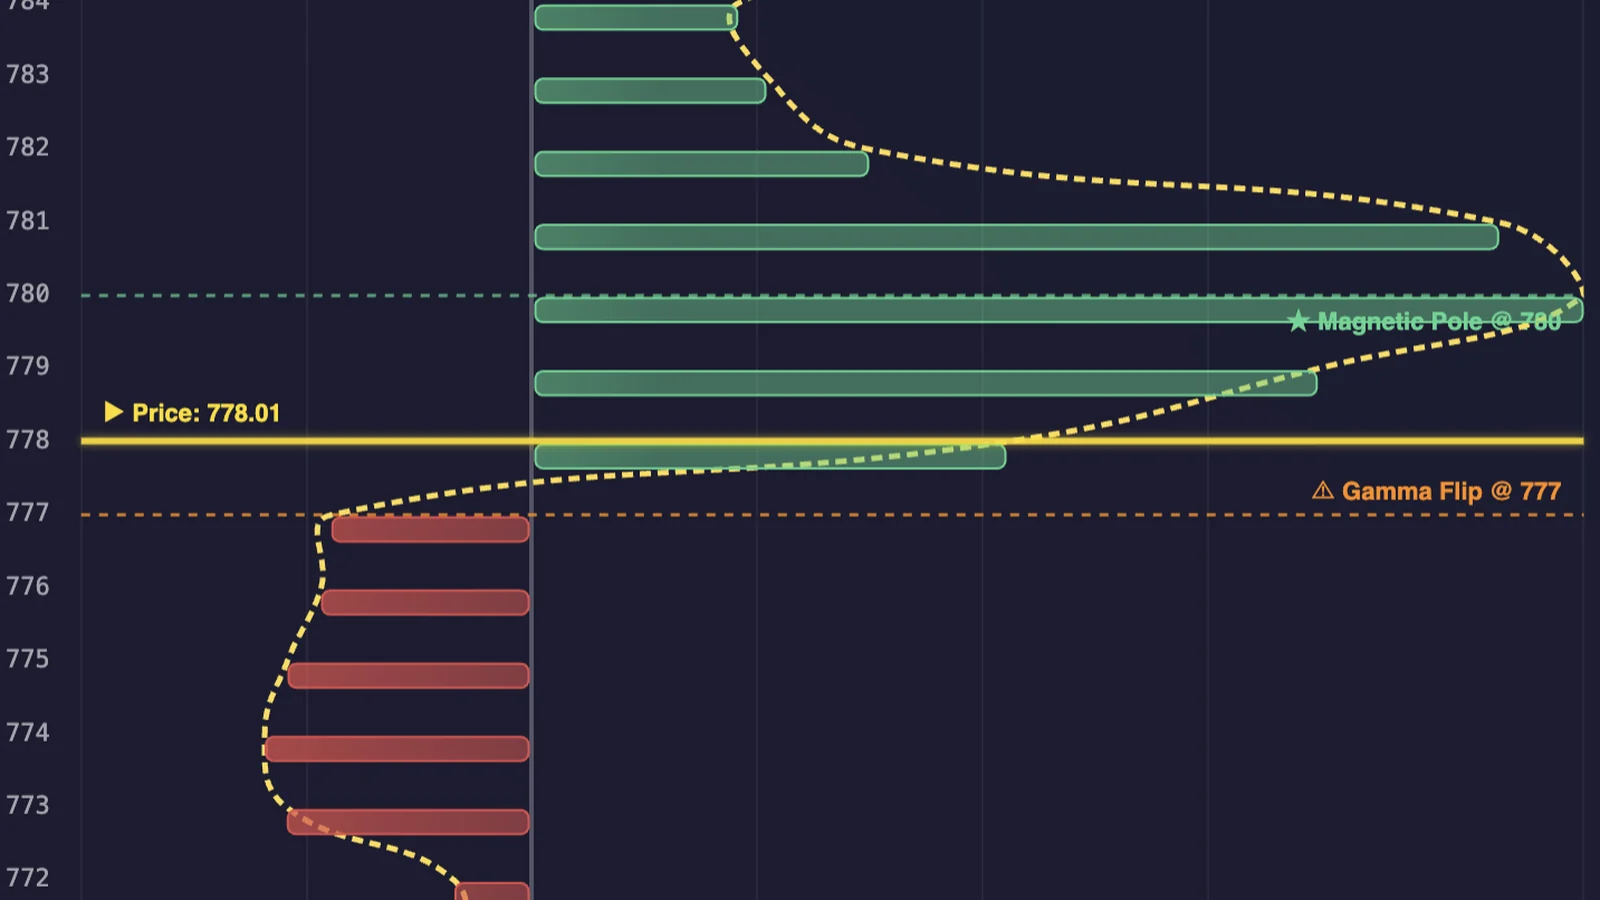
The Flow Signal read Bearish. Net GEX was -$3.96B (Negative). DEX read Net Short Delta. Net Flow showed calls at -$55.23M and puts at -$16.19M. The GEX flip level was $776, above the $768.88 price. Nearest-expiry flow was flat at zero. For more on gamma, see how to read gamma exposure.
Dark pool, breadth and session levels
Dark pool read Bullish, with a major level at $773.4. Breadth was split: only 1/7 mega-caps were above VWAP, but 8/11 sectors were, and VIX was low at 14.55. Price was below the PDL at $775.95, the ORL at $774.47 and the PML at $774.72.
How to use the Ticker Intraday Market Regime page on EZPZ: a 10-minute routine
This is the exact routine, with the real screens from the latest session. The yellow numbers show where to look.
Read the headline and conviction
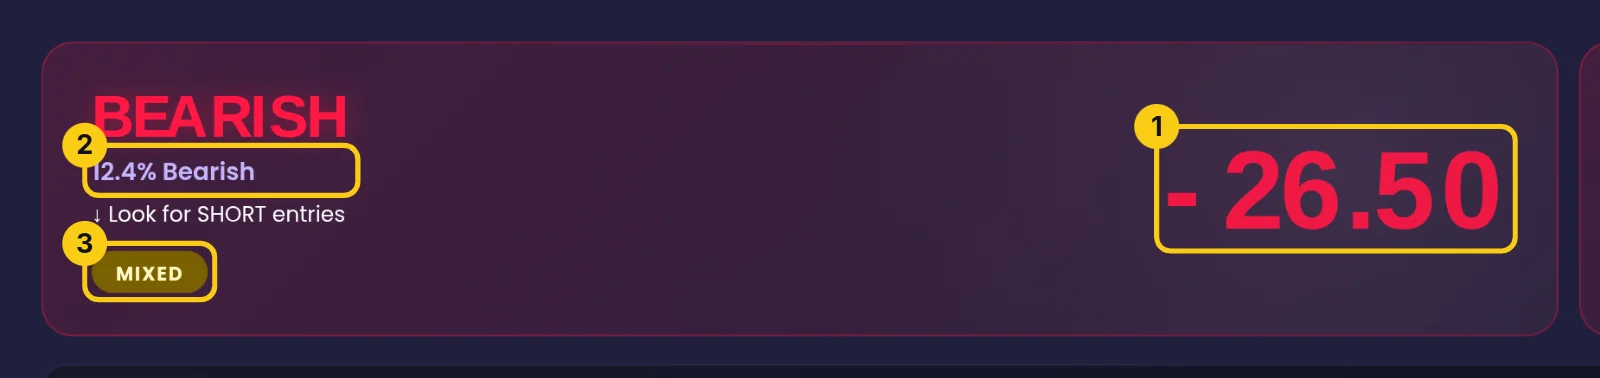
Open the Intraday Market Regime page and enter the ticker. (1) is the score, -26.50. (2) is the regime, 12.4% Bearish. (3) is conviction, MIXED. Read these three together: a moderate bearish lean with some friction underneath.
Compare against the averages
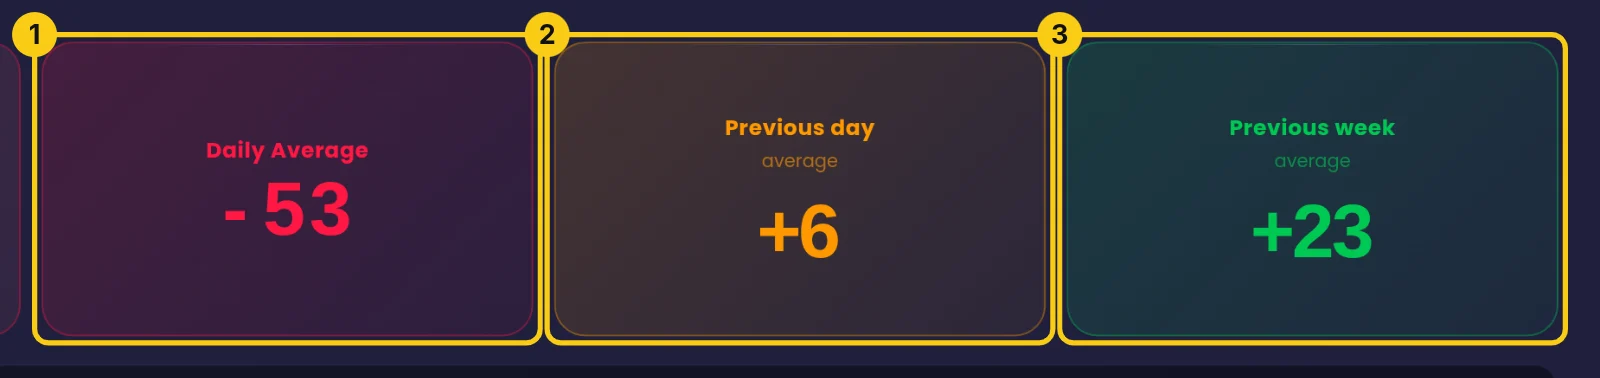
(1) Daily Average -53 is the mean of every snapshot so far. (2) Previous day average +6 and (3) previous week average +23 are your baselines. The live -26.50 is above the -53 daily mean, so the latest reading is less bearish than the session overall, but still well below the prior day and week.
Scan the score history chart
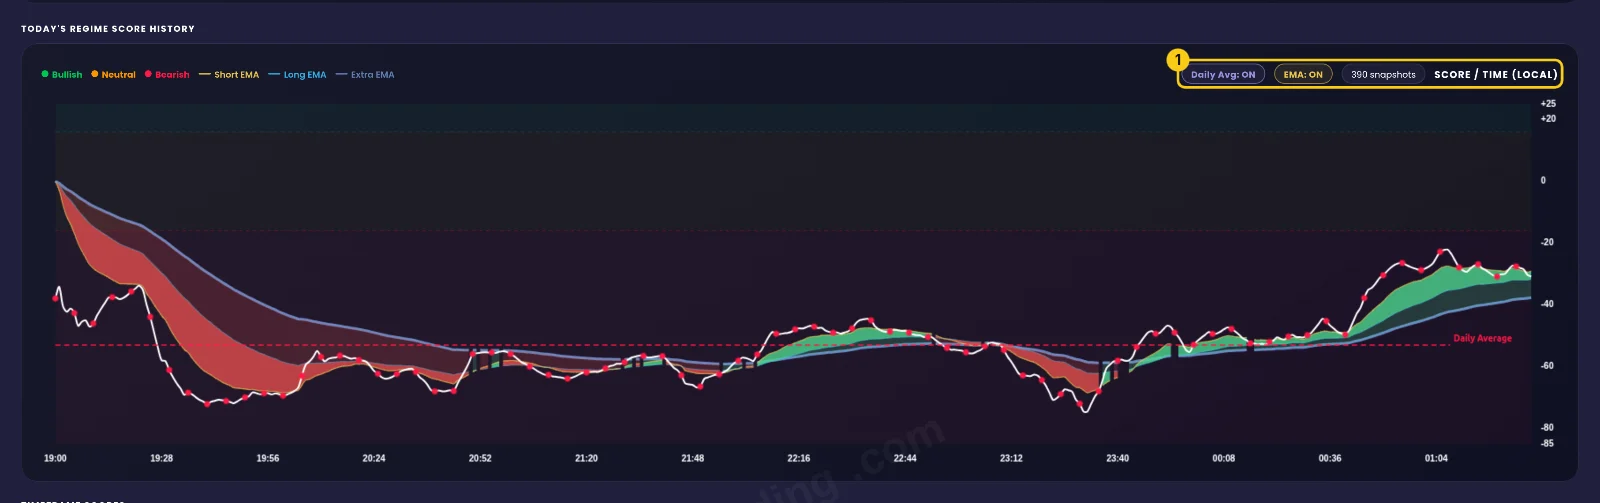
(1) shows the toggles, Daily Avg: ON and EMA: ON, and the 390 snapshots on the chart. The score spent the session in BEARISH territory, dipping as low as -76.3, and then climbed late. The latest Short EMA was -29.08, the Long EMA -31.73 and the Extra EMA -37.64. With the score above the Extra EMA, the ribbon turned green. That is an improving trend inside a bearish regime.
Check timeframe alignment
(1) 5-MINUTE 0.60 NEUT, (2) 15-MINUTE -11.60 NEUT, (3) 1-HOUR -45.90 BEAR. The fast charts had gone flat while the 1-hour stayed bearish. On the page, that pattern looks like a short-term pause inside a slower downtrend.

Drill into the 1-hour indicators
(1) VWAP Below $770.18 puts price under the session's average. (2) DONCHIAN 16% of range puts it near the bottom of its channel. (3) EMA STACK 0/3 above means no moving average support. (4) STRUCTURE Ranging means swings had not formed a clean trend. OBV Rising is the one bullish detail worth noting.

Read the options flow panel
(1) Flow Signal Bearish is the panel summary. (2) Net GEX -$3.96B Negative describes an environment where dealer hedging can widen moves. (3) Net Flow C -$55.23M P -$16.19M, labelled Mixed, shows net selling on both sides, heavier on calls. Price under the $776 flip fits the negative gamma reading.

Weigh in the dark pool
(1) Signal Bullish means buy-side dollar volume led. (2) Major DP Level $773.4 is display only and not scored, but it is a useful reference just above price. (3) Bull / Bear Premium $4326.12M / $4094.3M shows a fairly narrow edge. For more context, check DarkVol Leaders.

Check again before the close
Refresh late in the session. Late in this one, the 1-hour moved from -64.7 to -45.90, and that alone lifted the final score to -26.50. Compare tickers on the Intraday Regime Leaderboard.
Reading this session in plain English
SPY spent the session in a bearish regime. Price was under every prior-day, opening-range and pre-market level, options flow was bearish and only 1/7 mega-caps held VWAP. Late in the session the fast timeframes flattened, the history ribbon turned green and conviction stayed Mixed. Dark pool buying and a 14.55 VIX were the counterweights.
- If the 5-minute and 15-minute stay near zero while the 1-hour stays at -45.90, the page reads as a bearish regime that is pausing.
- If the score climbs toward NEUTRAL and price reclaims the $770.18 VWAP, the page reads as the bearish lean fading.
- If conviction moves from Mixed to High with all three timeframes negative, the page reads as a cleaner, aligned bearish state, like the stretches near -76.3.
- If conviction turns Conflicted, as it did briefly near -19.6, the page reads as signals split, and the number deserves less trust.
- If price trades back above the $776 flip, the options context reads as less amplifying.
Common mistakes
- Reading the label without conviction. BEARISH with Mixed conviction is not the same as BEARISH with High conviction.
- Trusting the 5-minute alone. A 0.60 five-minute score next to a -45.90 hourly is a pause, not a reversal.
- Ignoring the ribbon color. A green ribbon in a bearish regime shows improvement, not a bullish regime.
- Treating dark pool as the final word. A Bullish dark pool signal with a narrow $4326.12M vs $4094.3M edge is one input among many.
- Forgetting breadth. 8/11 sectors above VWAP looks healthy, but only 1/7 mega-caps above VWAP is a heavy drag on an index like SPY.
Tools used in this post
These EZPZ tools pair well with the regime page for finding and checking ideas.
Which plan you need
| Tool | Plan | Free delayed page |
|---|---|---|
| Intraday Regime Leaderboard | Premium | None |
| DarkVol Leaders | Pro | Yes |
| Gap Up and Down | Pro | Yes |
| Range Change Leaders | Pro | Yes |
| Historical Volatility | Pro | Yes |
FAQ
What does a -26.50 regime score mean?
It means a moderate bearish lean on a -100 to +100 scale. For SPY it came with Mixed conviction, so the signals were mostly but not fully aligned.
Why was the score bearish when the 5-minute was positive?
The 1-hour was -45.90 and options flow read Bearish. A flat 0.60 five-minute score doesn't outweigh a bearish slow chart and bearish flow.
What does the green ribbon mean in a bearish regime?
The score was above its Extra EMA (-26.50 vs -37.64). That shows the score was improving relative to its recent trend, while the regime stayed BEARISH.
How should I treat the dark pool major level?
The $773.4 level is display only and not scored. Use it as a reference price near the action, not as part of the score.
How is the score calculated?
EZPZ's method is proprietary. The page shows the inputs it draws on (timeframes, options flow, breadth and dark pool) so you can see what is driving the reading. For broader context, visit the Learn center.