How to read S&P 500 volume surge trades: on-balance dollar volume, sector imbalance and top stocks.
In the latest data, S&P 500 volume surge trades show -$653.7M on-balance dollar volume. Technology leads the selling at -352.7M, Financials lean buy at 144.3M, and NVDA sits in the Top Sell Imbalance table while AAPL shows up on the buy side.
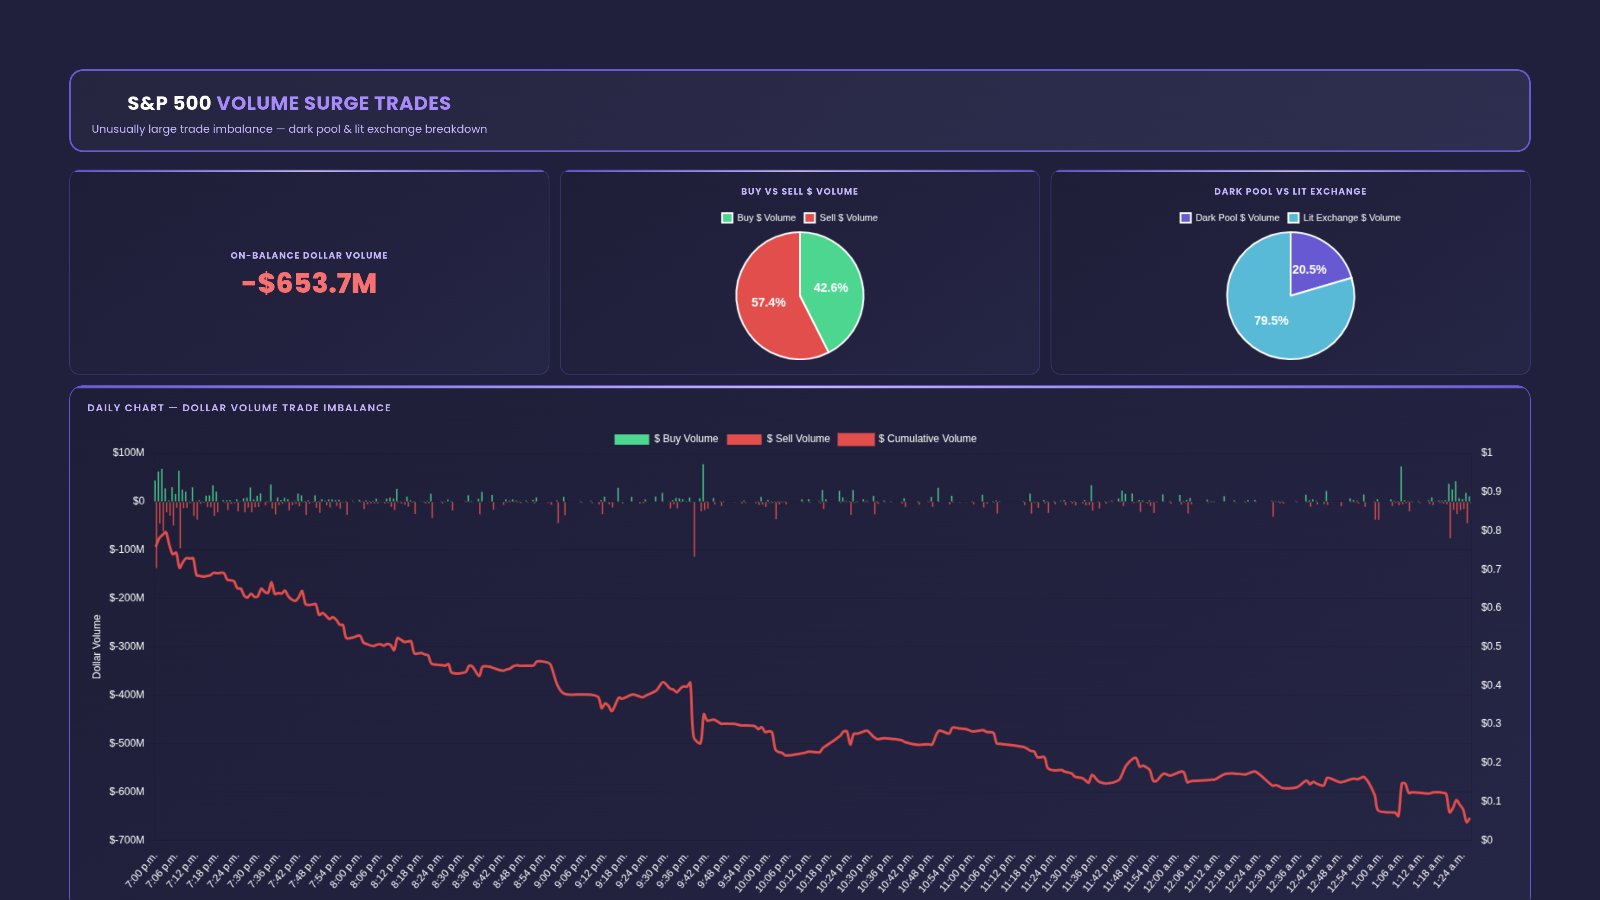
In the latest data, the big trades across the S&P 500 leaned hard to the sell side. On-balance dollar volume reads -$653.7M, Technology alone shows -352.7M, and NVDA sits in the Top Sell Imbalance table at -$115.36M. Yet Financials lean buy at 144.3M, and AAPL shows a +20.2M buy imbalance. That mix of broad selling and pockets of buying is exactly what the S&P 500 Volume Surge Trades tab is built to show you at a glance.
No account yet? You can open the free delayed Volume Surge Trades page and follow along.
Quick definition first. A volume surge trade is an unusually large trade in an S&P 500 stock. The page sorts that dollar volume into buy $ volume (aggressive buying) and sell $ volume (aggressive selling). The imbalance is the gap between the two. When it is positive, buyers had the bigger dollars. When it is negative, sellers did. Dark pool means trades done off the public exchanges. Lit exchange means trades done on public exchanges with visible order books.
-$653.7M
-352.7M
144.3M
Why big-trade imbalance matters to a swing trader
Price tells you what happened. This tab tells you who was pushing harder with real size. When the largest trades lean one way, it is a sign of where heavy money is pressing. For a swing trader, the most useful read is a change: sellers in control one day, buyers the next.
Market-wide pressure in one number
The headline number sums up the whole index. A large negative reading like -$653.7M says sell-side dollars led across S&P 500 surge trades. A positive reading would say the opposite. It is the fastest way to see whether the big-trade tone is risk-on or risk-off.
Broad or narrow?
A selling reading spread across most sectors is a different picture from one sector dragging the total. The sector table answers that question. In the latest data, most sectors show negative values, but Financials and Communication Services show positive ones. So the selling is broad, not total.
Standout names
The stock tables put names on the flow. They show where the biggest buy and sell imbalances sit. Use them to:
- Spot big names going against their sector (AAPL on the buy side while Technology leans sell).
- See where selling is concentrated (INTC, NVDA and AMZN in the sell table).
- Build a short watchlist to check on a chart.
The tab, top to bottom
S&P 500 VOLUME SURGE TRADES
The top panel carries the title and the subtitle "Unusually large trade imbalance — dark pool & lit exchange breakdown." Under it are four parts.
- ON-BALANCE DOLLAR VOLUME -- the net of buy $ volume and sell $ volume across surge trades. It reads -$653.7M in the latest data. The minus sign means sellers had the bigger dollars.
- BUY VS SELL $ VOLUME -- a pie splitting buy dollars from sell dollars. In the latest data, buy $ volume is $1.87B (42.6%) and sell $ volume is $2.53B (57.4%). A lopsided pie is a stronger lean than a near-even one.
- DARK POOL VS LIT EXCHANGE -- a pie splitting off-exchange dollars from on-exchange dollars. In the latest data, dark pool is $15.78M (20.5%) and lit exchange is $61.36M (79.5%). A bigger dark pool slice points to more block-style activity.
- DAILY CHART — DOLLAR VOLUME TRADE IMBALANCE -- a chart of buy and sell dollar volume over time, with a running net line. Read the line's direction: a steady slide means selling kept coming, not a single burst.
LARGE TRADE IMBALANCE FOR SECTOR STOCKS IN S&P 500
This table breaks the imbalance out by sector. Each sector is a column. Each row is a measure. The columns are:
- # -- the row label: On-Balance $ Notional, Buy Dollar Volume or Sell Dollar Volume.
- CONSUMER DISCRETIONARY -- On-Balance -166.1M, Buy 202.2M, Sell 368.3M.
- TECHNOLOGY -- On-Balance -352.7M, Buy 946.4M, Sell 1.3B. The biggest dollars on the table, both ways.
- HEALTHCARE -- On-Balance -159.5M, Buy 30.8M, Sell 190.4M. Very one-sided.
- REAL ESTATE -- On-Balance -38.6M, Buy 14.2M, Sell 52.8M.
- CONSUMER STAPLES -- On-Balance -69.3M, Buy 149.9M, Sell 219.2M.
- INDUSTRIALS -- On-Balance -3.5M, Buy 27M, Sell 30.4M. Nearly balanced.
- MATERIALS -- On-Balance -13.3M, Buy 46.9M, Sell 60.2M.
- UTILITIES -- On-Balance -33.5M, Buy 47.5M, Sell 81M.
- FINANCIALS -- On-Balance 144.3M, Buy 191.1M. Sell is $46.77M in the latest data. The strongest buy lean.
- COMMUNICATION SERVICES -- On-Balance 46.4M, Buy 212.6M. Sell is $166.20M in the latest data.
- ENERGY -- On-Balance -7.8M, Buy 5.9M. Sell is $13.67M in the latest data. The smallest dollars on the table.
How to read a column: start with On-Balance $ Notional for direction, then look at Buy and Sell for size. Read Technology across: 946.4M bought, 1.3B sold, -352.7M net. Lots of two-way trading, but sellers had more. Now Healthcare: only 30.8M bought against 190.4M sold, for -159.5M. Smaller dollars, but far more one-sided.
On-Balance $ Notional by S&P 500 sector
LARGEST TRADE IMBALANCE BY STOCK
This panel has two tables side by side: TOP BUY IMBALANCE and TOP SELL IMBALANCE. Both share the same columns:
- SYMBOL -- the ticker.
- TOTAL BUY $ VOLUME -- the dollars of surge trades on the buy side for that stock.
- TOTAL SELL $ VOLUME -- the dollars of surge trades on the sell side.
- $ IMBALANCE -- the net. A plus sign means buyers led. A minus sign means sellers led. This is the column the table is ranked on.
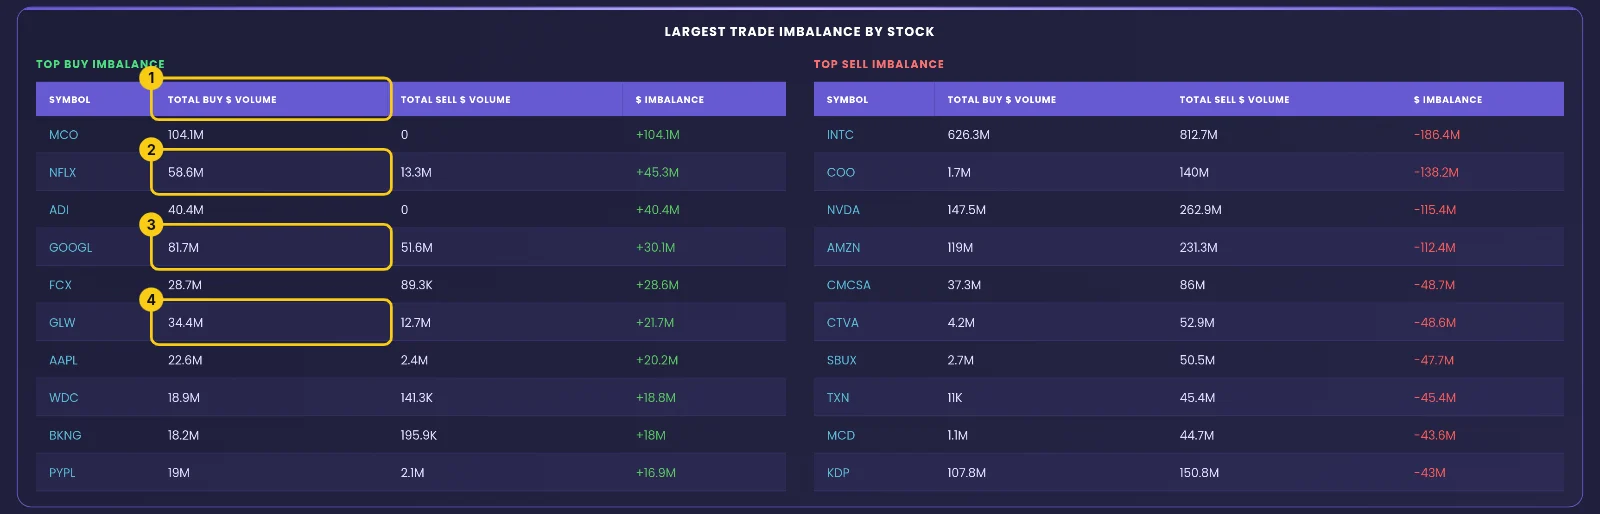
Read a buy-side row: NFLX shows 58.6M bought, 13.3M sold, and a +45.3M imbalance. Buyers led, but sellers were present. Compare AAPL: 22.6M bought, 2.4M sold, +20.2M. A smaller imbalance, but almost all of it on one side. GOOGL shows 81.7M bought and 51.6M sold for +30.1M -- heavy two-way trading with a buy lean.
Read a sell-side row: NVDA shows $147.54M bought and $262.91M sold, an imbalance of -$115.36M. INTC leads the sell table at -$186.39M, with $626.35M bought against $812.73M sold. AMZN reads -$112.35M. Those three line up with the negative Technology and Consumer Discretionary columns above.
Also note one-sided rows like TXN: $11.0K bought against $45.37M sold. When one side is close to zero, the flow ran almost entirely one way.
How to use the Volume Surge Trades page on EZPZ: a 3-minute routine
This is the exact routine, with the real screens from the latest data. The yellow numbers show where to look.
Read the headline and both pies
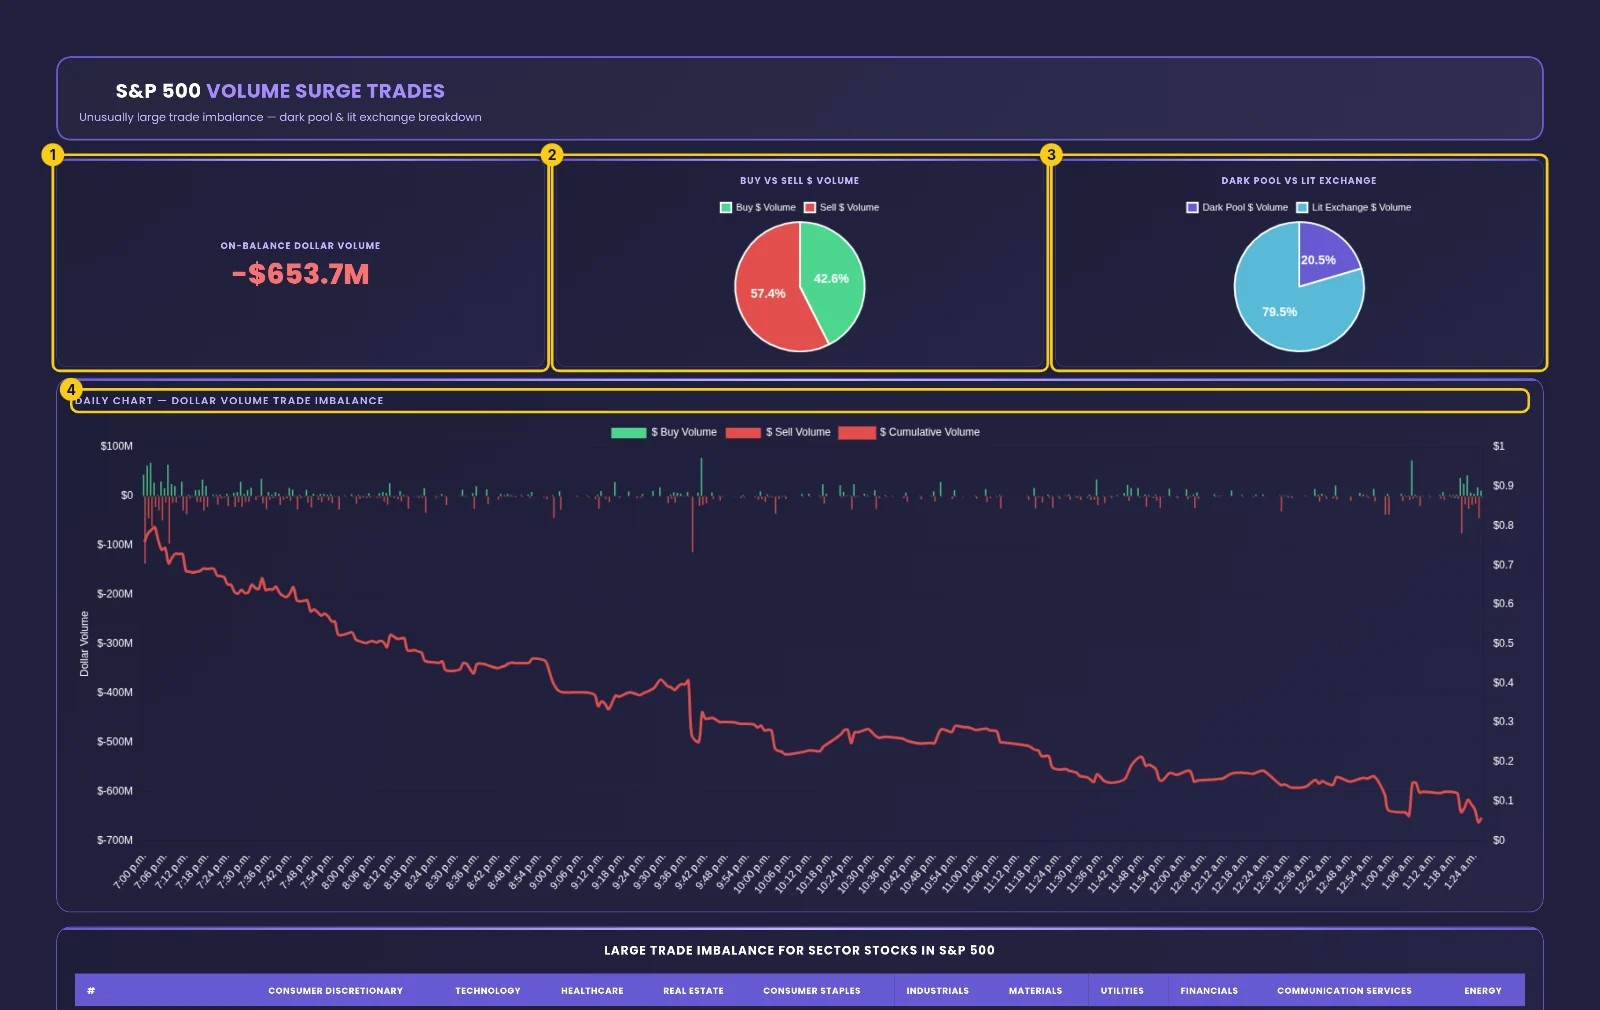
Open the Volume Surge Trades tab. (1) ON-BALANCE DOLLAR VOLUME reads -$653.7M, so sell-side dollars led. (2) BUY VS SELL $ VOLUME shows how lopsided that lean is, and (3) DARK POOL VS LIT EXCHANGE shows how much ran off-exchange. Then check (4) DAILY CHART — DOLLAR VOLUME TRADE IMBALANCE to see whether the net line slid steadily or jumped once.
Find the sectors driving the total
Scan the On-Balance $ Notional row. (1) CONSUMER DISCRETIONARY reads -166.1M and (2) HEALTHCARE reads -159.5M, two of the heaviest sell leans. (3) CONSUMER STAPLES shows -69.3M, and (4) MATERIALS only -13.3M, close to balanced. Then look for the positive columns, like Financials at 144.3M, to see where buyers held ground.

Put names on the flow
Move to the stock tables. (1) TOTAL BUY $ VOLUME is the buy-side dollars for each name. (2) 58.6M is NFLX's buy dollars, (3) 81.7M is GOOGL's, and (4) 34.4M is GLW's. Compare each with its sell dollars and the $ IMBALANCE column, then check the Top Sell Imbalance table for names like NVDA and AMZN.
Check again before the close
Reload the page late in the day. See whether the headline number, the sector leaders and the top names still read the same way. A lean that holds is a different picture from one that flips.
Reading the page in plain English
Put the parts together. The headline gives direction. The pies give how lopsided and where. The sector table shows breadth. The stock tables show names.
- If on-balance dollar volume is deeply negative and most sector columns are negative, the page reads as broad big-trade selling. That is the latest picture at -$653.7M.
- If the headline is negative but one or two sectors are positive, the page reads as rotation inside the selling -- here, Financials at 144.3M and Communication Services at 46.4M.
- If a stock sits on the buy side while its sector leans sell, the page reads as a standout name against the tide, like AAPL at +20.2M while Technology reads -352.7M.
- If buy and sell dollars are both large with a modest net, like GOOGL's 81.7M against 51.6M, the page reads as heavy two-way trade with a lean.
- If one side is near zero, like TXN's $11.0K bought, the page reads as one-way flow.
What this data cannot tell you
- Direction. A sell imbalance shows who pressed harder with size. It does not tell you where price goes next.
- Timing. The tab shows pressure that already traded. It does not say when, or if, price reacts.
- Intent. A big buy or sell can be a hedge, a rebalance or a new position. The tab shows the dollars, not the reason. EZPZ's method is proprietary.
Common mistakes
- Reading only the headline. -$653.7M hides sectors that lean buy, like Financials.
- Ignoring the size columns. A net of -352.7M on 1.3B of selling is different from -159.5M on 190.4M of selling.
- Treating a buy imbalance as a buy signal. It is a reading of flow, not advice.
- Skipping the venue pie. The dark pool vs lit split adds context to any lean.
- Checking once. The value is in seeing whether the lean holds or changes.
Tools used in this post
These EZPZ tools pair well with the Volume Surge Trades tab when you want to dig into a name or a move.
Which plan you need
| Tool | Plan | Free delayed page |
|---|---|---|
| Volume Surge Trades | Pro | Yes |
| DarkVol Leaders | Pro | Yes |
| Gap Up and Down | Pro | Yes |
| Range Change Leaders | Pro | Yes |
| Historical Volatility | Pro | Yes |
FAQ
What does on-balance dollar volume mean?
It is the net of buy $ volume and sell $ volume across S&P 500 surge trades. A negative reading, like -$653.7M, means sell-side dollars led.
What is the difference between dark pool and lit exchange?
Lit exchange trades happen on public exchanges with visible order books. Dark pool trades happen off-exchange, often in larger blocks.
How do I see which sector drives the move?
Read the On-Balance $ Notional row of the sector table. The largest values either way, like Technology at -352.7M or Financials at 144.3M, matter most.
What does $ IMBALANCE mean for a stock?
It is the net of that stock's buy and sell surge dollars. NVDA at -$115.36M means sellers led; AAPL at +20.2M means buyers led.
Can I use the page without a Pro plan?
Yes. The free delayed page shows the same tab with a delay. The live tab is on the Pro plan.