
Learn Center
Gamma Exposure (GEX)
A market wide measure of how much options dealers may need to buy or sell stock as prices move, and why it can make markets calmer or more volatile.
What is gamma exposure?
Gamma exposure, often shortened to GEX, estimates how much options dealers may need to buy or sell the underlying as price moves. It combines open interest with each contract's gamma. Positive GEX is usually read as a calmer, mean-reverting backdrop. Negative GEX is usually read as a faster, trend-prone one.
Traders look at GEX by strike, not just the total. A large positive reading at one strike often gets treated as a magnet or a ceiling. A large negative reading often gets treated as fuel if price is already moving. The strikes with the biggest positive and negative readings are commonly called the Call Wall and the Put Wall. Where net GEX changes sign between neighboring strikes is a flip, a place people watch when they care about a shift from calm to fast, or the reverse.
Expected move is a separate overlay. It marks a high and a low around spot so you can see whether the walls sit inside that range or outside it. Open interest on the same row tells you whether the GEX number is sitting on a crowded strike or a thin one. None of this is a buy or sell signal. Dealers hedge. Spreads exist. News can overwhelm the whole picture.
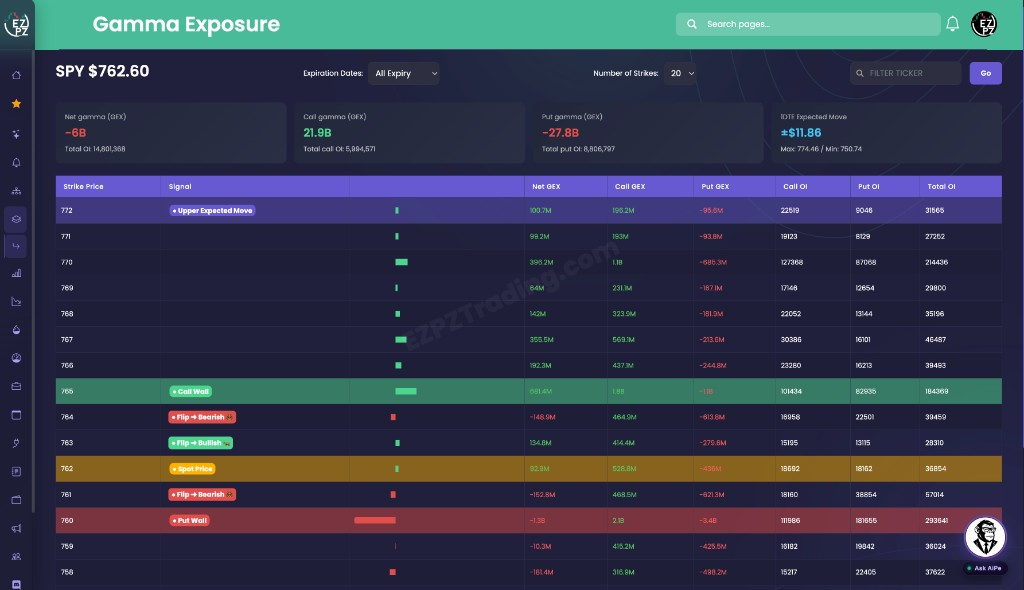
On EZPZ, Gamma Exposure is that strike table for one ticker. Search a symbol, pick Expiration Dates, then Number of Strikes. The four cards summarize the view. The table lists one strike per row with Signal badges for Call Wall, Put Wall, Spot Price, expected move, and flips. Ticker Explorer puts GEX and DEX charts on a one-symbol dashboard next to quote, flow, and unusual activity. Market Maker Exposure is the SPX Flip Level chart with Call Wall, Put Wall, and Expected Move(VEM) and DEM. Market Cross Flow is the SPY, SPXW, and QQQ GEX grid next to candles. Greeks Heatmap is the strike-by-expiration grid with Gravity Magnet Score. Option Depth Flow is the searchable strike-by-time Bubble or Gradient chart. Largest Premium By Tickers is the Bullish Flow / Bearish Flow premium leaderboard when you do not have a ticker yet. Index Trader is the index dashboard with Premium Traffic Lights. Top 20 Optionable ranks listed-option names by Vol. * Price. Market Wave is the Current Day chart of Net Call Premium versus Net Put Premium. Net Flow Graph is one ticker you search with Filter ticker, plus Cumulative Volume Delta. Historical Net Premium is the 15D Cumulative lookback with a daily table. 0DTE Graph is the same-day premium chart with Filter ticker. The 0DTE dropdown is the lock. Weekly-DTE Graph is the WTE chart of premium that expires by Friday. 7-DTE Graph is the 7DTE chart of premium in the next 7 days. Supply and Demand X-ray is the ITM Call and Put chart of Price, Supply, and Demand. Money Sentiment is Bought Ratio, Net Sentiment, and Netflow Graph for one ticker. Net Premium Heatmap is the strike-by-expiration grid of Net Premium for one ticker. Movers and Shakers Tide is that same chart job for about 18 mega-cap names. Option Chain is the call and put book, where GEX is a column on a contract, not this wall map. Live Flow is the tape of prints. Unusual Activity keeps only large, sweep, and block prints. Unusual Activity Intraday is the session scan with a date range. $1M Plus Flow keeps only million-dollar premium. 0DTE Flow keeps only prints that expire today. SPX and SPY Flow locks the tape to SPX, SPXW, and SPY. GEX Heatmap is the strike-by-expiration GEX grid with a GEX Details table. GEX and DEX is the Intraday GEX and DEX chart pair with Gamma Flip. Spot Gamma and Delta is the ($) Open Interest versus ($) Volume bar pair with a Spot line. Expected Move is the DEM and VEM band chart by expiration. Put to Call Ratio is the Intraday Put/Call Ratio chart of Traded PCR, OI PCR, and Sentiment PCR. Max Pain is Intraday Max Pain with O-Max Pain, P-Max Pain, and V-Max Pain. Open Interest Scan is the OI per Strike and OI per Expiration chart pair. Volume Scan is the Volume by Strike and Volume by Expiration chart pair. Volatility Analysis is Volatility By Open Interest, Open Interest, and Implied Volatility Smile. IV Rank Explorer is Current IV (30D), IV Rank (1Y), period IV Rank, and IV Percentile (1Y) plus the IV Rank chart. Historical Volatility is 10D through 90D Volatility versus Price. Volatility Surface 3D is Raw Contracts and Smoothed Mesh for one ticker.
How Gamma Exposure works on EZPZ
Each row is one strike: the GEX split, the open interest split, and the Signal badges that mark walls, spot, expected move, and flips. It is not a score. Most people start with the four cards, then Call Wall, Put Wall, and Spot Price. If a strike looks crowded, read Net GEX, Call GEX, Put GEX, and Total OI next. When the table is too long, tighten Number of Strikes. When you only care about one week, change Expiration Dates.
How this differs from the option chain
Option Chain is the listed calls and puts for one ticker and one expiration. GEX there is a column on a contract. This page is the strike map: net, call, and put GEX, with Call Wall, Put Wall, Spot Price, expected move, and flip badges. Use the chain to see the book. Use this page to see the walls. Use Ticker Explorer when you want GEX and DEX charts next to quote, PCR, and unusual activity for the same symbol. Use Largest Premium By Tickers when you still need a name from Bullish Flow or Bearish Flow. Use Live Flow when you want the prints. Use Unusual Activity when you only want Large, Sweep, and Block. Use Unusual Activity Intraday when you want a date window on those same kinds of rows. Use $1M Plus Flow when you only want million-dollar premium. Use 0DTE Flow when you only want prints that expire today. Use SPX and SPY Flow when you only care about S&P 500 positioning.
Anatomy of a strike
Read a row left to right: the strike, the Signal badges, the GEX bar, then the numbers. You do not need every column on every strike. Use the tabs if you want a map of the fields.
These columns answer which strike you are looking at, and why it is marked.
| Column | What you are looking at |
|---|---|
| Strike Price | The listed strike. Rows are ordered from high strike to low strike. |
| Call Wall | The strike with the largest positive Net GEX on the table. The row is green. |
| Put Wall | The strike with the most negative Net GEX on the table. The row is red. |
| Spot Price | The strike nearest the last price on the ticker badge. The row is amber. |
| Upper Expected Move Lower Expected Move | The strikes nearest the expected-move high and low. Those rows are purple. |
| Flip Bullish Flip Bearish | Net GEX changed sign from the strike above. Bullish is a move into positive GEX. Bearish is a move into negative GEX. |
These columns tell you how large the exposure is, and which way it leans.
| Column | What you are looking at |
|---|---|
| GEX bar | The unnamed bar next to Signal. Green grows with positive Net GEX. Red grows with negative Net GEX. It is relative to the other rows on screen, not a second score. |
| Net GEX | Call GEX plus Put GEX at that strike. Green is positive. Red is negative. |
| Call GEX | Call-side gamma exposure at that strike. |
| Put GEX | Put-side gamma exposure at that strike. |
These columns tell you whether the GEX number sits on a crowded strike.
| Column | What you are looking at |
|---|---|
| Call OI | Call open interest at that strike. |
| Put OI | Put open interest at that strike. |
| Total OI | Call OI plus Put OI. A large GEX number on thin open interest is a different picture than the same GEX on a crowded strike. |
The four summary cards
Above the table, four cards summarize the same view you filtered to. They are totals, not a trade.

Cards
- Net gamma (GEX): The net total for the strikes on screen. The subtitle is Total OI. Red is negative. Green is positive.
- Call gamma (GEX): Call-side total. The subtitle is Total call OI.
- Put gamma (GEX): Put-side total. The subtitle is Total put OI.
- Expected Move: Labeled with DTE, such as 1DTE Expected Move. The big number is plus or minus dollars. The subtitle is Max and Min.
Toolbar
The toolbar is how you change the map, not how you score it.
- Ticker badge: The underlying and last price. The page starts on SPY until you search.
- Expiration Dates: All Expiry, or one listed expiration. All Expiry is the default.
- Number of Strikes: All, 10, 20, 30, or 50 nearest the last price. 20 is the default.
- Filter ticker / Go: Load another underlying.
How people actually use it
Read the four cards first
Check Net gamma, then Call gamma versus Put gamma, then Expected Move. You are reading the backdrop, not picking a strike yet.
Sit with the walls
Find Spot Price. Then Call Wall and Put Wall. Read Net GEX and Total OI on those rows. Leave Number of Strikes on 20 until you need more.
Watch flips near spot
Flip Bullish and Flip Bearish next to Spot Price are the ones people usually mark. A flip far from spot is easier to ignore.
Use it next to the book and the tape
This page is the wall map. Open Option Chain if you want the contracts. Open Live Flow if a strike makes you want the prints.