How to read the Investing Score Leaderboard: zones, Entry Ready and size signals .
SLDE tops the Investing Score Leaderboard at 97.0 in the Elite zone but still reads WAIT. DHT sits lower at 90.3 and shows READY with an Aggressive size label. Here is how to read every column, filter and signal on the tab.
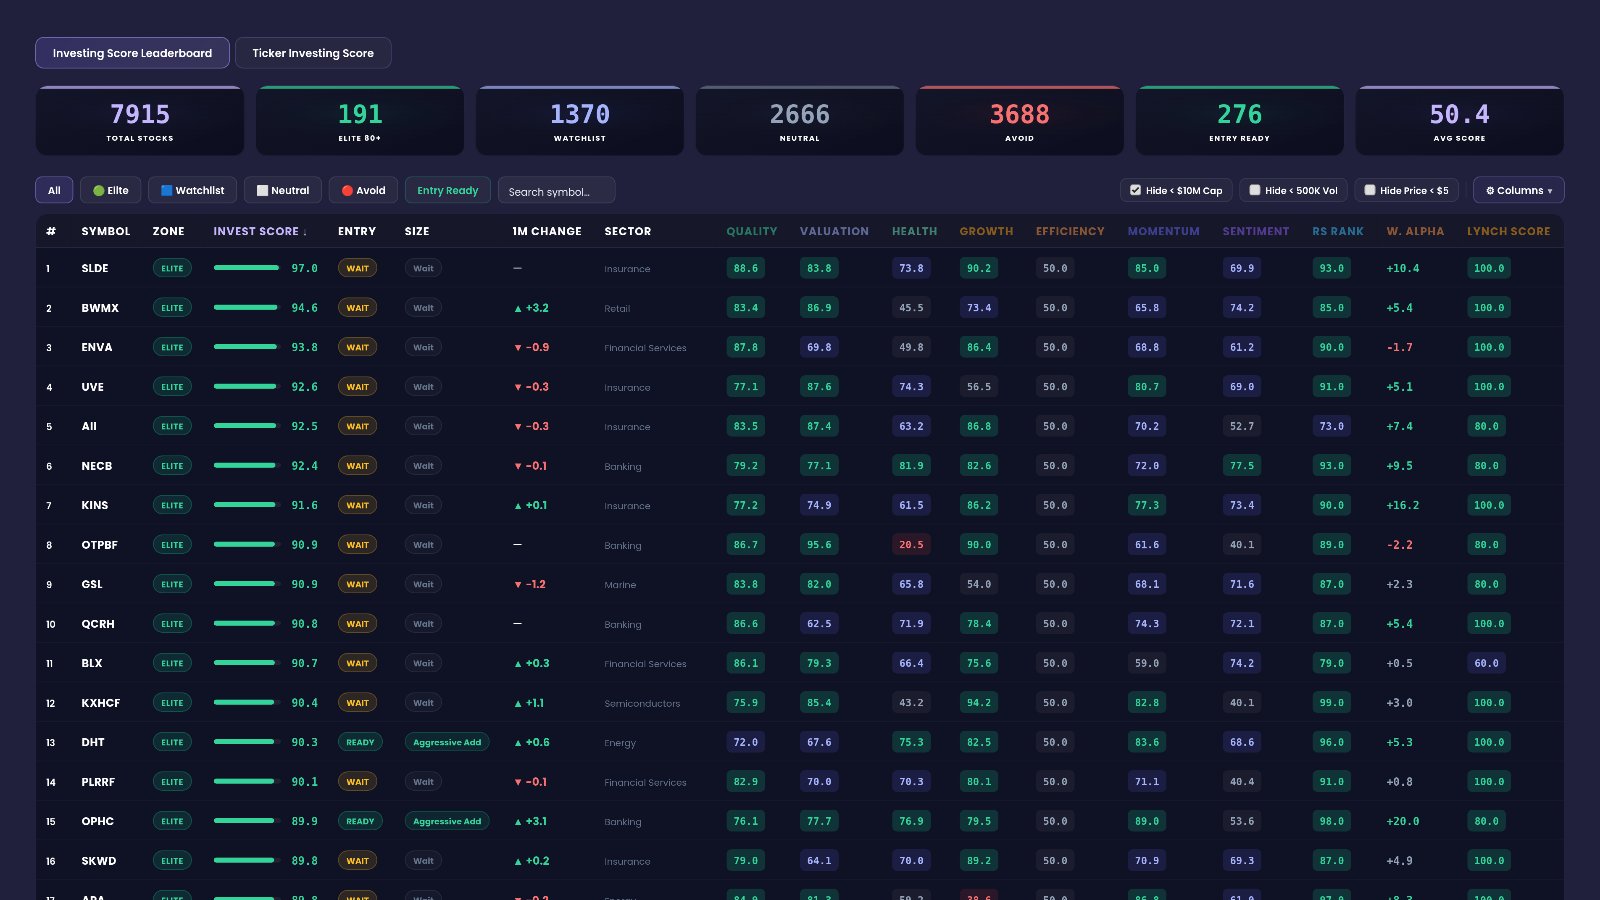
In the latest data, SLDE leads the Investing Score Leaderboard with an Invest Score of 97.0. It sits in the ELITE zone, but its entry reads WAIT. Further down, DHT scores 90.3 and shows READY with an Aggressive size label. That gap between "high score" and "ready now" is the most useful thing this tab shows a swing trader or investor.
Quick definition first. The Investing Score Leaderboard ranks stocks on a 0–100 Invest Score Higher means a stronger investing candidate. The Zone puts each stock in one of four groups: Elite, Watchlist, Neutral or Avoid. The Entry column says whether the timing looks right (READY), not yet (WAIT) or blocked by a red flag (PASS). The Size column turns that into a sizing label. Seven category scores show what drives each stock's number. If you want the single-ticker version of this view, read how to read the Ticker Investing Score.
97.0
191
276
The idea behind the Investing Score Leaderboard
Most screeners answer one question: is this a good company? This tab answers three at once. Is the stock strong? Is now a good moment? And how big a position does the label suggest? Each row puts quality, timing and size side by side.
Quality and timing are separate
The Invest Score and the Zone tell you about quality. The Entry and Size columns tell you about timing. They do not always agree. SLDE is the clearest case. It has the top score on the board at 97.0, but its Entry reads WAIT and its Size reads Wait. The page is saying: strong stock, no timing trigger yet.
The category scores tell the story
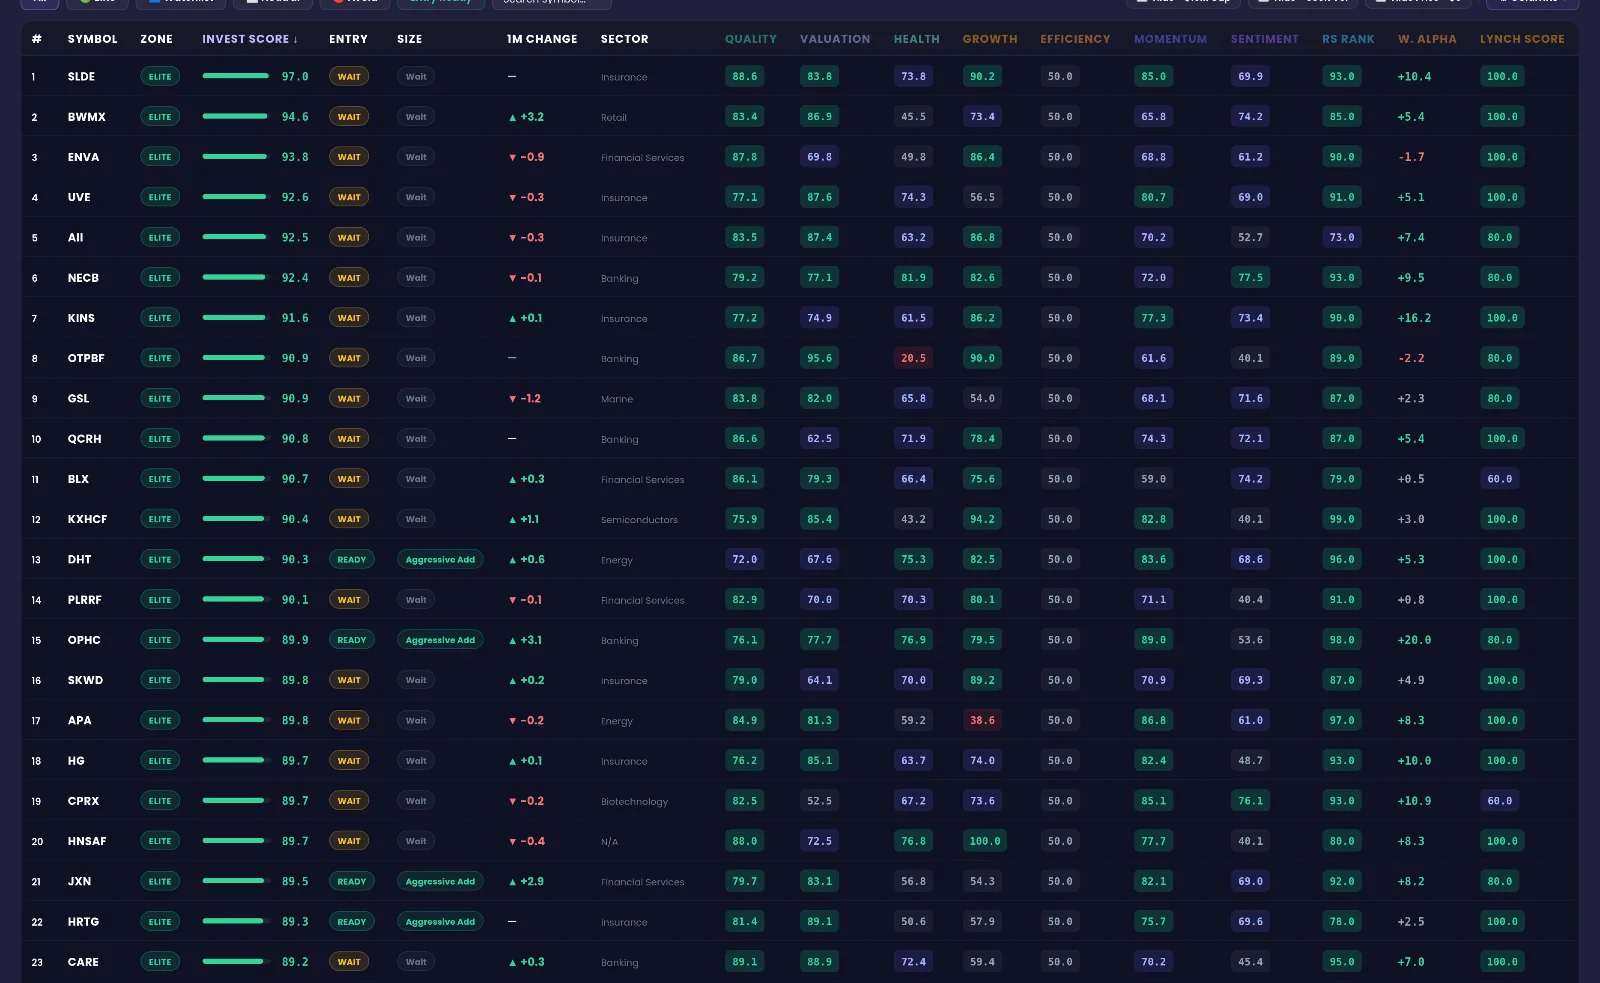
Two stocks can share almost the same Invest Score for very different reasons. The seven category columns show why. APA scores 89.8 with Momentum at 86.8 but Growth at only 38.6. MU scores 88.4 with Growth at 97.7. Same zone, different profiles.
What the tab helps you see
- Which names lead. The table sorts by Invest Score from the top down.
- Which leaders are actionable by the page's rules. READY versus WAIT.
- Which scores are changing. The 1M Change column shows improvement or decline versus the prior month.
- Whether the market already agrees. RS Rank and W. Alpha show price strength next to the fundamentals.
EZPZ's method is proprietary. This guide covers how to read the scores, not how they are made.
Walking through the tab, top to bottom
Toolbar
The toolbar sits above the table. It controls what the table shows.
- All – shows every zone. This is the default view.
- 🟢 Elite – shows only ELITE stocks, the highest-conviction group.
- 🟦 Watchlist – shows only WATCHLIST stocks. These are quality names that are not yet exceptional in every category.
- ⬜ Neutral – shows only NEUTRAL stocks: average quality, no clear edge either way.
- 🔴 Avoid – shows only AVOID stocks: weak quality or high risk on this page's reading.
- Entry Ready – narrows the table to stocks whose Entry reads READY. You can combine it with a zone button.
- Search symbol… – type a ticker to jump straight to its row.
- ⚙ Columns ▾ – opens a menu to choose which columns appear. Handy on a small screen, because the table is wide.
- ‹ Prev · 68 · Next › – the pager. Use Prev and Next to move through the pages of the table.
For scale, the latest data covers 7915 symbols. Of those, 191 are Elite, 1370 Watchlist, 2666 Neutral and 3688 Avoid, and the average score is 50.4. That spread tells you Elite is a small, selective group.
Table
The table is the heart of the tab. One row is one stock. Here is every column, as it appears on screen:
- # – the rank on the current sort. SLDE is 1.
- SYMBOL – the ticker.
- ZONE – ELITE, WATCHLIST, NEUTRAL or AVOID. Read it as the quality tier.
- INVEST SCORE ↓ – the 0–100 composite. The arrow means the table is sorted by this column, highest first.
- ENTRY – READY, WAIT or PASS. READY means a timing trigger has fired. WAIT means quality passed but no trigger yet. PASS means a hard red flag.
- SIZE – the sizing label: Aggressive Add, Normal Add, Starter Only or Wait. It only shows an add label when Entry is READY.
- 1M CHANGE – how much the Invest Score moved versus the prior month. ▲ means up, ▼ means down, a dash means no change.
- SECTOR – the sector shown for the stock, such as Insurance, Energy or Semiconductors.
- QUALITY – profitability, returns on capital and earnings quality, 0–100.
- VALUATION – how attractively priced the stock looks against its fundamentals, 0–100. Higher means cheaper on this reading.
- HEALTH – financial safety and balance-sheet strength, 0–100.
- GROWTH – past and forward growth trend, 0–100.
- EFFICIENCY – how well growth turns into real cash, 0–100. On the top rows it reads 50.0 for every stock, so it does not separate these leaders.
- MOMENTUM – price trend strength, 0–100.
- SENTIMENT – options, insider and institutional positioning, 0–100.
- RS RANK Higher means stronger relative strength.
- W. ALPHA – a multi-timeframe momentum reading. Positive means an upward trend across timeframes. Negative means broad downward pressure.
- LYNCH SCORE – a 0–100 check against classic fundamental stock-picking criteria. It ignores price action and options flow.
Reading row 1 across. SLDE: ELITE, Invest Score 97.0, Entry WAIT, Size Wait, 1M Change "—" (no change), sector Insurance. Quality 88.6, Valuation 83.8, Health 73.8, Growth 90.2, Efficiency 50.0, Momentum 85.0, Sentiment 69.9. RS Rank 93.0, W. Alpha +10.4, Lynch Score 100.0. In plain English: strong in nearly every category, already outperforming on price, top marks on the Lynch check, but no timing trigger.
Reading DHT across. ELITE, 90.3, Entry READY, Size Aggressive, 1M Change +0.6, sector Energy. Quality 72.0, Valuation 67.6, Health 75.3, Growth 82.5, Momentum 83.6, Sentiment 68.6. RS Rank 96, W. Alpha +5.3, Lynch Score 100. Lower score than SLDE, but the page shows a fired trigger and a rising score.
A few other large names on the first page show how to compare profiles:
- STNG – 89.1, READY, Aggressive, Health 83.5. Its W. Alpha is -0.5, a mild negative next to a strong score.
- ALL – 86.2, READY, Aggressive, 1M Change +1.7, Valuation 82.7.
- MU – 88.4, WAIT, 1M Change +1.9, Growth 97.7, RS Rank 99.
- SNDK – 87.7, WAIT, Growth 93.5 and RS Rank 99, but Health only 34.7.
- CPRX – 89.7, WAIT, Momentum 85.1 and Sentiment 76.1, but Valuation 52.5 and Lynch Score 60.
Invest Score for large names on the first page
ENTRY & SIZE SIGNAL GUIDE
Below the table, a guide explains each Entry and Size label. It is the key to the two timing columns.
- READY · Aggressive Add – Score 80–100. The guide calls it a top-tier stock at a good entry point.
- READY · Normal Add – Score 60–80. Solid stock, timing is right. The guide ties it to a standard DCA amount.
- READY · Starter Only – Score 40–60. Average quality, trigger fired. The guide ties it to a small starter position.
- WAIT – Quality and trend gates passed, but no timing trigger yet. The guide says watch, do not buy.
- PASS – An Altman Z distress or Beneish manipulation red flag. The stock is set aside whatever its score.
So when you see DHT at 90.3 with READY, the guide places it in the Aggressive Add band. When you see SLDE at 97.0 with WAIT, the guide says the timing has not confirmed. These are the page's labels. Your own plan and risk limits still decide what you do.
How to use the Investing Score Leaderboard on EZPZ: a 5-minute routine
This is the exact routine, with the real screens from the latest data. The yellow numbers show where to look.
Scan the top of the table
Open the Investing Score Leaderboard and read the first rows. SLDE sits at #1 with 97.0, ELITE and WAIT. Read the Entry and Size columns before anything else. Then read across to the category scores to see why each leader ranks high.
Decode the Entry and Size labels
Scroll to the signal guide. (1) Aggressive Add is the label DHT, STNG and ALL carry on the first page. (2) "Score 60–80. Solid stock, timing is right. Add your standard DCA amount." describes Normal Add. (3) "Score 40–60. Average quality, trigger fired. Small starter position only." describes Starter Only. Match each READY row to its band.

Narrow with Elite and Entry Ready
Click 🟢 Elite, then Entry Ready. The table now shows only Elite names with a fired trigger. Check the 1M Change for each one: a rising score, like ALL at +1.7, reads as improving.
Confirm with RS Rank, W. Alpha and Lynch Score
For each name you keep, read the last three columns. High RS Rank, positive W. Alpha and a high Lynch Score together read as fundamentals and price agreeing. A negative W. Alpha, like STNG at -0.5, is worth a closer look on the chart.
Reading the page in plain English
Put the columns together and each row tells a short story. Here is how to say it out loud.
- If a stock is ELITE with WAIT, like SLDE at 97.0, the page reads as "strong stock, timing not confirmed."
- If a stock is ELITE with READY and Aggressive, like DHT at 90.3, the page reads as "strong stock with a fired trigger, in the top size band."
- If Growth is very high but Health is low, like SNDK with 93.5 and 34.7, the page reads as "growing fast, weaker balance sheet."
- If Momentum is high but Growth is low, like APA with 86.8 and 38.6, the page reads as "price trend is strong, growth is not the driver."
- If 1M Change shows ▲, the page reads as "conditions improving versus last month." If it shows ▼, "conditions slipping."
- If a stock shows PASS, the page reads as "red flag present, set aside whatever the score."
What this data cannot tell you
- Direction. A high Invest Score describes setup quality. It does not say where the price goes next.
- Timing. READY means a trigger has fired on the page's rules. It does not mark the best price or the exact day.
- Your fit. The Size labels are generic. They do not know your account size, your other holdings or your risk limits.
Common mistakes
- Treating rank #1 as "ready." SLDE has the top score and still reads WAIT.
- Ignoring the category scores. Two stocks near 88 can be built on very different strengths and weaknesses.
- Skipping 1M Change. A high score that keeps showing ▼ is not the same as one that keeps rising.
- Reading the Lynch Score as a price signal. It is a pure fundamentals check and ignores price action.
- Using the tab as an intraday tool. For intraday reads, use the intraday regime leaderboard instead, or the swing regime score for shorter swings.
Tools used in this post
These are the tools from this guide, plus a few that pair well when you check a leader's price action.
Which plan you need
| Tool | Plan | Free delayed page |
|---|---|---|
| Investing Regime Leaderboard | Premium | None |
| DarkVol Leaders | Pro | Yes |
| Gap Up and Down | Pro | Yes |
| Range Change Leaders | Pro | Yes |
| Historical Volatility | Pro | Yes |
FAQ
What does the Invest Score measure?
Higher means a stronger investing candidate. It is not a short-term price forecast.
Why is the top-ranked stock not READY?
Score and timing are separate. SLDE scores 97.0 but no timing trigger has fired, so its Entry reads WAIT.
What is the difference between WAIT and PASS?
WAIT means the stock passed the quality and trend gates but has no timing trigger yet. PASS means a hard red flag, such as Altman Z distress or Beneish manipulation risk, was found.
How do I see only stocks with a fired trigger?
Click Entry Ready in the toolbar. Add 🟢 Elite to narrow it to the top zone.
What does a dash in 1M CHANGE mean?
It means the score has not moved versus the prior month. SLDE shows a dash in the latest data.
How do RS Rank and Lynch Score differ?
Lynch Score checks classic fundamental criteria and ignores price. When both are high, fundamentals and price agree. More guides are in the Learn center.