
Learn Center
Investing Regime Leaderboard
A 0 to 100 score and four zones for stocks you might hold for weeks to months, with Entry and Size labels and a ticker page that shows what sits behind one symbol's score.
What is an investing score?
An investing score is a single 0 to 100 reading of how a stock looks as a candidate to hold for roughly 30 to 180 days. Higher means a stronger candidate and lower means a weaker, riskier one. Each score carries a zone label: Elite, Watchlist, Neutral, or Avoid.
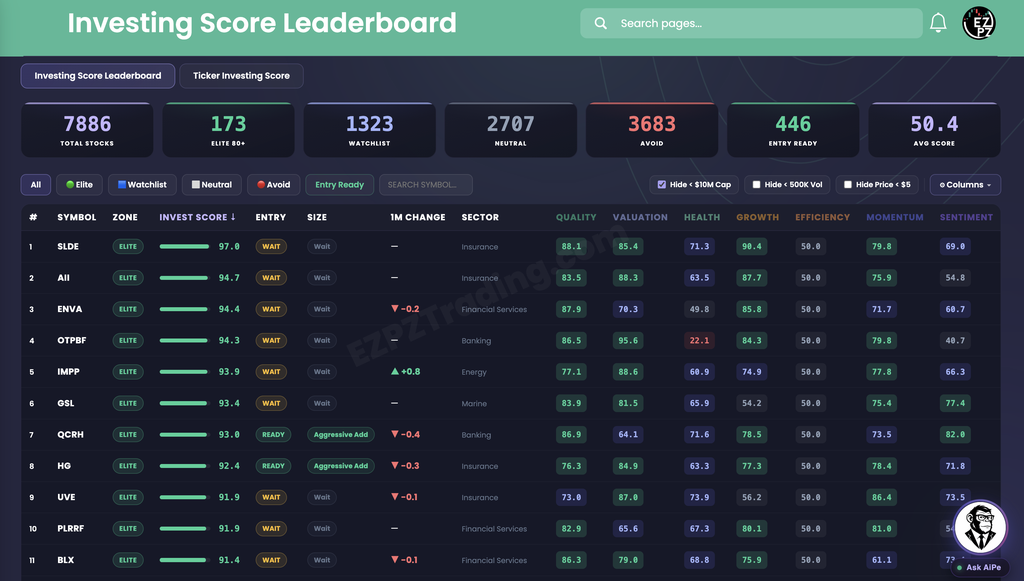
Think of it as a report card for a longer holding period, not a price forecast. The page rolls seven category scores into one number: Quality, Valuation, Health, Growth, Efficiency, Momentum, and Sentiment. That is why a stock can post a very high total and still show one weak category. In the leaderboard screenshot below, OTPBF reads 94.3 and sits in the Elite zone, yet its Health score is 22.1. The number is a summary. The category scores tell you what sits underneath it.
The score also does not tell you when to act. A separate Entry label says whether a timing trigger has fired, and a Size label suggests how a position might be scaled. A stock can score well and still read WAIT. The exact methodology is not published, and the page states that not every indicator behind the score is shown.
On EZPZ the same score appears two ways. The leaderboard ranks thousands of stocks in one table. The ticker page opens a single symbol and shows the readings around its score. Both are Premium pages.
How the Investing Score pages work on EZPZ
Two tabs sit under the page title. Only one is open at a time.
Start on the leaderboard when you want to narrow a large list down to a handful of names. Switch to the ticker tab when you already have a symbol and want to see what is behind its score. Clicking a symbol in the leaderboard opens that symbol on the ticker page in a new browser tab.
How this differs from other Stocks Analytics pages
This is the investing score page, built for a holding period of weeks to months. Swing Regime Leaderboard scores a multi-day setup on a -100 to +100 scale with five regime labels, and Intraday Regime Leaderboard scores the current session. Neither uses the 0 to 100 scale, the four zones, or the Entry and Size labels you see here. Technical Analysis and Top-50 Aggregate Technicals are indicator pages, not a single composite score. Predictive CandleScope is a candle-based view. Market Price Action Trend is the price trend chart. Volume Surge Trades, Top Money Flow, and Seasonal Returns each answer a different question.
Outside this category, Ticker Explorer is the one-symbol dashboard when you want a quote and options charts instead of an investing score. Market Dashboard is the broad market snapshot.
Leaderboard summary cards, filters, and columns
Seven cards sit above the table: Total Stocks, Elite 80+, Watchlist, Neutral, Avoid, Entry Ready, and Avg Score. In the screenshot they read 7886, 173, 1323, 2707, 3683, 446, and 50.4. The four zone counts add up to the total. Read them as a quick look at how the list is spread out. A list that is mostly Avoid and Neutral says most stocks do not stand out.
Under the cards, one row of controls narrows the table:
| Control | What it does |
|---|---|
| All Elite Watchlist Neutral Avoid | Zone buttons. All is on by default. |
| Entry Ready | A toggle that keeps only rows whose Entry label is READY. |
| Search symbol | Filters the table by ticker as you type. |
| Hide < $10M Cap | Checked by default. Removes the smallest companies. |
| Hide < 500K Vol | Unchecked by default. Removes thinly traded stocks. |
| Hide Price < $5 | Unchecked by default. Removes low-priced stocks. |
The table starts sorted by Invest Score with the highest first. Click a header with an arrow to sort by it. Zone, Entry, Size, Sector, and Top Drivers do not sort. Page numbers and a row count sit under the table.
| Column | What you are looking at |
|---|---|
| # | Row number in the current sort. |
| Symbol | The ticker. Click it to open that symbol on the ticker page. |
| Zone | The label: ELITE, WATCHLIST, NEUTRAL, or AVOID. |
| Invest Score | A bar and the 0 to 100 number. |
| Entry | READY, WAIT, or PASS. Hover the badge for the reason. |
| Size | Aggressive Add, Normal Add, Starter Only, or Wait. |
| 1M Change | How far the score moved compared with a month ago. A green up arrow means it improved, a red down arrow means it fell, and a dash means no change or no history. |
| Sector | The company's sector. |
| Quality Valuation Health Growth Efficiency Momentum Sentiment | Seven category scores on the same 0 to 100 scale, shown as colored cells. Green and blue cells read strong, grey reads middling, and red reads weak. |
| Top Drivers | Small pills naming the categories helping the score most. Off by default. Hover a pill for its score. |
| RS Rank | A 1 to 99 rank of the stock's 12-month price performance against the tracked universe. It sits to the right of the screenshot, so scroll to see it. |
| W. Alpha | Weighted Alpha. Positive means an upward trend across several timeframes, negative means broad downward pressure. |
| Lynch Score | A 0 to 100 count of how many classic fundamental stock-picking criteria the stock meets. It ignores price action and options flow. |
The Columns button opens a Show / Hide Columns list grouped as Core, Fundamentals, Growth & Efficiency, and Momentum & Sentiment, with a Reset to default link. The page remembers your choice in your browser. Every column is on by default except Top Drivers.
Entry and Size labels
Below the table, an Entry & Size Signal Guide explains five badges. It is the fastest way to learn what the Entry and Size columns mean.
| Badge | What it means |
|---|---|
| READY | The stock passed the page's quality and trend checks and a timing trigger has fired. It appears with a Size label of Aggressive Add, Normal Add, or Starter Only. |
| WAIT | The stock passed the checks but no timing trigger has fired yet. The guide says to watch it and not buy today. Size reads Wait. |
| PASS | A fundamental red flag was detected. The guide says to skip it, whatever the score. |
Reading example rows
These rows come from the leaderboard screenshot. They show why the columns to the right of the score matter.
| Symbol | Score / Zone | Entry / Size | 1M Change | Quality / Valuation / Health / Growth | What stands out |
|---|---|---|---|---|---|
| SLDE | 97.0 Elite | WAIT / Wait | Dash | 88.1 / 85.4 / 71.3 / 90.4 | The top row. Every category shown is strong, yet the Entry label is WAIT. |
| OTPBF | 94.3 Elite | WAIT / Wait | Dash | 86.5 / 95.6 / 22.1 / 84.3 | A red Health cell of 22.1 sits inside an Elite score. Check the category that stands out before you trust the total. |
| GSL | 93.4 Elite | WAIT / Wait | Dash | 83.9 / 81.5 / 65.9 / 54.2 | Growth is the lowest of the four shown. Momentum is 75.4 and Sentiment is 77.4. |
| QCRH | 93.0 Elite | READY / Aggressive Add | -0.4 | 86.9 / 64.1 / 71.6 / 78.5 | Near GSL on score, but READY. The score barely moved from a month ago. |
| IMPP | 93.9 Elite | WAIT / Wait | +0.8 | 77.1 / 88.6 / 60.9 / 74.9 | One of the few rows in view with a rising score over the month. |
None of these rows is a call to buy or sell. GSL and QCRH sit about four tenths of a point apart, yet only one is READY. In every row shown, Efficiency reads 50.0. Compare the columns on each row before you treat any of them as a candidate.
Ticker Investing Score tab
The second tab opens one symbol. Type a symbol in the box at the right and click Analyze, or press Enter. The header shows the symbol, its price, and the label EZPZ Investing Regime Score.

| Piece | What you are looking at |
|---|---|
| Zone banner | The zone label on the left and the big 0 to 100 score on the right. AAPL reads Neutral and 64.3 in the screenshot. |
| Tags | Entry status (Entry: WAIT), the Size label (Wait), the 1M score change (1M: -0.4), and the sector (Technology). |
| Investing Score gauge | A track labeled Avoid, Neutral, Watchlist, and Elite with a needle and the score, plus the note that the range is 0 to 100. The four segments are the same width, so the needle's position inside the track is not proportional to the score. |
| Category Scores | Seven tiles, each with a score and a bar. In the screenshot: Quality 78.6, Valuation 22.1, Health 61.6, Growth 43.4, Efficiency 50.0, Momentum 75.1, and Sentiment 64.9. |
AAPL's total is Neutral even though Quality and Momentum are strong. Valuation at 22.1 and Growth at 43.4 pull the other way. That is the pattern to look for: the same total can come from very different mixes.
Detail sections, Entry Engine, and score drivers
Below the category tiles, three detail sections show the individual readings the page chooses to display. Each card has a name, a reading, a short note, and a small bar. The page titles the sections Quality & Valuation, Financial Health & Growth, and Efficiency, Momentum & Sentiment. The page also notes that not every indicator behind the score is shown.

| Card | What you are looking at |
|---|---|
| ROIC Gross Margin Operating Margin | Return on invested capital, revenue minus cost of goods sold, and EBIT as a share of revenue. |
| FCF Margin FCF Conversion | Free cash flow as a share of revenue, and free cash flow against net income. |
| EV/EBITDA EV/Sales PEG Ratio | Valuation multiples: enterprise value against EBITDA and against revenue, and the P/E ratio divided by the growth rate. |
| FCF Yield Fwd Earnings Yield | Free cash flow against market cap, and forward EPS against price. |
| Card | What you are looking at |
|---|---|
| Altman Z-Score Piotroski F-Score | A bankruptcy-risk reading with a zone note, and a 9-point financial strength reading shown as a fraction of 9. |
| Debt/EBITDA Interest Coverage Current Ratio | A leverage ratio, EBIT against interest expense, and current assets against current liabilities. |
| Revenue 3yr CAGR EPS 3yr CAGR FCF Growth YoY | Three-year revenue growth, three-year EPS growth, and year-over-year free cash flow growth. |
| Fwd Rev Growth Estimate Revision | The analyst revenue consensus and the change in EPS estimates. |
| Lynch Score | The same 0 to 100 fundamentals checklist reading as the leaderboard column. |
| Card | What you are looking at |
|---|---|
| Sloan Accruals Asset Growth | Earnings quality, where lower is better, and year-over-year total asset growth. Both show a dash for AAPL in the screenshot. |
| 12-1M Momentum 6M Momentum | Price return excluding the last month, and the six-month price return. They read 30.8% and 35.8%. |
| RS Rank Weighted Alpha | The 1 to 99 relative strength rank and the multi-timeframe momentum reading. They read 87/99 with the note Top 20% and strong outperformer, and +10.2. |
| PEAD EPS Surprise Avg | Post-earnings drift and the mean earnings surprise. They read 6.10% and +1.69%. |
| P/C Ratio IV Rank (IVR) | The put to call ratio with a note, and implied volatility against its one-year range. They read 0.393 with Call-heavy and bullish, and 63.5 with Elevated IV. |
| Short Interest Insider Buy Score | Days to cover short interest, and a reading based on Form 4 open-market purchases. They read 3.5d and 0.0. |
The cards use color to show whether a reading looks favorable, middling, or unfavorable. Use them to see which readings agree with the category tile above and which do not.
| Section | What you are looking at |
|---|---|
| Entry Engine | The Entry status and Size label, with a one-line reason underneath. AAPL reads WAIT and Wait with a No entry trigger note. |
| Score Performance | The 1 Month score change and an Updated line with the date and time. AAPL reads -0.4, updated 2026-09-21 at 02:10 UTC. |
| Sector Score Zone | The company's sector and its zone. AAPL reads Technology and NEUTRAL. |
| Top Score Drivers & Detractors | Up to two categories helping the score, marked Strength driver, and up to two dragging it, marked Weakest factor. AAPL shows Quality 78.6 and Momentum 75.1 as drivers, and Growth 43.4 and Valuation 22.1 as the weakest factors. |
The Updated line shows when the score was last calculated. Check it before you lean on a reading.
How people actually use it
Build a short list
Click Elite or Watchlist, keep the default $10M cap filter on, and sort by a category such as Quality or Health to see which names stand out.
Separate strength from timing
Turn on Entry Ready to see rows with a fired trigger, or leave it off and watch the WAIT rows with the strongest scores.
Open a name and compare
Click a symbol. Compare the banner to the category tiles, then read the drivers and detractors to see whether the score rests on fundamentals or on momentum and sentiment.
Check what you hold
Watch 1M Change and the zone on names you own. Use Ticker Explorer for a broader one-symbol view.