How to read Theta Performance: gamma regime, strategy P&L and the payoff chart
SPY sits at $759.97, below its 763.0 flip, and the banner reads Mixed Conditions. Meanwhile the top-ranked iron condor shows +$96 max profit, -$404 max loss and breakevens at $748.10 / $770.96. Here is how to read every part of the Theta Performance tab.
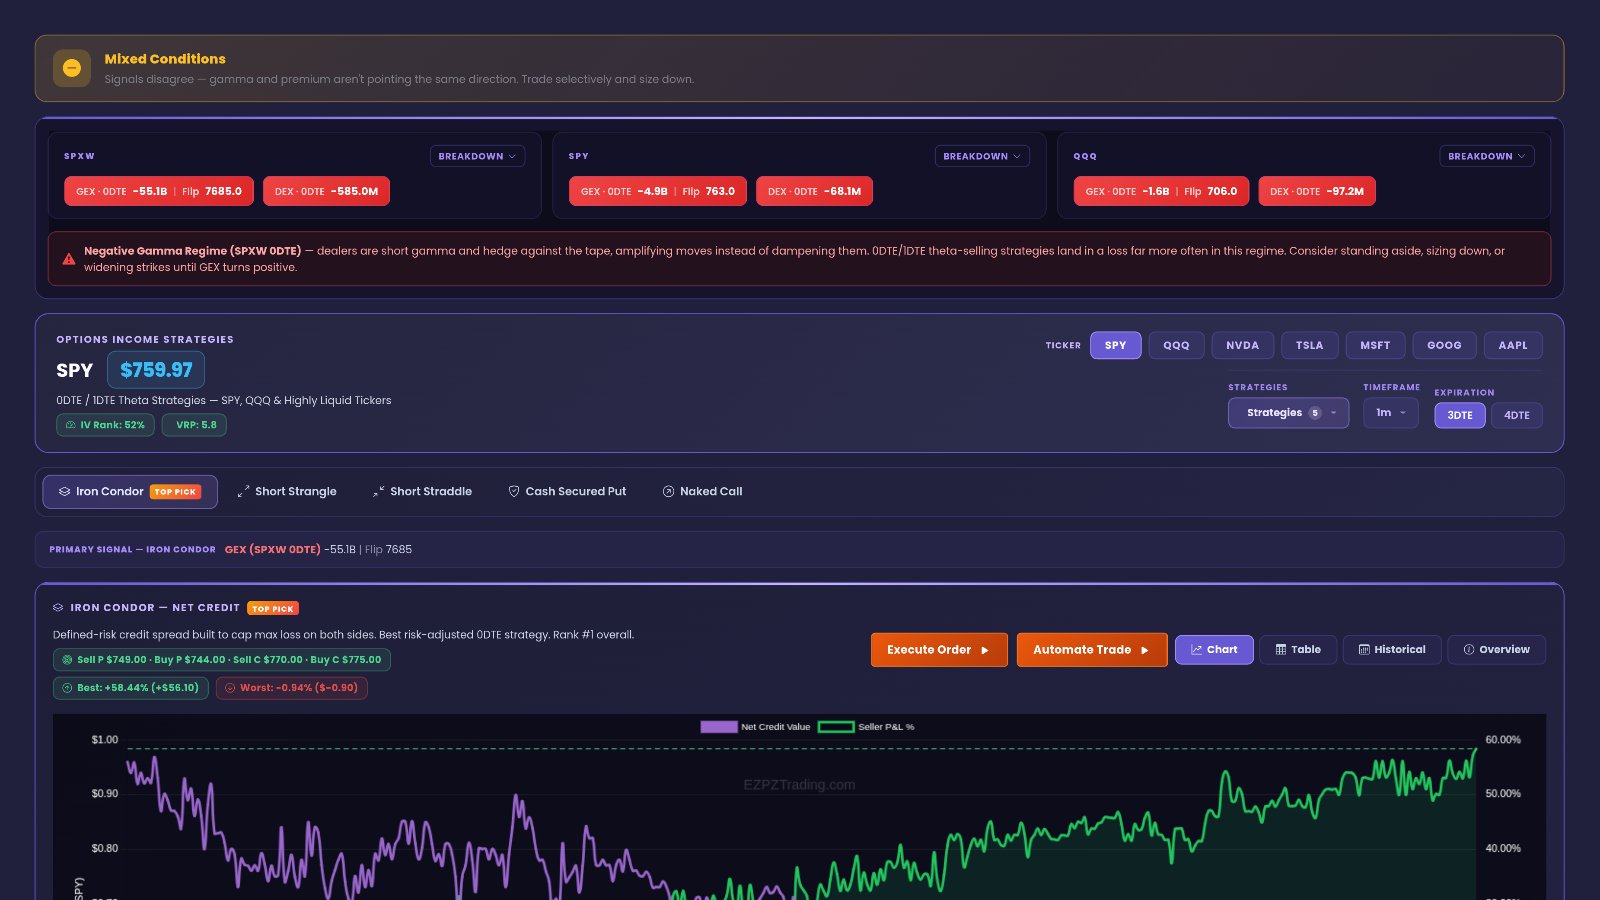
SPY is at $759.97 in the latest data, just below its gamma flip at 763.0. The tab's banner reads "Mixed Conditions": gamma and premium don't agree. The top-ranked income trade, an iron condor, shows a max profit of +$96 against a max loss of -$404, with breakevens at $748.10 and $770.96. That one screen tells a premium seller what the market backdrop looks like and exactly what the trade risks.
Quick definition first. Theta is the value an option loses each day as time passes. Option sellers collect that decay. The Theta Performance tab follows common income strategies on SPY and shows how each one is doing. GEX (gamma exposure) shows how dealer hedging may act on price. Negative GEX means dealers are short gamma. DEX (delta exposure) shows the directional lean of open options. The flip is the price where gamma changes sign. 0DTE means options that expire the same day. A breakeven is the price where the trade neither makes nor loses money at expiration.
-55.1B
+$96
-$404
The idea behind Theta Performance
Selling premium is a trade on time and range. You want price to stay inside a zone while the options you sold lose value. Two things matter most: what the market backdrop looks like, and what your trade can make or lose. This tab puts both in one place.
Backdrop first: is the tape calm or jumpy?
Short-premium trades tend to feel best when moves are damped. They feel worst when moves run. The gamma readings at the top help you judge which kind of tape you are in. A negative gamma regime means dealer hedging can push in the same direction as the move. That is the backdrop the banner flags in the latest data.
Then the trade: how does each strategy look?
The tab follows a set of income strategies on SPY, each with its own legs. In the latest data the ranked list runs from the iron condor at #1 down to the broken wing butterfly at #11. For the strategies with live readings you can see P&L in dollars and percent, plus the day's best and worst.
Finally the shape of the risk
The payoff chart turns the legs into one picture. It answers three questions:
- What is the most I can make?
- What is the most I can lose?
- Where does the trade start losing at expiration?
Walking through the tab, top to bottom
SPY
The first panel is the SPY header block. It opens with a regime banner and then three breakdowns.
The regime banner. In the latest data it reads "Mixed Conditions. Signals disagree — gamma and premium aren't pointing the same direction. Trade selectively and size down." Read it as a mood light. When signals disagree, the backdrop is not clean for either side.
SPXW BREAKDOWN. Three readings sit on one line: GEX · 0DTE -55.1B, Flip 7685.0 and DEX · 0DTE -585.0M. Negative GEX means dealers are short gamma on same-day SPX options. Negative DEX means the open 0DTE options lean short on delta.
SPY BREAKDOWN. GEX · 0DTE -4.9B, Flip 763.0 and DEX · 0DTE -68.1M. With SPY at $759.97, price sits just under the flip. Below the flip is negative gamma territory. Above it, hedging tends to damp moves instead.
QQQ BREAKDOWN. GEX · 0DTE -1.6B, Flip 706.0 and DEX · 0DTE -97.2M. This lets you check whether tech agrees with the broad market. Here all three breakdowns show negative GEX and negative DEX.
The regime line. Under the breakdowns, a line reads "Negative Gamma Regime (SPXW 0DTE) — dealers are short gamma and hedge against the tape". This names the regime and which breakdown it refers to.
Controls. In the same top area you will find three controls:
- STRATEGIES — shows "Strategies 5" in the latest data. It sets which income strategies appear on the tab.
- TIMEFRAME — set to 1m. This is the time step of the chart: each point is one minute.
- EXPIRATION — choices like 3DTE and 4DTE. Pick how many days until the options expire. Changing it changes the legs and the readings for every strategy.
In the latest data, five strategies carry live P&L readings. Here is how they compare on the same measure.
Live P&L by strategy, SPY
Read the bars with the dollar figures next to them. The short straddle shows the smallest percent, +24.35%, but the largest dollar gain, +$195.00. The iron condor shows +58.44%, or +$56.10. Percent tells you how much of the premium is earned. Dollars tell you the size.
Also look at the day's range. The naked call's The latest Best is +67.82% (+$56.90) and its The latest Worst is -31.11% (-$26.10). The cash secured put ranged from +58.43% (+$63.10) to -19.35% (-$20.90). The iron condor's worst was only -0.94% (-$0.90). A wide best-to-worst range means a bumpier ride, even when the trade ends green.
PAYOFF AT EXPIRATION
This panel draws the profit or loss of the active strategy across prices at expiration. In the latest data the active strategy is the iron condor. Its legs are Sell P $749.00 · Buy P $744.00 · Sell C $770.00 · Buy C $775.00.
Three readings sit on the panel:
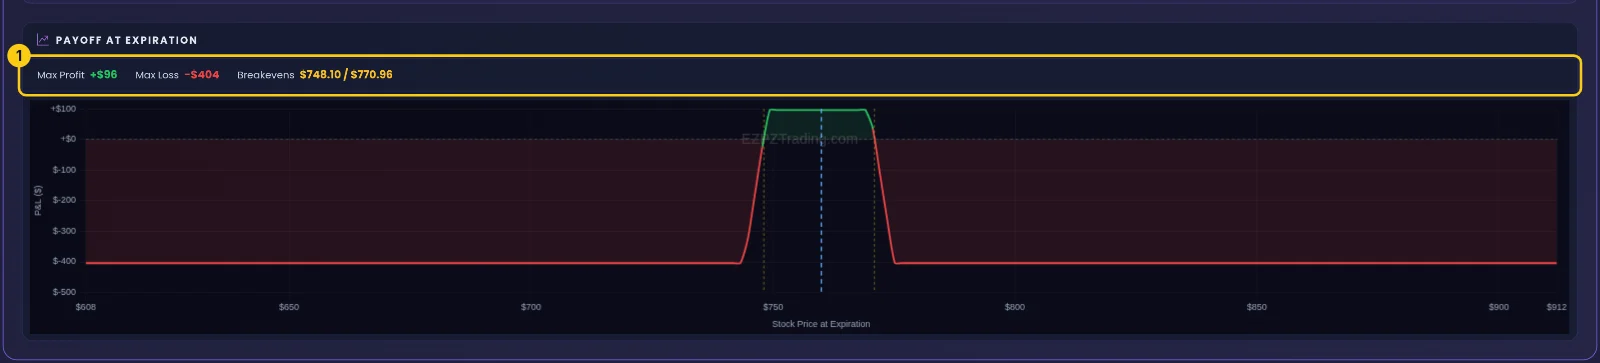
- Max Profit — +$96. The most the trade can make at expiration. For a condor, that happens when price finishes between the two short strikes.
- Max Loss — -$404. The most the trade can lose at expiration. That happens if price finishes beyond one of the long strikes.
- Breakevens — $748.10 / $770.96. Between these two prices the trade finishes green. Outside them, it finishes red.
With SPY at $759.97, price sits roughly in the middle of the two breakevens. The max loss is much larger than the max profit. That is normal for an iron condor: you accept a big, less likely loss for a small, more likely gain.
How to use the Theta Performance page on EZPZ: a 5-minute routine
This is the exact routine, with the real screens from the latest data. The yellow numbers show where to look.
Read the regime and the three breakdowns
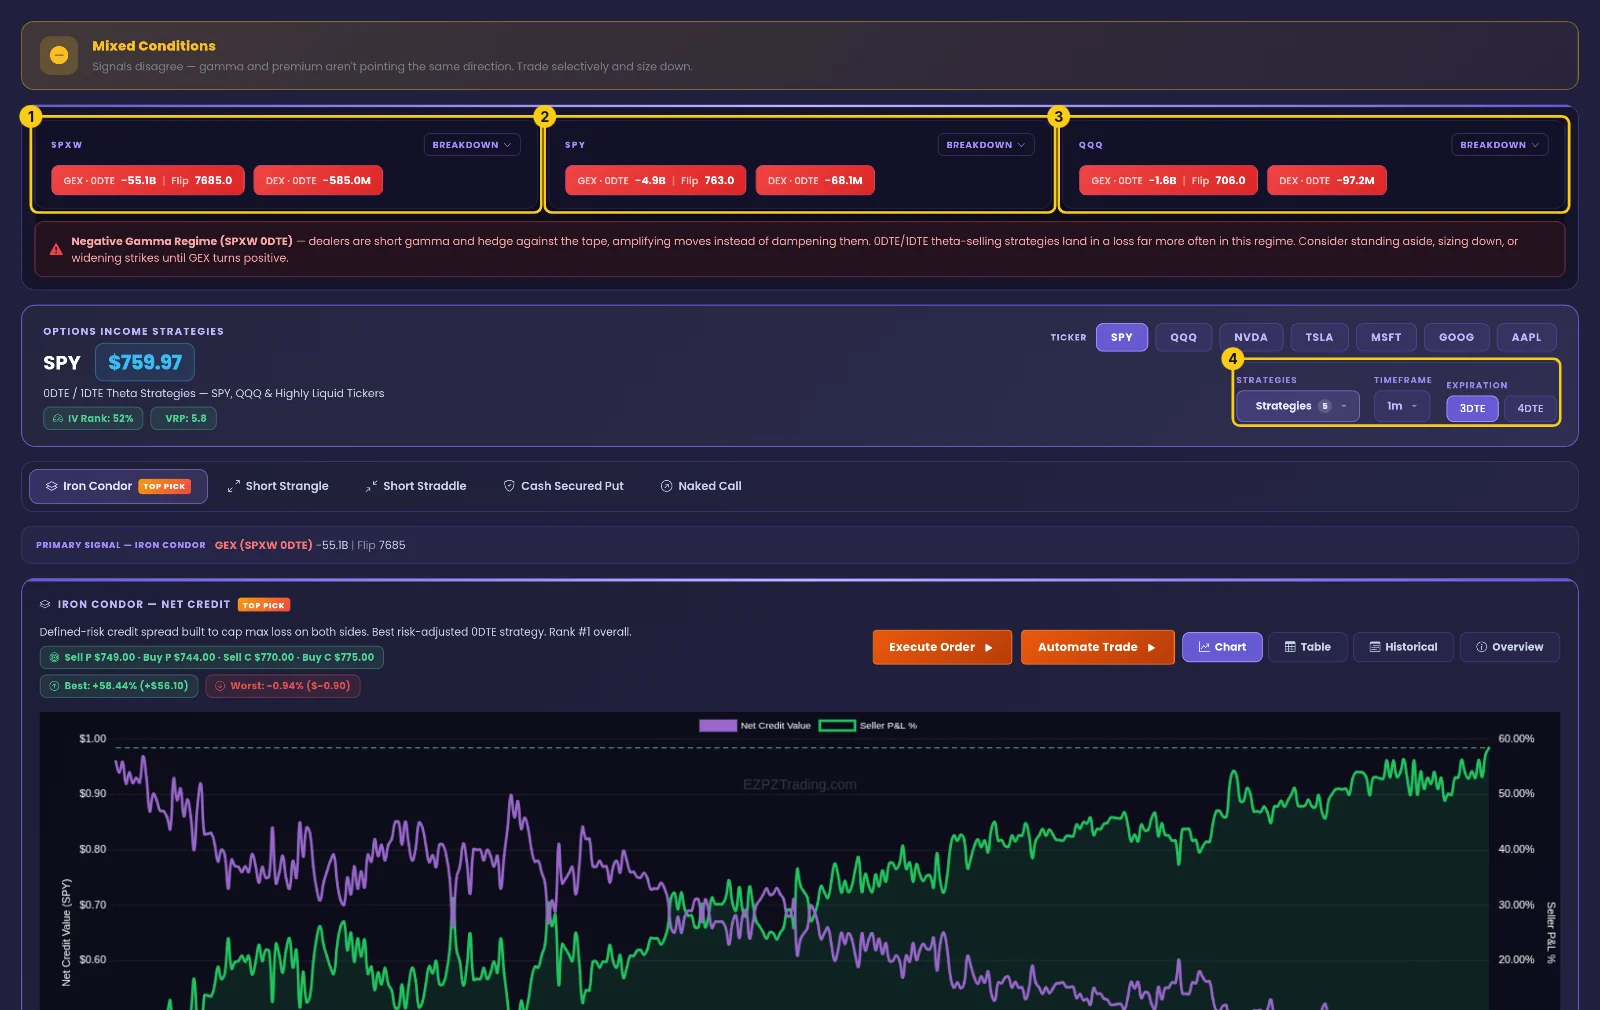
Open the Theta Performance tab. Start with (1), the SPXW breakdown: GEX -55.1B, Flip 7685.0, DEX -585.0M. Then check (2), SPY: GEX -4.9B, Flip 763.0, DEX -68.1M, with price at $759.97 just under the flip. Then (3), QQQ: GEX -1.6B, Flip 706.0, DEX -97.2M. All three negative means the backdrop is a negative gamma one across the board.
Set strategies, timeframe and expiration
Look at (4): STRATEGIES shows Strategies 5, TIMEFRAME shows 1m and EXPIRATION offers 3DTE and 4DTE. Pick the expiry you actually trade. Every strategy's legs and readings follow that choice.
Check the payoff of the active strategy
Scroll to the payoff panel. Read (1): Max Profit +$96, Max Loss -$404, Breakevens $748.10 / $770.96. Ask yourself whether you are comfortable with that loss. Then compare the breakevens with the flip at 763.0 and the current price.
Check again before the close
Come back late in the day. See if SPY has crossed its flip, if the banner has changed and where price sits against the breakevens. A changed banner is the cue to look again at size.
Reading the page in plain English
Put the parts together. The banner gives the mood. The breakdowns show where gamma and delta stand. The strategy readings and payoff show what your trade is doing and what it risks.
- If the banner reads Mixed Conditions and all three GEX readings are negative, the page reads as a jumpy backdrop where signals disagree.
- If SPY sits below its flip, like $759.97 under 763.0, the page reads as price in negative gamma territory.
- If price sits well inside both breakevens, the page reads as the condor currently in its profit zone at expiration.
- If a strategy shows a strong P&L but a wide best-to-worst range, the page reads as a trade that earned its gain through big swings.
- If SPXW, SPY and QQQ disagree in sign, the page reads as a split market, not a single regime.
What this data cannot tell you
- Direction. Negative GEX and DEX describe positioning. They do not say which way SPY goes next.
- Timing. The page shows where things stand now. It does not say when price might reach a breakeven or cross the flip.
- Your fills. The P&L and payoff reflect the tab's legs. Your own entries, prices and costs can differ.
Common mistakes
- Chasing the best percent. The naked call shows +61.98%, but its worst of -31.11% shows how hard it swung.
- Ignoring the banner. "Trade selectively and size down" is the tab telling you the signals disagree.
- Mixing up the flips. SPXW's flip of 7685.0 is on the SPX scale; compare SPY's price only to SPY's flip of 763.0.
- Forgetting the expiration. Switching between 3DTE and 4DTE changes the legs, so the readings change too.
- Reading the payoff as intraday P&L. The chart shows results at expiration, not right now.
Tools used in this post
These are the EZPZ tools that pair well with Theta Performance when you plan an income trade.
Which plan you need
| Tool | Plan | Free delayed page |
|---|---|---|
| Theta Performance | Elite | None |
| 0DTE Graph | Pro | Yes |
| 7-DTE Graph | Pro | Yes |
| Net Premium Heatmap | Pro | Yes |
| Expected Move | Pro | Yes |
| GEX Heatmap | Premium | None |
FAQ
What does "Mixed Conditions" mean on Theta Performance?
It means gamma and premium readings point in different directions. The banner suggests trading selectively and sizing down.
Why are there three breakdowns: SPXW, SPY and QQQ?
They let you check whether the broad market and tech agree. In the latest data all three show negative 0DTE GEX: -55.1B, -4.9B and -1.6B.
What is the flip and why does it matter for SPY?
The flip is where gamma changes sign. SPY at $759.97 sits below its flip of 763.0, which places it in negative gamma territory.
How do I read the breakevens on the payoff chart?
For the iron condor they are $748.10 and $770.96. If SPY finishes between them at expiration, the trade is green. Outside them, it is red.
Why is max loss so much bigger than max profit?
That is the shape of an iron condor. In the latest data you risk -$404 to make +$96, in exchange for a wide profit zone.
Does changing the expiration change the readings?
Yes. The EXPIRATION control (3DTE, 4DTE) sets which options the strategies use, so legs, P&L and the payoff all follow it.