
Learn Center
Theta Performance
A way of tracking how a systematic premium selling approach would have performed over time, built on the same logic behind long running benchmark indices like CBOE's BuyWrite Index.
What is theta performance?
Theta performance is a live track of short-dated premium-selling structures on one ticker. On EZPZ, Theta Performance is Options Income Strategies for 0DTE and 1DTE. Iron Condor Chart plots Net Credit Value and Seller P&L %. The path is a mark-to-market, not a fill.
Theta selling collects time decay. A seller takes premium now and wants the option to lose value as expiration nears. Short-dated structures such as 0DTE and 1DTE move fast. A green Seller P&L % can flip when price or implied volatility jumps. Defined-risk structures such as Iron Condor and Cash Secured Put cap Max Loss. Short Strangle and Short Straddle do not. Covered Call on this page is Covered Call (Naked), so Max Loss is Unlimited. The live page also prints IV Rank, VRP, and a Low Premium-Selling Edge badge when those clocks look thin. GEX, Flip, and DEX on SPXW, SPY, and QQQ are the index backdrop. Negative Gamma Regime (SPXW 0DTE) is a warning that same-day theta sales have landed in a loss more often in that tape. None of those labels is a fill.
On EZPZ, the live page title is Theta Performance. The page label is Options Income Strategies. The subtitle is 0DTE / 1DTE Theta Strategies, SPY, QQQ and Highly Liquid Tickers. Ticker pills are SPY, QQQ, NVDA, TSLA, MSFT, GOOG, and AAPL. Timeframe starts on 1m. Choices are 1m, 5m, 10m, 15m, 30m, and 1h. Expiration sits next to it as 0DTE or NDTE pills. Strategy tabs start on Iron Condor with a TOP PICK badge. The other tabs are Short Strangle, Short Straddle, Cash Secured Put, and Covered Call. Sub-tabs are Chart, Table, Historical, and Overview. Chart legend is Net Credit Value, Seller P&L % (Green = Profit, Red = Loss), and Total Volume. Payoff at Expiration prints Max Profit, Max Loss, and Breakevens. AiPe in the corner is labeled Theta Performance Analyst. Theta Farming is the universe scanner with Fit Score. Custom Strategies is the payoff builder you assemble. Volatility Risk Premium (VRP) is implied versus later realized on its own page. Directional Options Pressure is Chart View and Table View for Short Straddle, Short Strangle (Δ20), Directional Pressure, and Net Volume. Greek Gods Dashboard is Ares, Hermes, Apollo, and Zeus on SPY Dashboard or SPX Dashboard. Contract Prices (XVWAP) is Price candles against XVWAP on one strike. IV Rank Explorer is Current IV (30D) and IV Rank (1Y) for one ticker you search. GEX and DEX is the Intraday GEX and DEX chart pair with Gamma Flip. Gamma Exposure is the strike table with Call Wall and Put Wall. Expected Move is DEM and VEM bands by expiration. Option Chain is the listed book for one ticker. Ticker Explorer is the one-symbol dashboard after you already picked a name. Gamma Short Squeeze is Squeeze Score(%) ranks.
How Theta Performance works on EZPZ
Read SPXW, SPY, and QQQ first, pick a ticker pill, leave Iron Condor on, then read Net Credit Value against Seller P&L %. It is not a score you trade. Most people start at GEX and Flip on SPXW. If that card looks loud, click Breakdown and compare 0DTE with Weekly, Monthly, 30+ DTE, and Total. Then change Timeframe or Expiration. Open Table if you want TIME, NET VALUE, PROFIT %, P&L $, and VOLUME. Open Historical if you want Days, Tenor, and Range Performance. Open Overview if you want Structure, Max Profit, Max Loss, and Management for that tab.
How this differs from Theta Farming
Theta Farming is a universe scan. Fit Score sits on Strategy Suggestion badges across many names. This page is one ticker at a time. Iron Condor Chart is the live Net Credit Value path, not a Fit Score column. Use Theta Farming when you want Iron Condor or Covered Call next to Fit Score on a list. Use this page when you already have a name and want Seller P&L %, Payoff at Expiration, or Historical Range Performance. Use Custom Strategies when you want to build legs yourself. Use Volatility Risk Premium (VRP) when you want the dedicated implied versus realized chart. Use Directional Options Pressure when you want Straddle Profit % next to Directional Pressure. Use IV Rank Explorer when you want the 1Y clock. Use GEX and DEX when you want Gamma Flip on a strike chart. Use Gamma Exposure when you want Call Wall and Put Wall. Use Expected Move when you want DEM versus VEM. Use Option Chain when you want listed strikes. Use Ticker Explorer when you want quote, IV Rank, and unusual activity on one symbol.
Verdict, regime, and ticker card
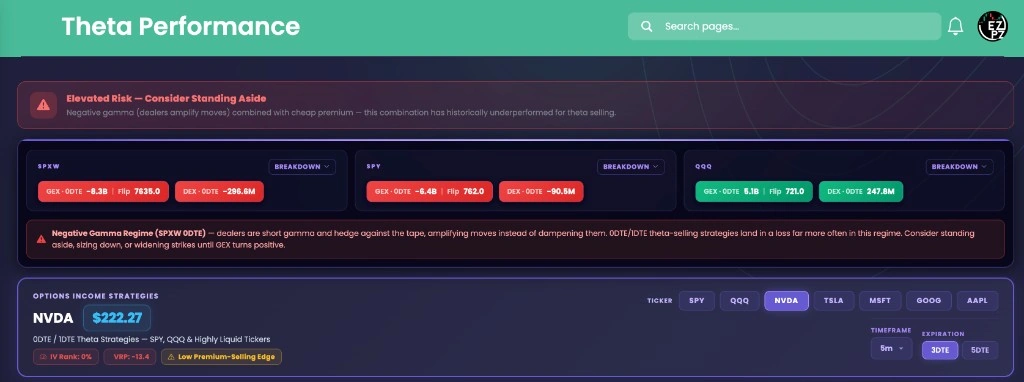
The top of the page is the backdrop for the structure below. It is not a trade ticket. Click Breakdown on SPXW, SPY, or QQQ to open the bars. All three sides open together.
The verdict card sits above the regime row. Badges sit under the ticker price.
| On the card | What you are looking at |
|---|---|
| Elevated Risk | The screenshot title is Elevated Risk, Consider Standing Aside. Other sessions can print a different verdict title. |
| IV Rank | The badge on this ticker. The screenshot prints 0% on NVDA. |
| VRP | Volatility risk premium on this ticker. The screenshot prints -13.4. |
| Low Premium-Selling Edge | Shows when IV Rank or VRP look thin for selling premium. It is a badge, not a fill. |
The regime row is a fixed trio. It stays on SPXW, SPY, and QQQ even when the ticker below is NVDA.
| On the card | What you are looking at |
|---|---|
| SPXW SPY QQQ | Index or ETF side. Breakdown opens the tenor bars. |
| GEX | Net gamma on that side for the primary bucket, often labeled GEX and 0DTE. Green leans positive. Red leans negative. |
| Flip | The flip level printed next to GEX. |
| DEX | Dealer delta on that side for the same bucket. |
| Negative Gamma Regime (SPXW 0DTE) | Warning under the trio when SPXW GEX is negative. The copy says 0DTE and 1DTE theta-selling strategies land in a loss more often until GEX turns positive. |
The header card is the name you are tracking. Ticker pills change the URL.
| Control | What you are looking at |
|---|---|
| Ticker | SPY, QQQ, NVDA, TSLA, MSFT, GOOG, AAPL. The screenshot has NVDA on. |
| Timeframe | 1m, 5m, 10m, 15m, 30m, 1h. Starts on 1m. The screenshot uses 5m. |
| Expiration | Near-dated pills such as 0DTE, 1DTE, 3DTE, or 5DTE. The screenshot shows 3DTE and 5DTE. |
Strategy tabs
The tab row picks the structure. Iron Condor starts on and carries TOP PICK. The five tabs are Iron Condor, Short Strangle, Short Straddle, Cash Secured Put, and Covered Call.
Primary Signal sits under that row. On Iron Condor it prints Primary Signal, Iron Condor, then GEX (SPXW 0DTE) and Flip. Other tabs can lead with IV Rank and VRP, or with a ticker regime line, depending on that structure.
| Tab | Card title on Chart | What the card says |
|---|---|---|
| Iron Condor | Iron Condor, Net Credit | Defined-risk credit spread built to cap max loss on both sides. Best risk-adjusted 0DTE strategy. Rank #1 overall. |
| Short Strangle | Short Strangle, OTM Strikes | Sell OTM call + put for premium. Highest premium edge. Rank #2 overall. Overview says unlimited risk. |
| Short Straddle | Short Straddle | Overview title is Short Straddle (ATM). Max Loss is Unlimited. Rank #3, High Reward, High Risk. |
| Cash Secured Put | Cash Secured Put | Overview says sell an OTM put and hold cash equal to 100 times strike. Max Profit is premium collected. |
| Covered Call | Covered Call | Overview title is Covered Call (Naked). Max Loss is Unlimited. Tracked without shares. |
Iron Condor Chart
Chart starts on. Execute Order and Automate Trade sit on the right. Best and Worst print the session extremes for Seller P&L. The screenshot on NVDA shows Best +22.47% and Worst -89.89% next to the legs line.

The y-axis on the left is Net Credit Value. The y-axis on the right is Seller P&L %.
| On the chart | What you are looking at |
|---|---|
| Net Credit Value | Purple line. Mark-to-market credit on the structure. |
| Seller P&L % | Green when the seller is up, red when the seller is down. Legend text is Green = Profit, Red = Loss. |
| Total Volume | Green bars under the price path. |
| Best Worst | Best and worst seller P&L reached on this session path. |
| Legs | The four Iron Condor strikes. Overview names them short inner call and put, long protective outer wings. |
Table is the same session as Chart, one row at a time.
| Column | What you are looking at |
|---|---|
| TIME | When that mark printed. |
| NET VALUE | Net credit at that stamp. |
| PROFIT % | Seller P&L percent at that stamp. |
| P&L $ | Dollar P&L at that stamp. |
| VOLUME | Volume on that stamp. |
Historical swaps Timeframe and Expiration for Days and Tenor. The card title is Range Performance. The table sits under it.
| Control or column | What you are looking at |
|---|---|
| Days | 7D, 14D, 30D, 60D, 90D. Starts on 30D. |
| Tenor | 0DTE/1DTE starts on. Weekly, Bi-Weekly, and 45 DTE are the other picks. |
| Trades Win Rate | Range Performance cards. Win Rate is wins over wins, losses, and breakeven. |
| Net P&L (Per Con) Profit Factor | Dollar result per contract, then profit factor for the range. |
| DATE OPEN CREDIT CLOSE P/L % | One row per day. Also EXPIRATION, DTE, LEGS, GEX (SPX), REGIME, STATUS, CLOSE DEBIT, BEST INTRADAY P %, WORST INTRADAY L %, AVG WIN RATE, PROFIT FACTOR. |
Overview on Iron Condor is titled Managed Iron Condor. The rank line is Rank #1, Best Risk-Adjusted 0DTE Strategy.
| Field | What you are looking at |
|---|---|
| Structure | Short inner call and put, long protective outer wings. |
| Max Profit | Net credit received at open. |
| Max Loss | Width of spread minus net credit. Defined risk. |
| Management | Close at 50% profit, or before last 30 min on 0DTE. |
Payoff at Expiration
Payoff at Expiration sits under Total Volume on Chart. The x-axis is Stock Price at Expiration. Max Profit, Max Loss, and Breakevens reprint above the diagram. Two breakevens print as a pair.

| On the diagram | What you are looking at |
|---|---|
| Max Profit | Green number. For Iron Condor this is the net credit if price finishes between the short strikes. |
| Max Loss | Red number, or Unlimited on structures that do not cap the wings. Iron Condor stays defined. |
| Breakevens | Yellow prices where the payoff crosses zero. The label becomes Breakeven when only one prints. |
How people actually use it
Read the regime first
Start at SPXW GEX and Flip. Open Breakdown if 0DTE disagrees with Weekly. Then look at Iron Condor Chart.
Lock one ticker
Use the Ticker pills. Leave Timeframe on 1m unless the path is too noisy, then step to 5m.
Compare Chart and Payoff
Read Seller P&L % on the session path, then Max Profit, Max Loss, and Breakevens on Payoff at Expiration.
Open Historical last
Leave Days on 30D and Tenor on 0DTE/1DTE. Read Win Rate next to Max Drawdown before you treat one green day as normal.