Is a Black Monday coming? We asked EZRA, 39 years after 1987
Oct 19 is the anniversary of the 1987 crash, and the Nasdaq just had its worst week since June. We asked EZRA, then checked Friday's positioning in EZPZ data. SPX ended Friday 79 points under its gamma flip (3:52 pm ET).

Black Monday, 39 years on
Friday, SPX slipped under the gamma flip.
Open 7,755.72. 7,655.87 by 3:52 pm ET. Flip 7,735.
Oct 19, 1987 -22.6% Dow, one session
-
SPX vs gamma flip
79 pts below
SPX 7,655.87 at 3:52 pm ET, flip 7,735. EZRA's weekend read put it at 7,667.50.
-
Dark Pool Index (estimate)
49.36%
Oct 15, the latest published session. Above the 45% line and its 20-session average of 48.95%.
-
SPY dark pool, 14 sessions
+$907.2M
Still net positive, but $309.1M lower than its Oct 14 peak of +$1,216.3M.
-
INTC dark pool, 14 sessions
$-1,348.0M
Running net selling, lower every session since Oct 5.
EZPZ data, Oct 16, 2026. Context, not a forecast. Not financial advice.
Today is Oct 19, the anniversary of Black Monday. In 1987 the Dow fell 22.6% in one session. Thirty-nine years later, crash posts filled social feeds all weekend after the Nasdaq's worst week since June. Nobody can tell you whether today is another one. What you can see is how the market is positioned going in, so we asked EZRA, our AI research analyst, and then checked the numbers ourselves. The short version: dealers ended Friday in negative gamma, while dark pool buying held up better than the headlines.
79 pts
49.36%
-22.6%
What EZRA said
Before Monday's open we asked EZRA, our AI research analyst, four questions in one Swing mode chat. Watch it answer below. These are its real answers, in its own words.

Monday, Oct 19, before the open
The four questions we asked, in order. Each one plays EZRA's real answer. Pick one to jump to it.
EZRA is about to answer.
Is a Black Monday coming? Today is the 39th anniversary of the 1987 crash, and the Nasdaq just had its worst week since June. Look at SPX and SPY positioning going into Monday, Oct 19: gamma exposure (flip, call wall, put wall), dark pool flow, put/call ratio and the regime. Give me your read first, then the data behind it, and show SPX gamma exposure by strike as a chart. Analysis only, no trade recommendation.
Researched in 5 steps
- 01Analyzing query…
- 02Fetching EZPZ regime for SPX +1 more…
- 03Fetching gamma exposure for SPX…
- 04Fetching dark pool prints for SPY…
- 05Fetching put/call ratio for SPY…
SPX/SPY: Monday Oct 19 Pre-Open Positioning Brief
Regime: NO_TRADE on both. Score barely above zero (+3.45 SPX, +1.76 SPY).
Gamma Structure: This Is The Main Story
spot closed at $7,658, the flip sits at $7,667.50. SPX is 0.12% below the gamma flip going into Monday. That's not a cushion, that's sitting on it.
| Level | Strike | Meaning |
|---|---|---|
| Gamma Flip | $7,667.50 | Spot is 0.12% below this. Reclaim = dealer tailwind. Fail = amplified downside. |
| Real Call Wall | $7,700 | Biggest single call exposure. Ceiling on any squeeze attempt. |
| Negative Gamma Wall | $7,600 | Max negative exposure. A sustained break here triggers the largest dealer selling cascade. |
| 2nd Largest Neg Exposure | $7,650 | Close to Friday close. Second pressure layer right under spot. |
PCR: Closed in Hedging Territory
Traded put/call ratio closed at 1.29 [...] OI-based PCR closed at 2.28, one of the more extreme reads this cycle.
Bottom Line for Monday Oct 19
The 1987 parallel still doesn't hold on scale, but the setup for an ugly open is cleaner than it was last week.
Above $7,667: dealers flip to buyers, the $7,700 call wall becomes the target, and shorts get squeezed into that level. That is the binary going into Monday's first candle.
Real chat Real EZRA answers from a Swing mode chat before the Oct 19, 2026 open. Answer text is EZRA's own words, shortened where you see [...]. Research steps are summarised from EZRA's notes in each answer.
EZRA put the flip at 7,667.50 from the full closing chain. Our Gamma Exposure snapshot at 3:52 pm Friday, charted below, had 7,735. Different moment, same conclusion: SPX sat under the flip, in negative gamma.
The positioning check: four readings from Friday
1. Gamma: Friday ended under the flip
Options dealers hedge the options they hold by trading the index. Above the gamma flip, their hedging tends to lean against moves: they buy dips and sell rips. Below it, the hedging runs with the move, selling into drops and buying into rallies.
On Friday, SPX opened at 7,755.72, above the 7,735 flip. By 3:52 pm ET it was at 7,655.87, so the day's drop carried it from the calmer side of the flip to the side where hedging adds to moves. The deepest negative gamma on the board sat at the 7,625 put wall. The call wall was far above, at 8,100.
SPX gamma by strike
Friday closed 79 points under the flip
- Put wall 7,625
- SPX 3:52 pm 7,655.87
- Gamma flip 7,735
- Call wall 8,100 (off the right edge)
What that means for Monday: as long as SPX trades under 7,735, dealer hedging is more likely to make moves bigger in both directions, not just down. A move back above the flip would put it on the calmer side again. It is a map of where hedging pressure changes, not a forecast.
2. Dark Pool Index: buyers did not walk away
The Dark Pool Index (DIX) estimates what share of off-exchange volume traded on the buy side. EZPZ marks 45% as neutral. On Oct 15, the latest session published at the time of writing, DIX was 49.36%, above that line and above its 20-session average of 48.95%. Over those 20 sessions it ranged from 46.29% to 51.71%, so it never dipped below neutral during the slide.
In plain terms, large off-exchange volume leaned toward buying while prices fell. That is context, not a signal: DIX classifies volume using an estimate, and the Oct 16 reading publishes after today's open.
3. SPY dark pool flow: still positive, but fading
EZPZ Dark Pool Sentiment adds up each day's labelled buy minus sell amount. For SPY, the running total over the last 14 sessions went from -$971.9M on Sep 30 to a peak of +$1,216.3M on Oct 14. It then gave back $309.1M in the last two sessions of the week, ending Friday at +$907.2M.
So the dark pool picture for the index is mixed: two weeks of net buying, then net selling on the two days the selloff sped up.
4. The chip side: Intel's dark pool flow
The selloff started in chips. Micron fell 5.6% and Intel 5.8% on Friday. Intel's dark pool running total turned lower in every session since Oct 5 and finished Friday at -$1,348.0M, the clearest one-way reading of the four.
Explore the flow
What dark pool money did into the drop
Dark Pool Index
Estimated buy-side share of dark pool volume, 20 sessions to Oct 15
2026-10-15 49.36%
SPY dark pool
Running net buy minus sell, $M, 14 sessions to Oct 16
2026-10-16 +$907.2M
INTC dark pool
Running net buy minus sell, $M, 14 sessions to Oct 16
2026-10-16 -$1,348.0M
Why 1987 still matters: selling that feeds on itself
The 1987 crash was not caused by one headline. Stocks had already fallen hard the week before, and on Monday a popular strategy called portfolio insurance told large funds to sell stock index futures as prices fell. Futures dropped below the stocks, arbitrage traders sold the stocks, prices fell again, and the insurance sold more. There was no rule to pause trading.
Portfolio insurance is gone, but the shape survives in dealer hedging. When dealers are short gamma, their hedges sell into a drop and the drop asks for more hedging. That is the loop Friday's close put SPX inside.
Same shape, 39 years apart
Selling that feeds on itself
1987: portfolio insurance
- Stocks fall
- Portfolio insurance sells index futures
- Futures trade below stocks
- Arbitrage sells the stocks
Then back to step 1
Today: dealers in negative gamma
- SPX slips below the gamma flip
- Dealers are short gamma
- Their hedges sell into the drop
- Price falls further, hedges sell more
Until price climbs back above the flip, or a circuit breaker pauses trading
Two things are different now. Positioning is visible, as above. And US markets have circuit breakers: a 7% or 13% fall in the S&P 500 before 3:25 pm ET pauses trading for 15 minutes, and a 20% fall closes the market for the day. See the SEC's investor guide and the Federal Reserve's history of the crash.
New to gamma? Our guide on how to read gamma exposure, call walls and the flip walks through it with real SPY data.
Is it only a few stocks?
Part of why one bad week felt so heavy is how narrow the rally had become. About ten stocks drove roughly 70% of the S&P 500's gain since March 30, and about 84% of its members trade at least 10% below their highs, as Yahoo Finance reported. The S&P 500 closed Friday at 7,659.44, about 2% below its Oct 6 record of 7,818.93. When a few names carry an index, a bad week in those names is felt everywhere.
What this data cannot tell you
- Direction. Negative gamma makes moves bigger both ways. A sharp rally is as consistent with Friday's positioning as a sharp drop.
- Timing. Nothing here says when a move starts or stops.
- Tomorrow's map. Gamma, walls and dark pool totals change every session as positions open and close. These are Friday's readings.
What to watch this week
- The flip. Whether SPX gets back above 7,735 or stays under it.
- Tuesday: SpaceX reports for the first time as a public company, along with Netflix, GE Aerospace and 3M.
- Wednesday: Meta and Tesla report after the close, with Lam Research and Texas Instruments as a read on chips.
- The Fed is in its quiet period before the Oct 27 to 28 meeting.
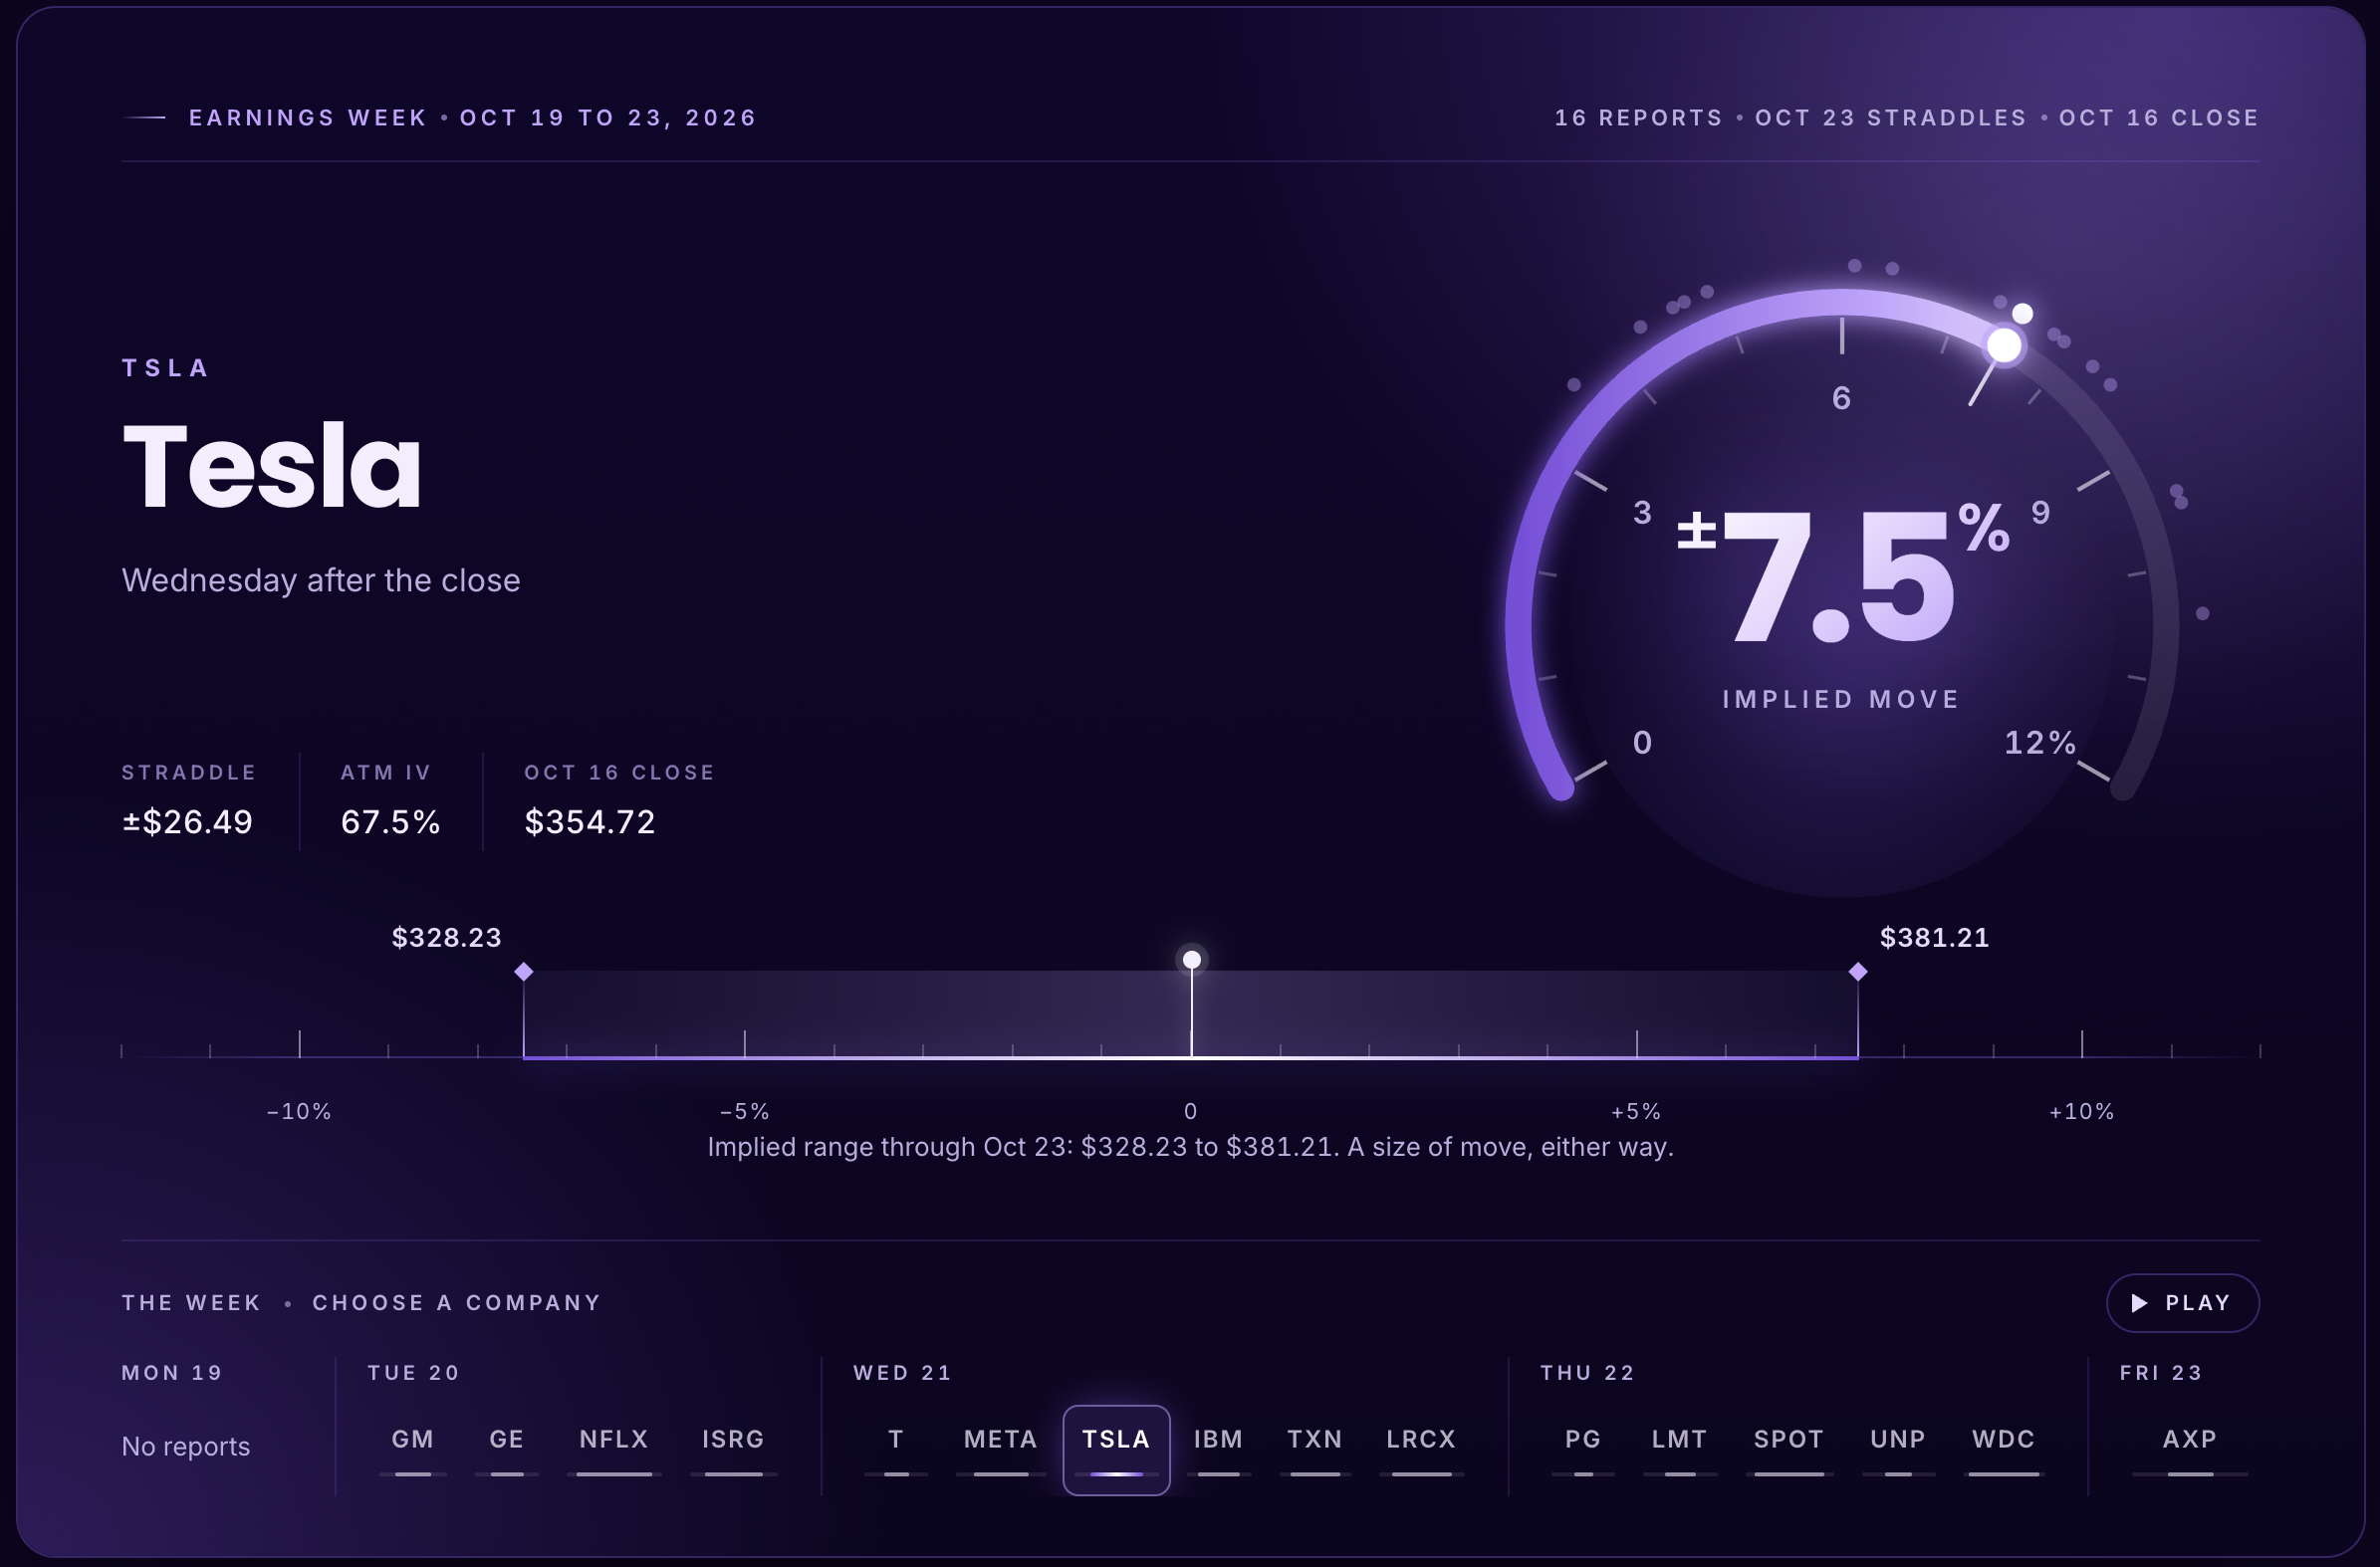
The move options are pricing for 16 of this week's reporters is in our earnings week cheat sheet.
Check it yourself
On Pro and up, open Gamma Exposure and click Ask AiPe in the bottom right. Ask whether dealers are in positive or negative gamma right now and where it flips. AiPe explains the data on your screen. It does not tell you what to trade, and it can be wrong.
EZPZ Finn, the free desktop app, can draw Friday's levels on a TradingView chart: the 7,735 gamma flip, the 7,625 put wall and the 8,100 call wall (SPX, Oct 16, 3:52 pm ET). Finn draws the levels. It does not say which way the market goes.
FAQ
Is a Black Monday coming?
Nobody can know that in advance. What you can see is positioning. At Friday's close, SPX sat 79 points under its 7,735 gamma flip, where dealer hedging tends to make moves bigger, while the Dark Pool Index stayed above its 45% neutral line. That describes how the market may react to a move, not whether one is coming. Asked the same question, EZRA said the 1987 parallel "still doesn't hold on scale," while flagging that SPX sat just under its gamma flip going into Monday.
What happened on Black Monday in 1987?
On Monday, Oct 19, 1987 the Dow Jones Industrial Average fell 22.6% in one session, its largest one-day percentage drop on record. Programmed selling from portfolio insurance strategies added to the decline.
Can a 1987-style crash happen today?
Large drops can still happen, but the market now has circuit breakers. A 7% or 13% drop in the S&P 500 before 3:25 pm ET halts trading for 15 minutes, and a 20% drop closes the market for the day.
What is the SPX gamma flip?
The index level where dealers' net gamma changes sign. Above it, their hedging tends to slow moves. Below it, their hedging tends to add to them. On Oct 16 at 3:52 pm ET, EZPZ put the SPX flip at 7,735.
Why did stocks fall last week?
Chip stocks led the decline on doubts about how long AI spending lasts. Micron fell 5.6% and Intel 5.8% on Oct 16, and the Nasdaq fell about 4.5% for the week.