
Learn Center
Dark Pool Sentiment
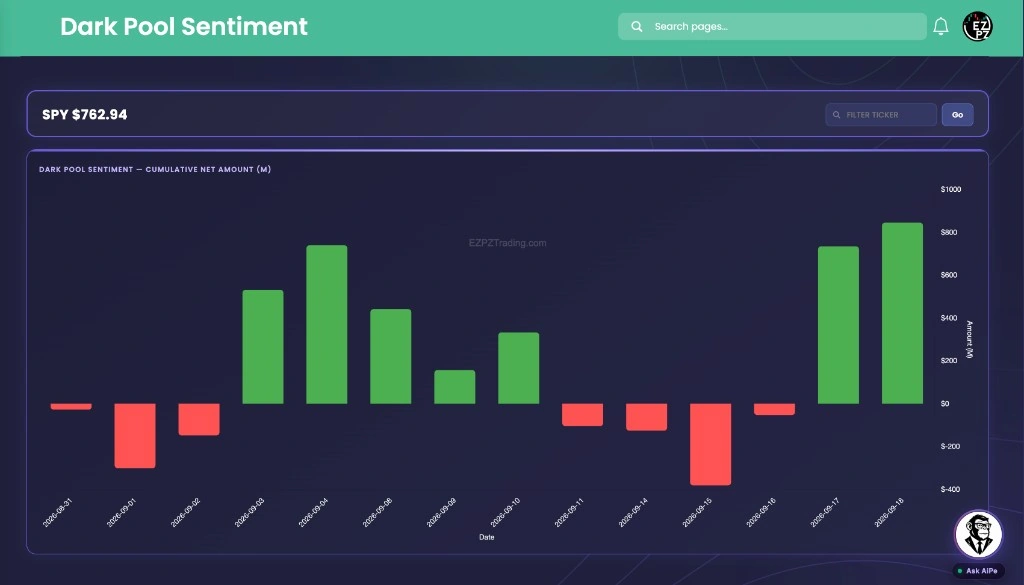
A per-ticker chart of Cumulative Net Amount (M) by Date, with green bars above zero and red bars below zero.
What is dark pool sentiment?
Dark pool sentiment is a per-ticker chart of Cumulative Net Amount (M) by Date. Filter ticker and Go load a name. The page starts on SPY. Green bars sit above zero on positive net days. Red bars sit below zero on negative net days. It is a daily series, not a tape and not a buy list.
Dark pool fills still hit the public tape after they execute. This page does not list those prints and does not rank names. It stays on one ticker and plots that name's Cumulative Net Amount (M) one Date at a time. The chart card is labeled Dark Pool Sentiment, Cumulative Net Amount (M). Date is the bottom axis. Amount (M) is the right axis, drawn with a dollar sign. Hover a Date for Cumulative Net Amount (M). A green bar above zero is a positive net day. A red bar below zero is a negative net day. A busy product can print large net amounts on most dates just because it always trades. If Filter ticker and Go find no data, the header shows a dash and the chart empties. There is no Filters drawer and no table on this page.
On EZPZ, the live chrome titles the page Dark Pool Sentiment. Type a ticker in Filter ticker, then click Go or press Enter. The live price sits next to the symbol. Daily Dark Pool Amount is Amount (M) versus Price by Date, with gray bars that do not flip below zero. Dark Pool Net Flow is one ticker's Buy Amount versus Sell Amount plus Volume bars on the session clock. Block Trades Sentiment is Buy Premium (M) versus Sell Premium (M) by Date, plus Volume Sentiment. Dark Pool Movers and Shakers is SPY Price versus running Buy Amount and Sell Amount, with no ticker search. Largest Dark Pool By Ticker is one row per symbol for the whole session. Largest Single Dark Pool Trades ranks one print at a time. Dark Pool Sectors rolls the session into industry-group bars. Dark Pool Top Levels groups one ticker's prints by price. Dark Pool Index (DIX) is a market-wide DIX % line, not a ticker net chart. Dark Pool Indicator (DPI) is market-wide pressure versus the 20-day average. Dark Pool Flow is the all-ticker off-exchange tape. SPY Flow locks that tape to SPY. Bullish Dark Pool Net Premium ranks names by Net Premium. Bearish Dark Pool Net Premium ranks the same Net Premium figure from the most negative reading. DarkVol Leaders ranks names by DarkVol Ratio %. Live Flow is listed options prints.
How Dark Pool Sentiment works on EZPZ
Read the live price first, then whether the latest bar is green or red, then how the last several Dates line up. It is not a score. Most people start with a run of green or red bars, then hover for Cumulative Net Amount (M). Use Filter ticker when you already have a name. Then open a tape page if you want the prints behind a Date.
How this differs from daily amount, net flow, and the tape
Daily Dark Pool Amount plots unsigned Amount (M) against a gold Price line. This page has no Price overlay. The bars are signed Cumulative Net Amount (M): green above zero, red below zero. Use Daily Amount when you want size next to price. Use this page when you want the daily net lean. Dark Pool Net Flow stays on the session clock with two Amount lines plus Volume. This page is one bar per Date. Block Trades Sentiment keeps buy and sell as two bars per Date, plus Volume Sentiment. Dark Pool Movers and Shakers is locked to SPY Price versus Buy Amount and Sell Amount. This page lets you Filter ticker. Largest Dark Pool By Ticker is a session rank of names. There is no ticker table here. Largest Single Dark Pool Trades ranks one large order at a time. A Date can lead net amount with many smaller prints and never show a single huge fill on that list. Dark Pool Sectors is Highest Premium Inflow and Highest Volume Inflow, then Premium vs Volume bars. Dark Pool Top Levels stacks one ticker by price, not by Date. Dark Pool Index (DIX) is a multi-day percent for the whole market. Dark Pool Indicator (DPI) is a multi-day ratio versus 1.0 neutral. Dark Pool Flow is the live tape with TIME, PREMIUM, DARK RATIO, and DIRECTION. SPY Flow is SPY prints, not these net bars. Live Flow is options, not equity dark pool amount.
Filter ticker, live price, and Go
The top card answers which name you are on and what it last traded at. There is no Filters drawer.
| Control | What you are looking at |
|---|---|
| Filter ticker Go | Loads a ticker. Press Enter or click Go. The page starts on SPY until you search. |
Dark Pool Sentiment, Cumulative Net Amount (M)
The chart is one bar per Date. Read the card label first: Dark Pool Sentiment, Cumulative Net Amount (M). Then read one Date at a time.
| Label | What you are looking at |
|---|---|
| Cumulative Net Amount (M) | Each bar. Green sits above zero when that Date's net amount is positive. Red sits below zero when it is negative. Hover for the dollar value in millions. |
| Amount (M) | The right axis. Values draw with a dollar sign. |
| Date | The bottom axis. Each bar is one session on that ticker. |
How people actually use it
Load a ticker you already watch
Filter ticker, then Go. Note the live price against the most recent bar. A huge net bar on an ETF you always see busy is a different read than a huge bar on a quieter name.
Read the run of dates
Look at whether the last several bars are green, red, or mixed. Then hover the latest Date for Cumulative Net Amount (M). A single green day is a different picture than a week of green bars.
Ask AiPe about the trend
Ask AiPe is labeled Dark Pool Analyst. Ask what the page is showing, whether sentiment is bullish or bearish right now, how it has trended recently, or how to switch tickers.
Open the tape next
This page is a daily series, not a setup. Open Dark Pool Flow for prints, or Daily Dark Pool Amount if you want unsigned Amount next to Price.