Earnings week cheat sheet: the move options are pricing for TSLA, META, NFLX and 13 more
Sixteen large companies report between Oct 19 and Oct 23, 2026. Here is the move the options market is pricing for each one from the Oct 16 close, and which way Friday's Tesla flow leaned going in.

Earnings week Oct 19 to 23, 2026
16 reports Oct 23 straddles Oct 16 close
TSLA
Tesla
Wednesday after the close
Implied move plus or minus 7.5 percent through Oct 23.
- Straddle
- ±$26.49
- ATM IV
- 67.5%
- Oct 16 close
- $354.72
Implied range through Oct 23: $328.23 to $381.21. A size of move, either way.
The week choose a company
Mon 19
Tue 20
Wed 21
Thu 22
Fri 23
Sixteen companies report between Monday and Friday. At the Oct 16 close, the Oct 23 options had already named a size for each one. Western Digital carries the widest priced move. Procter & Gamble carries the narrowest. A bigger number is a wider band around Friday's close. It is not a forecast, and it does not point up or down.
±7.5%
±10.4%
±3.6%
The cheat sheet
Prices and option marks are from the close on Friday, Oct 16, 2026. Report times are as scheduled on Oct 16 and can change, so check the Earnings Calendar before each report.
The cheat sheet
Every report, every range
Monday Oct 19 No reports on the list
Tuesday Oct 20 4 reports
-
GM Before open
General Motors
Implied move plus or minus 6.4 percent
$78.58 $89.34- Close
- $83.96
- Straddle
- ±$5.38
- ATM IV
- 56.8%
-
GE Before open
GE Aerospace
Implied move plus or minus 6.1 percent
$294.63 $333.03- Close
- $313.83
- Straddle
- ±$19.20
- ATM IV
- 55.3%
-
NFLX After close
Netflix
Implied move plus or minus 9.5 percent
$63.86 $77.20- Close
- $70.53
- Straddle
- ±$6.67
- ATM IV
- 85.1%
-
ISRG After close
Intuitive Surgical
Implied move plus or minus 7.9 percent
$392.83 $460.57- Close
- $426.70
- Straddle
- ±$33.87
- ATM IV
- 71.5%
Wednesday Oct 21 6 reports
-
T Before open
AT&T
Implied move plus or minus 4.6 percent
$22.37 $24.51- Close
- $23.44
- Straddle
- ±$1.07
- ATM IV
- 40.9%
-
META After close
Meta Platforms
Implied move plus or minus 7.3 percent
$657.79 $760.87- Close
- $709.33
- Straddle
- ±$51.54
- ATM IV
- 65.9%
-
TSLA After close
Tesla
Implied move plus or minus 7.5 percent
$328.23 $381.21- Close
- $354.72
- Straddle
- ±$26.49
- ATM IV
- 67.5%
-
IBM After close
IBM
Implied move plus or minus 7.8 percent
$214.11 $250.17- Close
- $232.14
- Straddle
- ±$18.03
- ATM IV
- 69.8%
-
TXN After close
Texas Instruments
Implied move plus or minus 8.4 percent
$253.37 $299.59- Close
- $276.48
- Straddle
- ±$23.11
- ATM IV
- 75.3%
-
LRCX After close
Lam Research
Implied move plus or minus 8.2 percent
$242.23 $285.65- Close
- $263.94
- Straddle
- ±$21.71
- ATM IV
- 74.1%
Thursday Oct 22 5 reports
-
PG Before open
Procter & Gamble Narrowest
Implied move plus or minus 3.6 percent
$153.63 $165.07- Close
- $159.35
- Straddle
- ±$5.72
- ATM IV
- 29.4%
-
LMT Before open
Lockheed Martin
Implied move plus or minus 4.9 percent
$524.97 $579.21- Close
- $552.09
- Straddle
- ±$27.12
- ATM IV
- 44.3%
-
SPOT Before open
Spotify
Implied move plus or minus 9.4 percent
$480.64 $580.28- Close
- $530.46
- Straddle
- ±$49.82
- ATM IV
- 85.0%
-
UNP Before open
Union Pacific
Implied move plus or minus 4.3 percent
$276.74 $301.34- Close
- $289.04
- Straddle
- ±$12.30
- ATM IV
- 38.2%
-
WDC After close
Western Digital Widest
Implied move plus or minus 10.4 percent
$297.58 $366.42- Close
- $332.00
- Straddle
- ±$34.42
- ATM IV
- 93.4%
Friday Oct 23 1 report
-
AXP Before open
American Express
Implied move plus or minus 4.7 percent
$298.94 $328.24- Close
- $313.59
- Straddle
- ±$14.65
- ATM IV
- 42.1%
Show as a table
| Reports | Ticker | Company | Oct 16 close | Straddle (Oct 23) | Implied move | Implied range | ATM IV |
|---|---|---|---|---|---|---|---|
| Tue Oct 20, before open | $GM | General Motors | $83.96 | ±$5.38 | ±6.4% | $78.58 to $89.34 | 56.8% |
| Tue Oct 20, before open | $GE | GE Aerospace | $313.83 | ±$19.20 | ±6.1% | $294.63 to $333.03 | 55.3% |
| Tue Oct 20, after close | $NFLX | Netflix | $70.53 | ±$6.67 | ±9.5% | $63.86 to $77.20 | 85.1% |
| Tue Oct 20, after close | $ISRG | Intuitive Surgical | $426.70 | ±$33.87 | ±7.9% | $392.83 to $460.57 | 71.5% |
| Wed Oct 21, before open | $T | AT&T | $23.44 | ±$1.07 | ±4.6% | $22.37 to $24.51 | 40.9% |
| Wed Oct 21, after close | $META | Meta Platforms | $709.33 | ±$51.54 | ±7.3% | $657.79 to $760.87 | 65.9% |
| Wed Oct 21, after close | $TSLA | Tesla | $354.72 | ±$26.49 | ±7.5% | $328.23 to $381.21 | 67.5% |
| Wed Oct 21, after close | $IBM | IBM | $232.14 | ±$18.03 | ±7.8% | $214.11 to $250.17 | 69.8% |
| Wed Oct 21, after close | $TXN | Texas Instruments | $276.48 | ±$23.11 | ±8.4% | $253.37 to $299.59 | 75.3% |
| Wed Oct 21, after close | $LRCX | Lam Research | $263.94 | ±$21.71 | ±8.2% | $242.23 to $285.65 | 74.1% |
| Thu Oct 22, before open | $PG | Procter & Gamble | $159.35 | ±$5.72 | ±3.6% | $153.63 to $165.07 | 29.4% |
| Thu Oct 22, before open | $LMT | Lockheed Martin | $552.09 | ±$27.12 | ±4.9% | $524.97 to $579.21 | 44.3% |
| Thu Oct 22, before open | $SPOT | Spotify | $530.46 | ±$49.82 | ±9.4% | $480.64 to $580.28 | 85.0% |
| Thu Oct 22, before open | $UNP | Union Pacific | $289.04 | ±$12.30 | ±4.3% | $276.74 to $301.34 | 38.2% |
| Thu Oct 22, after close | $WDC | Western Digital | $332.00 | ±$34.42 | ±10.4% | $297.58 to $366.42 | 93.4% |
| Fri Oct 23, before open | $AXP | American Express | $313.59 | ±$14.65 | ±4.7% | $298.94 to $328.24 | 42.1% |
The tickets are the full record. The ledger below puts all sixteen on one percent scale, so the sizes compare at a glance. Each band runs the same distance up and down from zero, because a straddle prices a move in either direction. Sort it by size, or choose a row for its dollar range.
The ledger
Sixteen priced moves, one scale
Tue 20 before the open
Tue 20 after the close
Wed 21 before the open
Wed 21 after the close
Thu 22 before the open
Thu 22 after the close
Fri 23 before the open
Tesla
Wednesday after the close
- Move
- ±7.5%
- Straddle
- ±$26.49
- ATM IV
- 67.5%
- Oct 16 close
- $354.72
Where the earnings premium sits
Implied volatility does not live on one expiry. Each expiry has its own curve across strikes. For Tesla at the Oct 16 close, the Oct 23 expiry is the first one that holds Wednesday's report, and it stands well above its neighbors: 67.1% at the money against 34.4% for Oct 19, about double. Later expiries step down as the report becomes a smaller part of their life.
The event premium · TSLA
One expiry stands taller than the rest
2.0× the Oct 19 IV
On EZPZ, Volatility Surface 3D draws the full surface live for any ticker you search.
What stands out
- Wednesday night is the crowded slot. Meta, Tesla, IBM, Texas Instruments and Lam Research all report after the close on Oct 21. Each one is priced for a move of 7% or more.
- Chip names carry wide pricing. Western Digital (±10.4%), Texas Instruments (±8.4%) and Lam Research (±8.2%) report after the PHLX chip index fell for eight straight sessions, as Reuters reported on Oct 16.
- Tesla and Meta are priced almost alike. TSLA at ±7.5% and META at ±7.3%, both reporting after Wednesday's close. Tesla's range runs from $328.23 to $381.21, with $354.72 in the middle.
- Staples price small. Procter & Gamble at ±3.6% is the narrowest on the list, about a third of Western Digital's.
What the flow showed into Tesla
The straddle sizes the move. It does not say which way the money leaned. For that, we read Tesla's tape from Friday, Oct 16, the session that set those marks. The short answer is split.
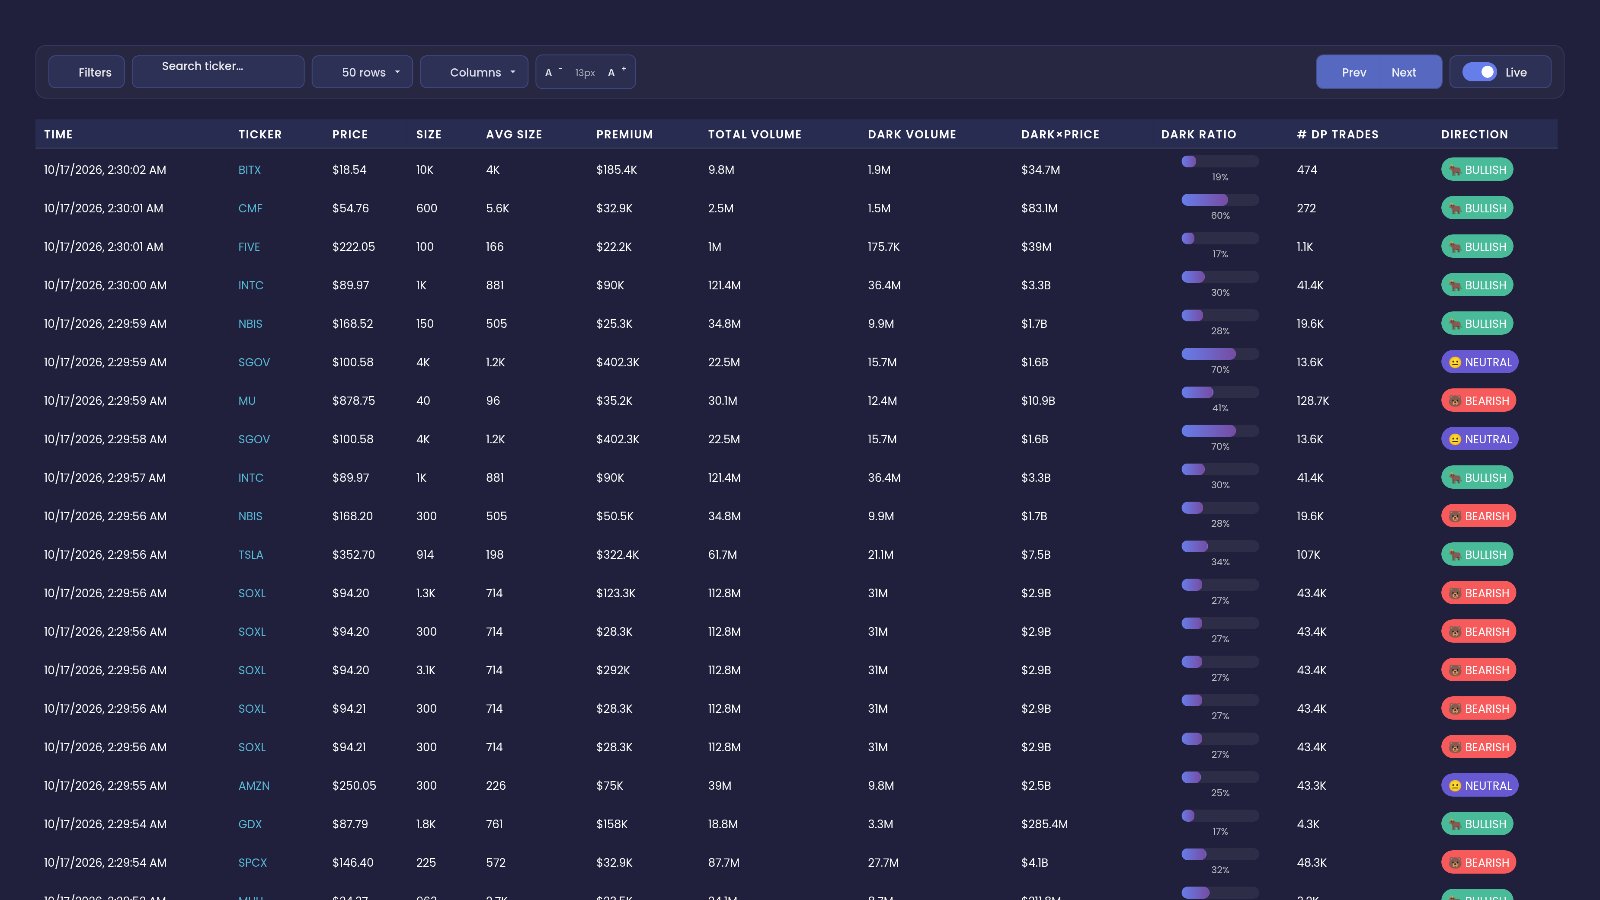
Unusual premium was close to even. 2,513 unusual TSLA prints moved $462.7M in premium on Friday. The feed tagged $118.4M as bullish and $134.3M as bearish, by where each print traded against the bid and ask. The largest share, $209.9M, traded near the middle and carries no lean. Calls drew more premium than puts, $274.7M to $188.0M, but a call print can be a sale as easily as a buy.
The biggest Oct 23 prints sat inside the range. Twice in the afternoon, the $362.50 and $377.50 Oct 23 calls printed in the same second at the same size: 1,043 contracts at 1:29 pm ET and 1,138 at 2:02 pm. That is the footprint of a call spread, with both strikes inside the $328.23 to $381.21 implied range. The tape does not show which side opened it. The largest Oct 23 print tagged bullish was 1,872 of the $390 calls at 10:34 am.
Dealer gamma changes sign above the close. For the Oct 23 expiry, EZPZ's GEX calculation puts net gamma below zero at most strikes up to $370, deepest at $350, just under the $354.72 close. It turns positive from $375 and peaks at $390, just past the top of the implied range. The crossing nearest the close is about $365. Negative gamma is where dealer hedging can add to a move. Positive gamma is where it tends to slow one.
The positioning · Fri Oct 16
Which way Tesla's money leaned
01 Unusual premium, all expiries
$462.7M across 2,513 prints
- Tagged bullish
- $118.4M
- Neutral, near the mid
- $209.9M
- Tagged bearish
- $134.3M
02 The largest Oct 23 prints
- 2:02 pm $362.50 call 1,138 contracts $1.07M neutral · paired
- 2:02 pm $377.50 call 1,138 contracts $560K neutral · paired
- 1:29 pm $362.50 call 1,043 contracts $969K neutral · paired
- 1:29 pm $377.50 call 1,043 contracts $503K neutral · paired
- 12:16 pm $367.50 call 1,017 contracts $946K neutral
- 10:34 am $390.00 call 1,872 contracts $899K bullish
03 Dealer gamma by strike, Oct 23 expiry
This is one session of context, and it shifts as positions open and close. It is not a signal to buy or sell. The same reads are live on EZPZ for any ticker.
Finn draws the range
EZPZ Finn, the free desktop app, can draw that implied range on a TradingView chart. For Tesla the two lines are $328.23 (implied range low) and $381.21 (implied range high, Oct 23). Finn draws the levels. It does not say which way the stock goes.
How to read an implied move
An at-the-money straddle pays off if the stock moves far enough in either direction. What traders pay for it is a rough read on how big a move the market expects, without saying which way. Divide the straddle price by the stock price and you get the implied move as a percentage.
Three things to keep in mind
- It covers the whole week, not only the report. These straddles expire Friday, Oct 23, so they include the rest of the week's trading as well as the earnings reaction. For a Friday-morning reporter like American Express, the report is nearly all of it.
- It is a price, not a forecast. Stocks regularly move more or less than their options imply. The number tells you what the market paid for, nothing about what happens.
- It gets stale fast. Implied moves shift as prices and volatility change through the week, and implied volatility usually drops sharply once a report is out. These numbers describe the Oct 16 close.
Track it live on EZPZ
Each card opens the live page, the free delayed page when there is one, and the plain-English guide.
Ask AiPe about a report
On Pro and up, open Expected Move for a ticker and click Ask AiPe in the bottom right. Ask what range the options market is pricing for this week, or how the Oct 23 expiry compares with the next one. AiPe explains the data on your screen. It doesn't tell you what to trade, and it can be wrong.
FAQ
What is an earnings implied move?
The size of move, in either direction, that options prices imply for a stock around its earnings report. A common shortcut is the at-the-money straddle price divided by the stock price.
Which stock has the biggest implied move this week?
Western Digital, at about ±10.4% through the Oct 23 expiry as of the Oct 16 close, followed by Netflix (±9.5%) and Spotify (±9.4%).
What is Tesla's implied move for Q3 earnings?
About ±7.5%, or ±$26.49 on a $354.72 close, using the Oct 23 at-the-money straddle at the Oct 16 close. Tesla reports after the close on Wednesday, Oct 21. That puts the range at $328.23 to $381.21.
Does the implied move tell me which way the stock will go?
No. A straddle is priced for movement in either direction, so its price says nothing about direction. The range runs both ways from the close.
Which way is TSLA options flow leaning into earnings?
On Friday, Oct 16, it was split. Of $462.7M in unusual TSLA premium, $118.4M was tagged bullish and $134.3M bearish, with $209.9M near the middle. Oct 23 dealer gamma was negative below about $365 and positive above it, largest at $390. That is context from one session, not a buy or sell signal.
Why does implied volatility fall after earnings?
Once the report is out, the uncertainty it carried is gone, so the extra premium built into the options before the report usually comes out of them. Traders call this IV crush.