
Learn Center
Earnings Surprises
Whether a company beat or missed analyst EPS estimates each quarter, with year totals, a trend chart and a quarter by quarter table for one ticker.
What is an earnings surprise, and how do you read it on EZPZ?
An earnings surprise is the gap between the earnings per share (EPS) a company actually reported for a quarter and the EPS analysts expected. A positive surprise means a beat, a negative one means a miss. The EZPZ Earnings Surprises page shows this for one ticker: two year-total pies, an EPS trend chart, and a table with one row per quarter.
The surprise matters because the market prices in expectations before the report. A company can earn more than last year and still miss, and a company can earn less and still beat. Read the gap in two ways. Surprise is the difference in dollars per share. Surprise % scales that difference against the estimate, so a two cent beat means more on a small EPS than on a large one. Then look at the run of quarters instead of one print. A stock that beats almost every quarter has a track record, and a first miss after a long streak is a change worth checking against the news. A surprise says how a past report compared with forecasts. It does not say where the stock goes next, and the price reaction also depends on guidance and on what the market already expected.
How the Earnings Surprises page works on EZPZ
The page opens on AAPL. The header card shows the word Investing, then the heading. It reads Earnings Surprises until the first result loads, then shows the ticker with its current price in a blue badge, such as AAPL $336.08. On the right, type a symbol and press Enter or click Search. The box uppercases what you type and does nothing when it is empty. A spinner shows while the request runs. The page loads once on open and once per search. It does not refresh on its own.
Below the header there are three blocks, top to bottom: the two year-total pies, the EPS Trend chart, and the quarterly table. The pies summarize whole years, the chart shows every quarter as a line, and the table lists each quarter with exact values.
How Earnings Surprises differs from the rest of investing
This page is the report card. It compares what a company delivered with what analysts expected. Analyst Estimates shows the forecasts before a report, and Price Target shows where analysts think the stock should trade. Recommendation Trends counts analysts by rating bucket, and Upgrade and Downgrade logs each firm's rating changes, which often follow an earnings report. Social Sentiment tracks the retail conversation around it.
Three more pages are close by. Ticker Performance shows how the price moved over the same stretch. Basic Financials and Financial Statements show the business behind the EPS number. The rest of the investing set is Company Profile, Company News, Market News, Sector Metrics, Historical Market Cap, Dividends, Support and Resistance, and Congressional Trading. For a single-symbol view of the options side, see Ticker Explorer.
The two year-total pies
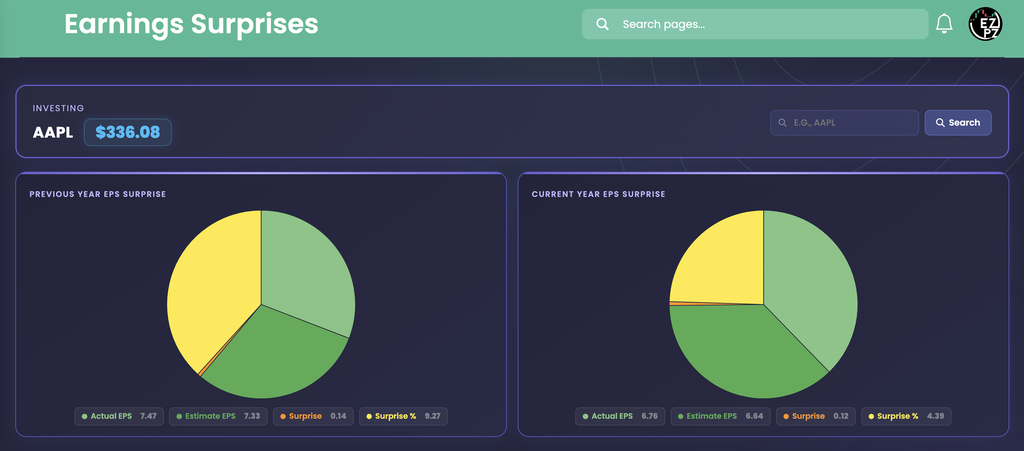
Previous Year EPS Surprise and Current Year EPS Surprise each add up the quarters that belong to one year. Each pie has four slices and four value chips underneath. The chips act as the legend, since the pie itself has no legend and no labels. Hover a slice to see its label and value.
| Chip and slice color | What you are looking at |
|---|---|
| Actual EPS (light green) | The sum of the reported EPS for the quarters in that year. |
| Estimate EPS (green) | The sum of the analyst estimates for those same quarters. |
| Surprise (orange) | The sum of the quarterly Surprise values, in dollars per share. The thin slice. |
| Surprise % (yellow) | The sum of the quarterly Surprise % values, in percentage points. |
In the capture the Previous Year pie reads Actual EPS 7.47, Estimate EPS 7.33, Surprise 0.14, and Surprise % 9.27. The table backs this up: the four quarters labelled 2025 (Q-1 to Q-4) have actual EPS of 2.40, 1.65, 1.57 and 1.85, which add to 7.47, and surprises of 0.00, -0.01, 0.11 and 0.04, which add to 0.14. The Current Year pie reads 6.76, 6.64, 0.12 and 4.39, and it covers only the three quarters reported so far.
- Which years: Current Year is the present calendar year and Previous Year is the one before it. Each row is matched by its Year + Quarter label.
- Partial years: early in a year the Current Year pie has fewer quarters than the Previous Year pie, so compare Actual EPS against Estimate EPS inside one pie, not across the two.
- No rows for a year: the chips read 0.00 and the pie draws four equal slices as a placeholder.
The EPS Trend chart
The EPS Trend, Actual vs Estimate vs Surprise chart plots every quarter the page loaded, oldest on the left and newest on the right. In the capture the X axis runs from Q-4 2016 to Q-3 2026 with one label per quarter. It has three smoothed lines with a dot on each quarter, and a legend at the top.

| Line | What you are looking at |
|---|---|
| Actual EPS (purple) | The EPS the company reported for each quarter. |
| Estimate EPS (green) | The analyst estimate for the same quarter. |
| Surprise (red) | Actual minus Estimate, in dollars per share, on the same axis as the other two. |
Read it in three steps. First, look for a gap between the purple and green dots. Purple above green is a beat and green above purple is a miss. Second, watch the red line against zero. Above zero is a beat and below is a miss. Third, look at the shape. In the capture the purple and green lines rise and fall together in a repeating pattern, with a high point once a year at the Q-1 quarters, and the Q-1 2026 point is the highest at about 2.8. The red line is close to zero on most quarters, with its largest bump of roughly 0.4 at Q-2 2021 and a dip near -0.1 at Q-1 2023. Those chart readings are approximate, so use the table for exact values.
- Hover: the tooltip lists all three values for the quarter under your cursor, even if you are not on a dot.
- Hide a line: click a legend entry to turn that line off and click it again to bring it back.
- The red line looks flat: Surprise is in dollars on the same axis as EPS, so small beats sit close to zero. Use the Surprise % column in the table to judge the size of a beat against the estimate.
- Seasonality: quarters are not equally strong for many companies, so compare a quarter with the same quarter a year earlier, not with the one just before it.
Reading the quarterly table
The table has seven columns and one row per quarter. It shows ten rows per page with paging under it and opens sorted by Period with the newest first. Click a header to sort by that column. There is no text search box and no page-length control.

| Column | What you are looking at |
|---|---|
| Ticker | The symbol you searched, in blue. It is the same on every row. |
| Year + Quarter | The quarter's label, printed like Q-3 2026. |
| Period | The date the quarter ended, printed as year, month, day. |
| Actual EPS | The EPS the company reported for the quarter. |
| Estimated EPS | The analyst estimate for that quarter. |
| Surprise | Actual minus Estimated, in dollars per share. Green at zero or above, red below zero. |
| Surprise % | The surprise as a percent of the estimate, with the same green and red coloring. |
In the capture, the newest quarter, Q-3 2026, reported 1.91 against an estimate of 1.93, a miss of -0.02 or -0.89%. The quarter before it beat by 0.02, or 1.09%, and Q-3 2025 beat by 0.11, or 7.34%, the biggest beat in the visible rows. Two rows show why the percent column matters. Q-1 2025 reads 2.40 against 2.40, a Surprise of 0.00 in green, yet Surprise % is 0.15%, because the EPS values are rounded to cents and the percent uses the unrounded numbers. And Q-2 2024 reads a Surprise of -0.00 in red beside -0.03%, a tiny miss that rounds to zero.
Working the page
- Search a ticker: type a symbol, then press Enter or click Search. The heading changes to the ticker and its price.
- No price badge: if the symbol has no current price, the badge hides but the earnings rows still load.
- Empty results: a ticker with no reported quarters shows an empty table, an empty chart, and chips at 0.00.
- No refresh: the page loads once and after each search. Search again to pull the latest.
How people actually use it
Check the track record
Count how many of the last eight or ten rows are green. A stock that beats almost every quarter sets a high bar for the next report.
Size a beat or a miss
Compare the Surprise % column down the rows to see which quarters were large relative to the estimate. Q-3 2025 at 7.34% stands out beside Q-2 2025 at -0.58% in the capture.
Compare year to year
Use the two pies to see whether the last full year beat in total. AAPL in the capture, 7.47 actual against 7.33 estimated, did.
Prepare for the next report
Look at the table before an earnings date, then check Analyst Estimates for the new forecast and Upgrade and Downgrade for firms that changed their rating.