
Learn Center
Earnings Calendar
A weekday by weekday schedule of which public companies report quarterly results, with report timing and analyst estimates.
What is an earnings calendar, and how do you read the EZPZ Earnings Calendar?
An earnings calendar lists the dates on which public companies are scheduled to report quarterly results. The EZPZ Earnings Calendar shows one trading week at a time, Monday through Friday, with a button for each day. Each row is one company reporting that day, with its ticker, report date, report time, and the analyst estimates for EPS and revenue.
The date matters because the market prices in expectations before a report. A stock can gap up or down the next session on the size of the gap between what a company reports and what analysts expected, and options prices tend to carry extra implied volatility into a known report date and lose it quickly afterward. On EZPZ, this page is where you check who reports on a given day and whether the report lands before the open or after the close, so you can decide whether to hold a position through it. The page lists what is scheduled and estimated. It does not show the results themselves, and nothing on it is a trade idea.
How the Earnings Calendar works on EZPZ
The page has two parts: a bar of week and day buttons, and one table for the day you picked. It opens on today's weekday. The table loads when you open the page and again each time you change the day or the week. It does not refresh on its own.
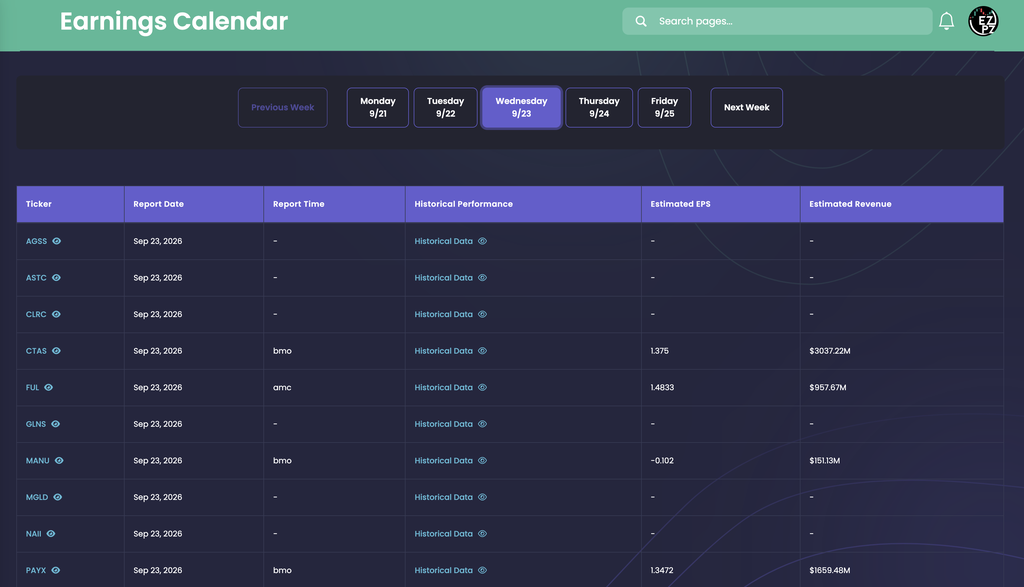
The week bar
| Control | What it does |
|---|---|
| Monday to Friday | One button per weekday, each with its date under the name (Monday 9/21 in the capture). The active day is filled in purple. Weekends have no button. |
| Previous Week | Steps back one week. It is greyed out while you are on the current week, so the page does not look back before this week. |
| Next Week | Steps forward one week. Your chosen weekday stays selected, so Wednesday stays Wednesday. |
Previous Week and Next Week are disabled while a week is loading, and a small spinner shows in the middle of the page. If a day has nothing scheduled, the table body is hidden and only the column headers stay. That usually means no companies were listed for that day, not that the page broke, so try another day or a later week.
The earnings table
The table shows ten rows per page with paging controls below. There is no search box, so to find one ticker you move through the days and pages.
| Column | What it shows |
|---|---|
| Ticker | The symbol, in blue, with a small eye icon. Clicking either opens an Earnings History chart for that ticker. |
| Report Date | The scheduled date, written like "Sep 23, 2026". Every row on one day button shares it. |
| Report Time | When in the trading day the company reports. bmo is before market open and amc is after market close. A dash means no time is on file. |
| Historical Performance | A "Historical Data" link with an eye icon. It opens a Quarterly Earnings table. |
| Estimated EPS | The analyst estimate for earnings per share, printed as the raw number with no dollar sign (1.375, 1.4833). A dash means no estimate on file. A negative number means analysts expect a loss. |
| Estimated Revenue | The analyst revenue estimate in millions of dollars, printed with two decimals ("$3037.22M"). It never switches to billions, so $3037.22M is about $3.04 billion. |
The Report Time column has its own sort order. Click its header and the before open rows (bmo) come first, then the after close rows (amc), then the rows with a dash. That is the fastest way to split a busy day into a morning group and an evening group. The table opens in the order the data arrives, not sorted by anything, and it goes back to that order every time you change the day or the week.
What the capture shows
- The day. Wednesday 9/23 is selected, and every row reads Sep 23, 2026. The capture was taken on Monday 9/21, which is why Previous Week is greyed out.
- Four rows have estimates. CTAS reports bmo with EPS 1.375 and revenue $3037.22M. FUL reports amc with 1.4833 and $957.67M. MANU reports bmo with EPS -0.102 and $151.13M. PAYX reports bmo with 1.3472 and $1659.48M.
- A negative estimate. MANU's EPS of -0.102 means analysts expected a small loss per share, so a "beat" there can still be a loss.
- Six rows are mostly dashes. AGSS, ASTC, CLRC, GLNS, MGLD, and NAII show a dash for Report Time, Estimated EPS, and Estimated Revenue. They are scheduled for the day, but the feed had no time or estimate for them when the page loaded.
- Timing splits the day. Of the four rows with a time, three report before the open and one (FUL) reports after the close. The after close report does not move the stock until the next session's premarket.
- Only the first page is shown. The capture cuts off at ten rows. More rows for the same day sit on the next pages of the table.
The two history windows
Each row has two ways to open a history window. Both load when you click, with a spinner while they fetch.
| Window | Opened from | What it shows |
|---|---|---|
| Earnings History | The ticker or its eye icon | A line chart with two lines, Reported EPS in purple and Estimated EPS in green, plotted by report date from oldest to newest. The title carries the ticker. |
| Quarterly Earnings | Historical Data or its eye icon | A table with Report Date, Actual EPS, Estimated EPS, Quarter, Actual Revenue, and Estimated Revenue. Revenue prints in compact form ("$3B"), a different style from the main table. |
To read the chart, look at whether the purple line sits above or below the green one at each date. Above means the company reported more than analysts expected, and below means less. To read the table, compare Actual EPS with Estimated EPS in the same row. A row with a dash for Actual is usually a report that has not happened yet. The Quarterly Earnings table does not open in date order, so click the Report Date header (twice for newest first) to put the latest quarters at the top.
How the Earnings Calendar differs from other calendars on EZPZ
This page is about single companies and their report dates. The other Calendars pages track different kinds of dates.
- Economic Calendar lists data releases and central bank events that can move the whole market, not one company.
- Schedule is EZPZ's own calendar of live sessions and events, not a market calendar.
- IPO Calendar lists companies about to start trading.
- FDA Calendar lists drug decision dates that can move biotech stocks.
- Market Holidays lists the days the U.S. exchanges are closed or close early, which can shift a report day.
Once a report has happened, Earnings Surprises shows the reported EPS against the estimate for one ticker, and Analyst Estimates shows where analysts expect revenue and EPS to go over the next periods. For the options side, Expected Move shows the range the options market is pricing into an expiration, and IV Rank shows whether implied volatility is high or low against its own history. Ticker Explorer pulls a single symbol together in one place.
How to get more out of the Earnings Calendar
- Sort by Report Time first. One click on that header separates before open reports from after close reports, which is the split that matters for when a stock reacts.
- Read the day, not just the ticker. The day buttons let you scan Monday through Friday for names on your watchlist, so you see clusters of reports in the same week.
- Read estimates as a benchmark. Estimated EPS and Estimated Revenue are the bar a report is measured against, not a prediction of the result.
- Convert revenue by hand. Because the column stays in millions, divide by 1,000 to read a large figure in billions ($1659.48M is about $1.66B).
- Go a week ahead. Next Week shows what is scheduled beyond the current one, useful when you plan an options position that expires around a report.
- Pair it with the options pages. Check Expected Move and IV Rank for the same ticker before deciding to hold through a report.
What to check before you rely on it
- Dates can move. A date listed weeks ahead can shift, especially before a company confirms it. Look again close to the day.
- A dash is not a zero. A dash in Report Time or an estimate means the feed had nothing to show. It also appears when a real value is exactly zero, so an estimate of 0 prints as a dash.
- Not every company has estimates. Some rows carry no estimate at all, so their EPS and revenue cells stay blank. The capture has six such rows out of ten.
- Only weekdays. The page loads Monday through Friday. A company that reports on a weekend will not appear.
- Current week and forward only. Previous Week is disabled on the current week, so use the history windows for past quarters.
- Estimates are not results. The table shows what is expected. Actual results appear only in the Quarterly Earnings window once a report is out.
- Times follow the exchange's session. bmo and amc are relative to the U.S. trading day, not your local clock.
Who uses the Earnings Calendar
Options traders
Check whether a name reports before its expiration, and whether the report lands before the open or after the close.
Swing and position traders
Decide whether to hold through a report and its overnight gap, or close out ahead of the date.
Watchlist followers
Step through Monday to Friday to see which names on a list report this week and which report next week.
Investors
Open Historical Data before a report to see how a company's actual EPS has compared with estimates in past quarters.