NVDA earnings tonight: options price a ±8.4% move. Here is the range, the flow and the gamma map
Nvidia reports after the close on Tuesday, Nov 17, 2026, its first report since Jensen Huang resigned. At the Nov 16 close, the Nov 18 options priced a move of about ±8.4%. Here is the range, where the volatility sits, which way Monday's flow leaned and where dealer gamma changes sign.

NVDA earnings Tue Nov 17, after the close
Nov 16 close straddles by expiry
NVDA
Nvidia
Reports Tue Nov 17 after the close
Implied move plus or minus 8.4 percent through Wed Nov 18.
- Expiry
- Wed Nov 18
- Straddle
- ±$13.05
- ATM IV
- 141.4%
- Nov 16 close
- $156.14
Implied range through Wed Nov 18: $143.09 to $169.19. A size of move, either way.
Fri Nov 20 gamma levels an estimate, against the Wed Nov 18 range
- Put wall (est.) $150
- Gamma flip (est.) $161.25
- Call wall (est.) $170
By expiry choose an expiry
Wed Earnings
Fri
Mon
Wed
Fri
Mon
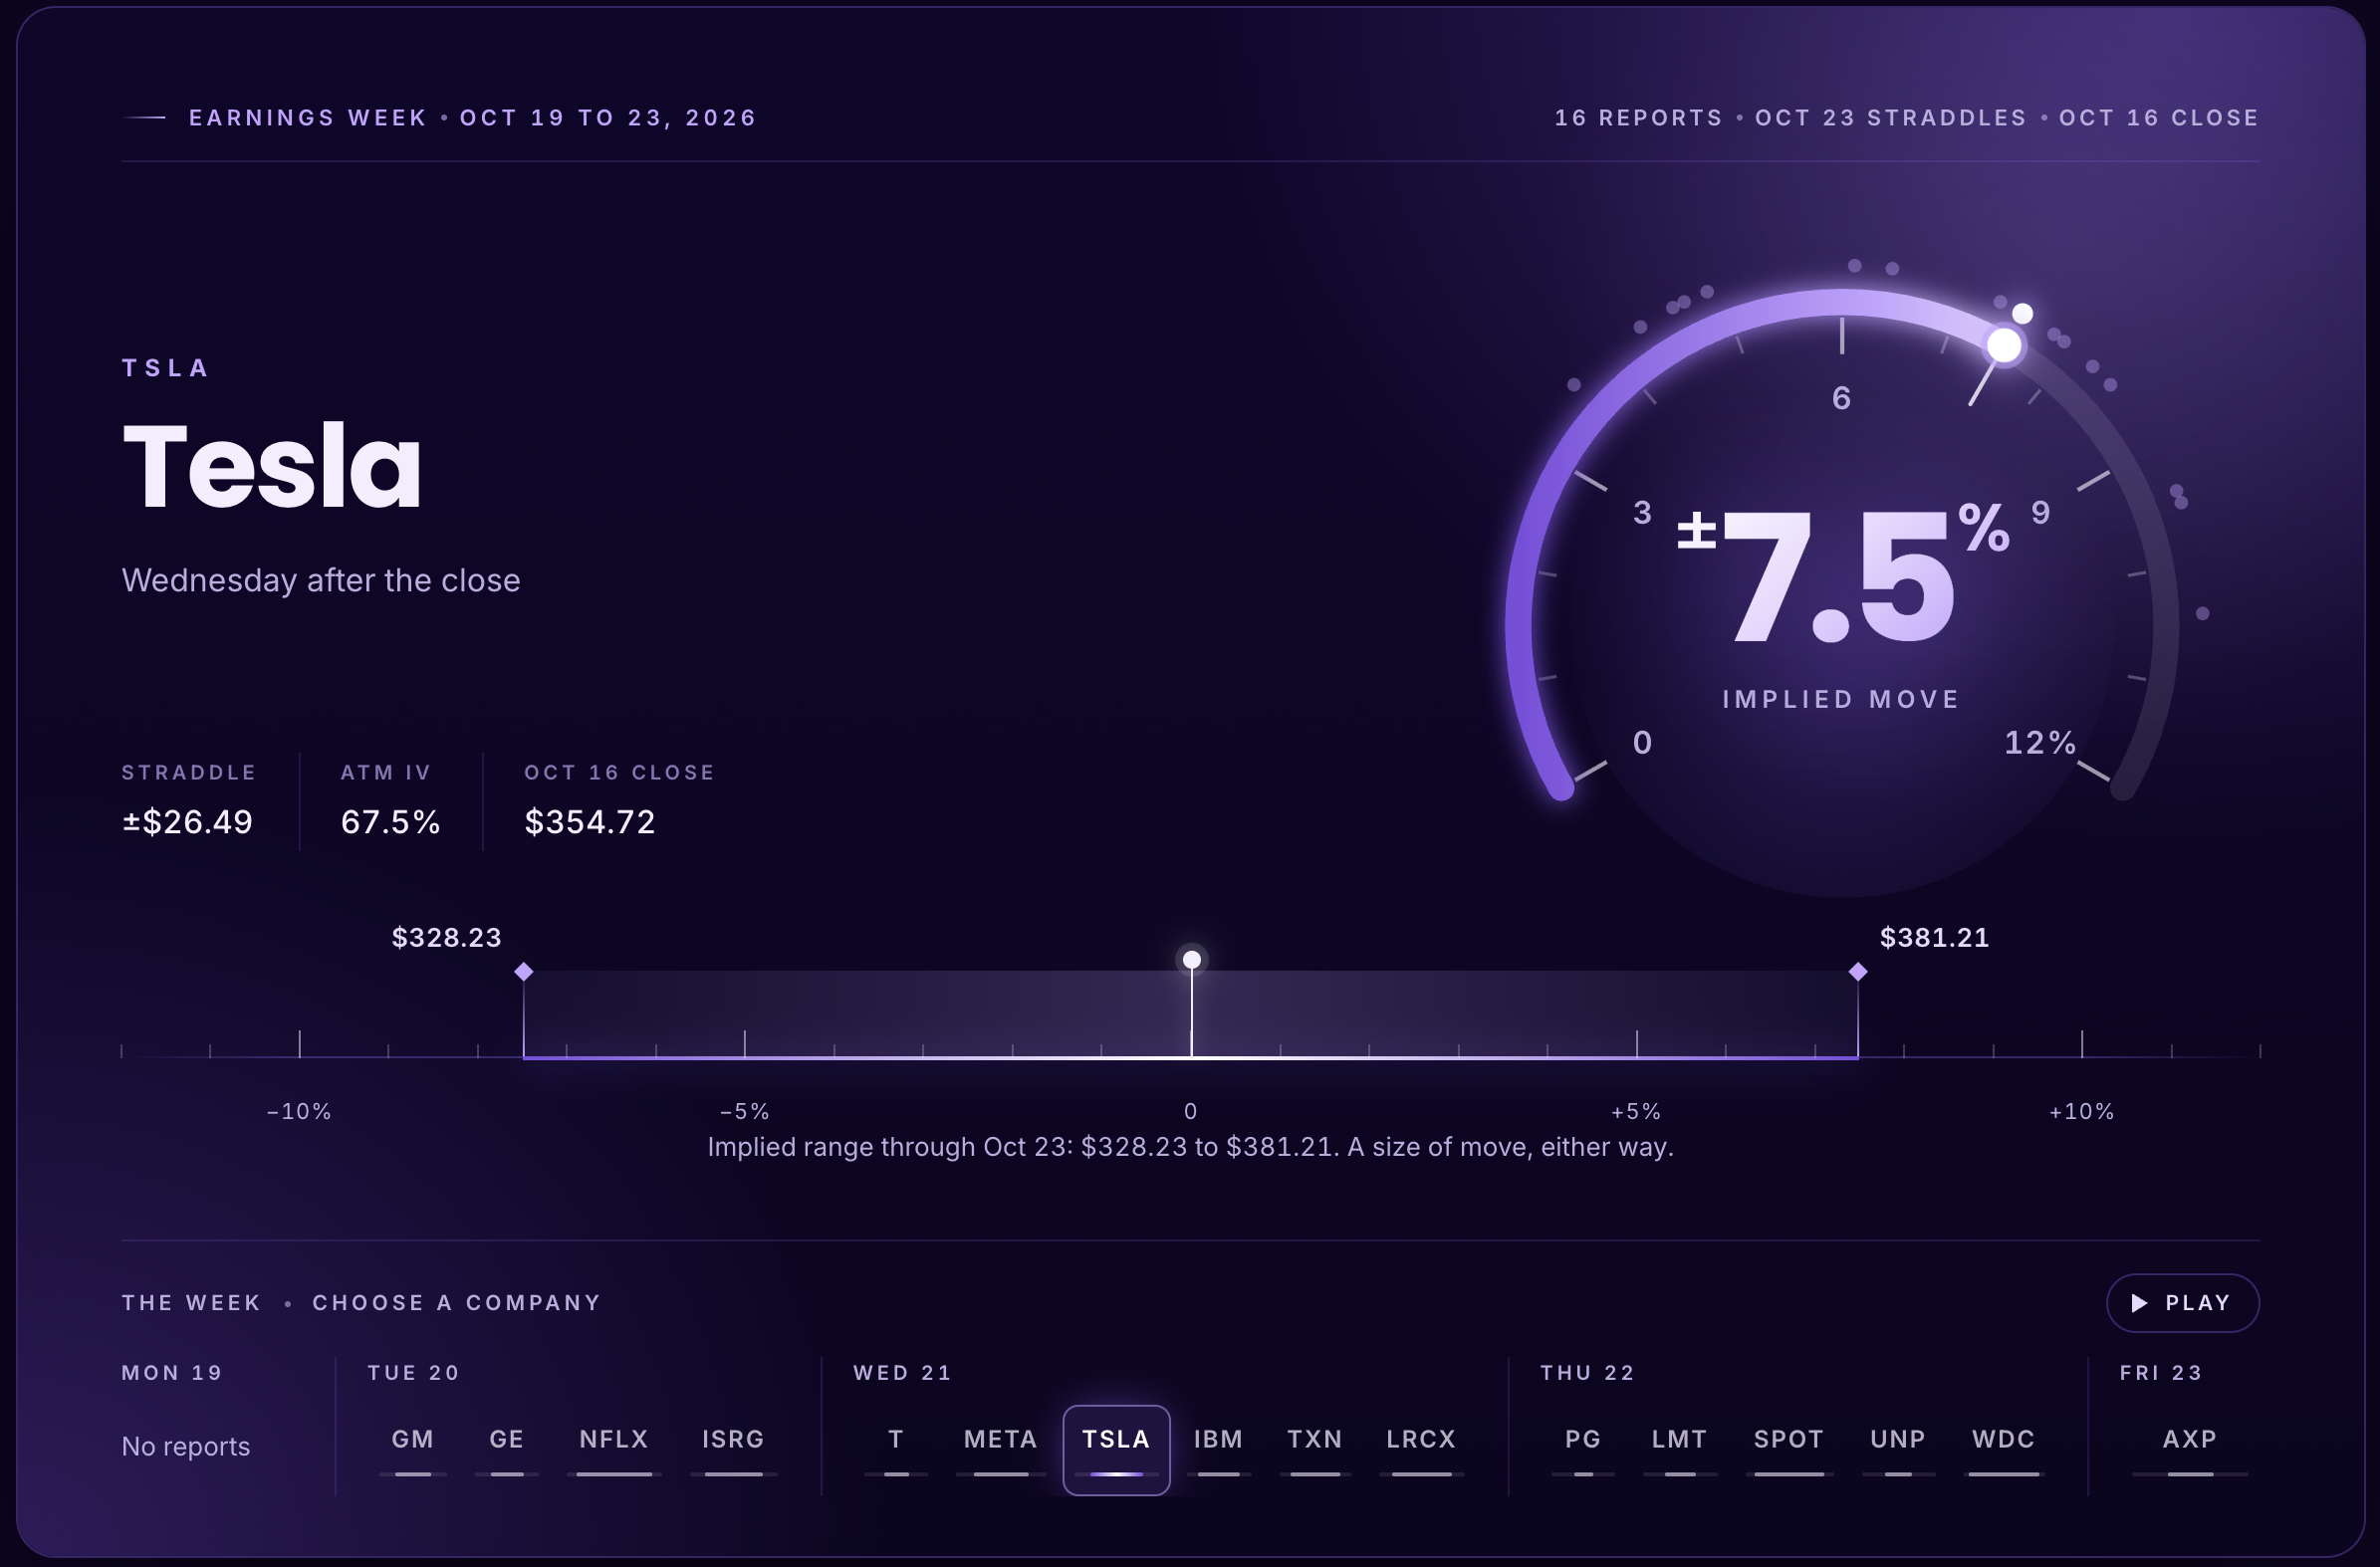
Nvidia reports after the close today, Tuesday, Nov 17. At Monday's close, the options that expire Wednesday, Nov 18, the first expiry after the report, priced a move of about ±8.4%. That is ±$13.05 around a $156.14 close, a range of $143.09 to $169.19. It is the size of move the market paid for. It does not point up or down.
±8.4%
$143.09 to $169.19
~141%
The setup
This is Nvidia's fiscal third-quarter report. In August, the company guided revenue to $108.0 billion, plus or minus 2%, and gross margin to about 74.0%, with no data center compute revenue from China assumed. Results are due at about 4:20 pm ET, with the call at 5:00 pm ET.
It is also the first report since Nvidia's Nov 12 announcement that Jensen Huang resigned as CEO, president and board member. CFO Colette Kress is interim CEO while the board searches for a permanent one. Kress is expected to lead the call.
The stock comes in weak. NVDA closed at $156.14 on Monday, down from $200.13 on Nov 4, a 22% drop in eight sessions that included a 9.3% fall on Nov 5.
The move options are pricing
Every number here is from the close on Monday, Nov 16, 2026. NVDA lists options that expire Monday, Wednesday and Friday, so Wednesday's Nov 18 expiry is the first one that holds the report and very little else.
| Expiry | Straddle ($155 strike) | Implied move | Implied range |
|---|---|---|---|
| Wed Nov 18 | $13.05 | ±8.4% | $143.09 to $169.19 |
| Fri Nov 20 | $15.08 | ±9.7% | $141.07 to $171.22 |
Put on one price line, the night's levels look like this. The gamma levels come from the Nov 20 expiry and are covered further down.
The levels · NVDA
Where the priced range sits
±8.4% priced for Nov 18
As of the Nov 16 close · NVDA $156.14
| Level | Price |
|---|---|
| Nov 20 implied range, high | $171.22 |
| Nov 18 implied range, high | $169.19 |
| Call wall | $170 |
| Gamma flip (est.) | $161.25 |
| Nov 16 close | $156.14 |
| Put wall | $150 |
| Nov 18 implied range, low | $143.09 |
| Nov 20 implied range, low | $141.07 |
The priced move has come down as the stock fell. Using the same Nov 18 straddle, our Earnings Calendar stored a reading at each close, from ±10.3% on Nov 10 to ±8.4% on Monday. Part of that drift is time: the earlier readings also cover more ordinary trading days before Wednesday.
The run-up · NVDA
The priced move, close by close
±8.4% at the Nov 16 close
Wed Nov 18 expiry · as of the Nov 16 close
| Close of | NVDA close | Implied move |
|---|---|---|
| Mon Nov 9 | $178.67 | ±9.6% |
| Tue Nov 10 | $168.89 | ±10.3% |
| Wed Nov 11 | $173.73 | ±9.3% |
| Thu Nov 12 | $166.19 | ±9.5% |
| Fri Nov 13 | $162.85 | ±8.6% |
| Mon Nov 16 | $156.14 | ±8.4% |
Where the earnings premium sits
Implied volatility is priced expiry by expiry. The report lands inside the Nov 18 expiry, and its at-the-money IV is far above the ones after it. Each later expiry spreads the same one-off event over more ordinary days, so its IV steps down.
The event premium · NVDA
One expiry carries the report
141.4% Nov 18 ATM IV
As of the Nov 16 close · NVDA $156.14
| Expiry | Days | ATM IV | Straddle | Priced move |
|---|---|---|---|---|
| Wed Nov 18 (earnings expiry) | 1 | 141.4% | $13.05 | ±8.4% |
| Fri Nov 20 | 3 | 115.6% | $15.08 | ±9.7% |
| Mon Nov 23 | 6 | 92.6% | $16.00 | ±10.2% |
| Wed Nov 25 | 8 | 87.8% | $17.18 | ±11.0% |
| Fri Nov 27 | 10 | 81.3% | $17.58 | ±11.3% |
| Mon Nov 30 | 13 | 77.6% | $18.93 | ±12.1% |
At the money, Nov 18 IV was 141.4%, then 115.6% for Nov 20, 92.6% for Nov 23 and 77.6% for Nov 30. Once the report is out, most of the extra premium in the Nov 18 options usually comes out of them. Traders call that IV crush.
What Monday's flow showed
The straddle sizes the move. It does not say which way the money leaned. For that, we read NVDA's unusual options tape for the Nov 16 session. The short answer is split, and mostly not about this week.
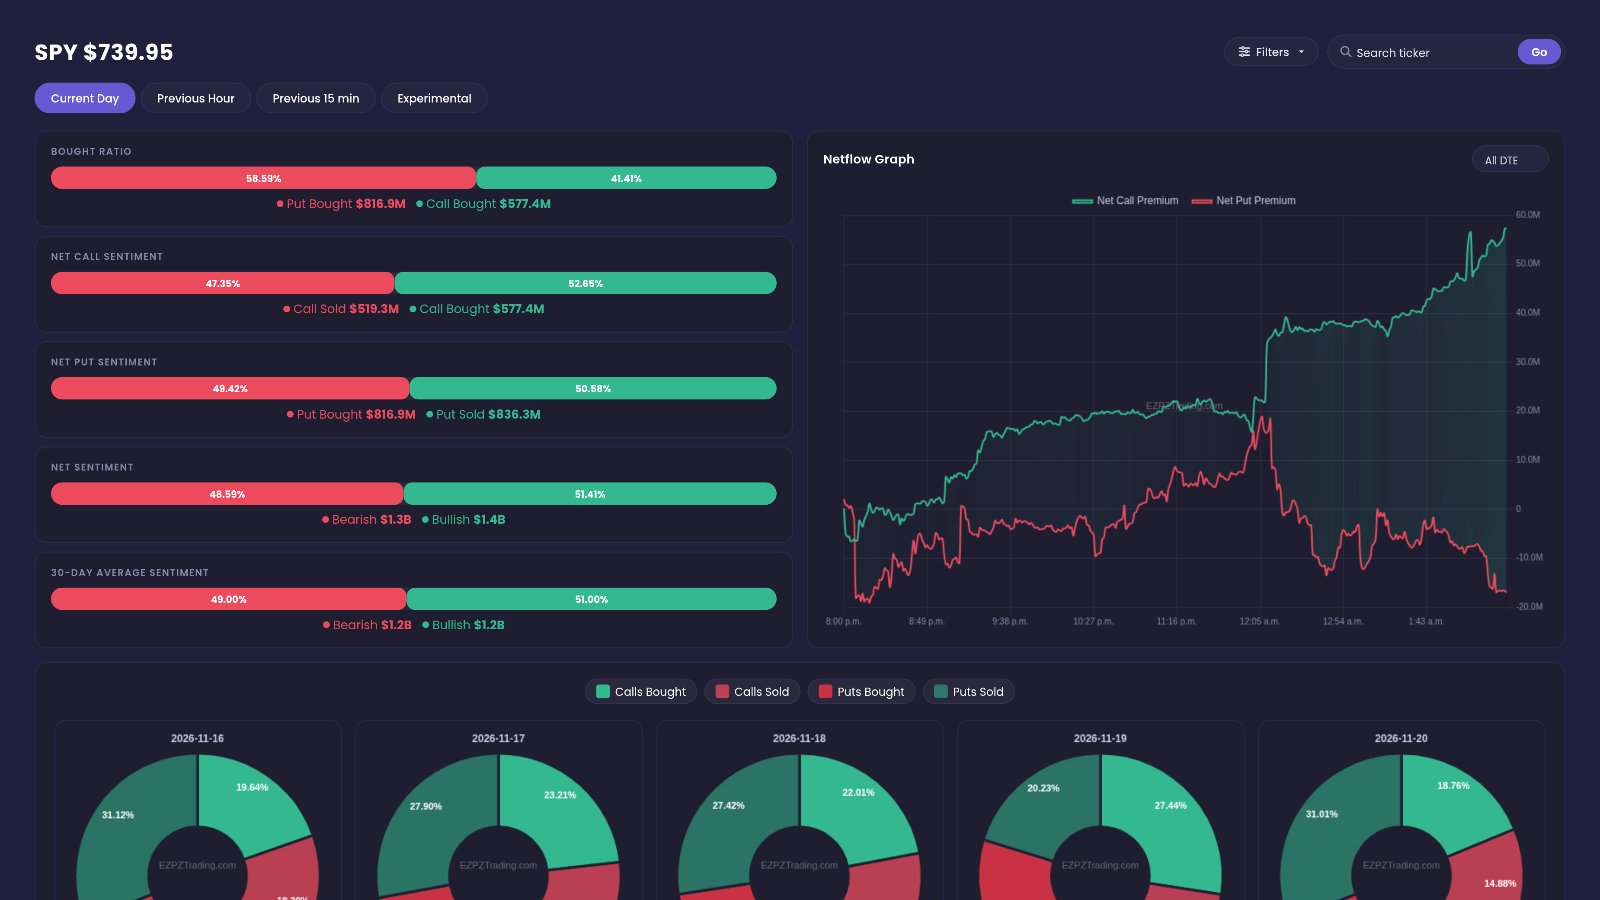
The premium leaned slightly bearish, with most of it in the middle. 3,866 unusual NVDA prints moved $897.7M in premium. The feed tagged $193.7M as bullish and $225.5M as bearish, by where each print traded against the bid and ask. The largest share, $478.5M, traded near the middle and carries no lean. Puts drew more premium than calls, $521.0M to $376.7M, but a put print can be a sale as easily as a buy.
Most of the money went to later expiries. The Nov 18 and Nov 20 expiries drew $44.9M and $61.3M, about 12% of the day's unusual premium together. The rest went to December and beyond, out to January 2029.
The biggest prints were long-dated. The largest was 12,250 of the March 2027 $145 puts at 10:47 am, $13.7M, traded near the middle. At 11:36 am, 4,000 September 2027 $145 puts traded at the ask and 4,000 September 2027 $210 calls traded at the bid in the same second. That is the footprint of a collar, which protects a stock position below $145 in exchange for giving up gains above $210. The tape does not show who did it.
The positioning · Monday Nov 16
Monday's tape and the gamma map
As of the Nov 16 close · NVDA $156.14
01 Unusual premium, all expiries
$897.7M across 3,866 prints
- Tagged bullish
- $193.7M
- Near the middle
- $478.5M
- Tagged bearish
- $225.5M
Calls $376.7MPuts $521.0M
This week (Nov 18 + Nov 20) $106.2M, about 12%Later expiries
02 Net gamma by strike, Nov 20 expiry
| Total unusual premium | $897.7M across 3,866 prints |
|---|---|
| Tagged bullish | $193.7M |
| Near the middle | $478.5M |
| Tagged bearish | $225.5M |
| Calls | $376.7M |
| Puts | $521.0M |
| This week's expiries (Nov 18 + Nov 20) | $106.2M, about 12% |
| Call wall, Nov 20 expiry | $170 |
| Flip (est.), Nov 20 expiry | $161.25 |
| Close, Nov 20 expiry | $156.14 |
| Put wall, Nov 20 expiry | $150 |
This is one session of context, and it shifts as positions open and close. It is not a signal to buy or sell.
The gamma map for Friday's expiry
For the Nov 20 expiry, EZPZ's GEX calculation (an estimate built from Monday's open interest) shows:
- Flip near $161.25. Below it, net gamma is mostly negative. Above it, mostly positive. Monday's $156.14 close sits about 3.3% below the flip.
- The largest negative strikes are $150, $160 and $145, all put-heavy. $150 is also the put wall.
- The largest positive strikes are $175, $177.50 and $180, call-heavy. The call wall is $170.
Negative gamma is where dealer hedging can add to a move. Positive gamma is where it tends to slow one. The $150 put wall and the $161.25 flip both sit inside the implied range. The $170 call wall sits just above its top.
New to these terms? Read How to read gamma exposure: call wall, put wall and the flip.
How NVDA moved after its last four reports
These are close-to-close moves from the report day to the next session. They are past moves, not a forecast.
The record · NVDA
The last 4 reports against tonight's price
4.8% average size
Past moves, not a forecast. Next session close vs report-day close.
| Report | Next session close vs report-day close |
|---|---|
| Aug 26 | +8.7% |
| May 20 | −1.8% |
| Feb 25 | −5.5% |
| Nov 19, 2025 | −3.1% |
| Average size | 4.8% |
| Priced for Nov 18 at the Nov 16 close | ±8.4% |
The average size was 4.8%. Today's priced move, ±8.4%, is close to the largest of the four. Nvidia also beat the average EPS estimate in each of its last eight reports, and the stock still fell after three of the last four. Our free Earnings Surprises page has the quarter-by-quarter table.
Finn draws the range
EZPZ Finn, the free desktop app, can draw the implied range on a TradingView chart. For NVDA the two lines are $143.09 (implied range low) and $169.19 (implied range high, Nov 18). Finn draws the levels. It does not say which way the stock goes.
How to read an implied move
An at-the-money straddle pays off if the stock moves far enough in either direction. What traders pay for it is a rough read on how big a move the market expects, without saying which way. Divide the straddle price by the stock price and you get the implied move as a percentage.
Three things to keep in mind
- It is a price, not a forecast. Stocks regularly move more or less than their options imply.
- It covers the whole expiry. The Nov 18 straddle includes Tuesday's session and Wednesday's, as well as the report itself.
- It gets stale fast. Implied moves shift as price and volatility change, and IV usually drops sharply once the report is out. These numbers describe the Nov 16 close.
Ask AiPe about the report
On Pro and up, open Expected Move for NVDA and click Ask AiPe in the bottom right. Ask what range the Nov 18 expiry is pricing, or how it compares with Friday's. AiPe explains the data on your screen. It doesn't tell you what to trade, and it can be wrong.
FAQ
When does Nvidia report earnings?
After the market closes on Tuesday, Nov 17, 2026, at about 4:20 pm ET, with the conference call at 5:00 pm ET. That date is from Nvidia's own announcement.
What is NVDA's implied move for earnings?
About ±8.4%, or ±$13.05 on a $156.14 close, using the Nov 18 at-the-money straddle at the Nov 16 close. That puts the range at $143.09 to $169.19.
Does the implied move tell me which way NVDA will go?
No. A straddle is priced for movement in either direction, so its price says nothing about direction.
Which way was NVDA options flow leaning before earnings?
On Monday, Nov 16, it was split with a slight bearish tilt. Of $897.7M in unusual NVDA premium, $193.7M was tagged bullish and $225.5M bearish, with $478.5M near the middle. Most of it went to expiries after this week. That is context from one session, not a buy or sell signal.
Why is the Nov 18 IV so high?
It is the first expiry after the report, and it has only one trading day left, so nearly all of its premium is the earnings event. Shown as an annual rate, that one event makes the IV look very high. Later expiries spread the same event over more ordinary days.
What is IV crush?
Once a report is out, the uncertainty it carried is gone, so the extra premium built into the options usually comes out of them. Implied volatility drops, often sharply, even if the stock moves.
For a wider look at the AI trade going into this report, read Is the AI trade about to crack? We asked EZRA on Fed day.