
Learn Center
Basic Financials
One ticker's fundamentals on a single page: seven headline cards plus eight tables covering returns, valuation, profitability, growth, financial health, per share data, dividends, and efficiency.
What are basic financials and how do you read them?
Basic financials are the handful of ratios and growth rates most investors check first on a company: valuation, margins, growth, debt, per share figures, dividends, and efficiency. On EZPZ, the Basic Financials page shows seven headline figures and eight small tables for one ticker, so a full fundamental checklist fits on one screen. It opens on AAPL.
Read it by category, not by single number. A stock can look cheap on Valuation Ratios and still be thin on Profitability or heavy on debt, and a fast grower can be expensive. The page shows the reading and leaves the judgment to you. Most of these figures are ratios, so they are only useful next to something: the same company a year ago, a competitor, or its sector. The page does not rate a company as good or bad, and it does not say whether a stock is cheap. Use it to decide which names deserve a longer look, then confirm the detail in the statements and the price pages.
How the Basic Financials page works on EZPZ
Type a ticker into the search box and press Search or Enter. A blank box does nothing. The page loads once when you open it and once for each search, and it does not refresh by itself, so search again for a newer read. The header shows the ticker in white and the latest price in a blue badge. If no price comes back, the badge hides and the tables still load. Until the first load finishes, the header reads "Basic Financials".
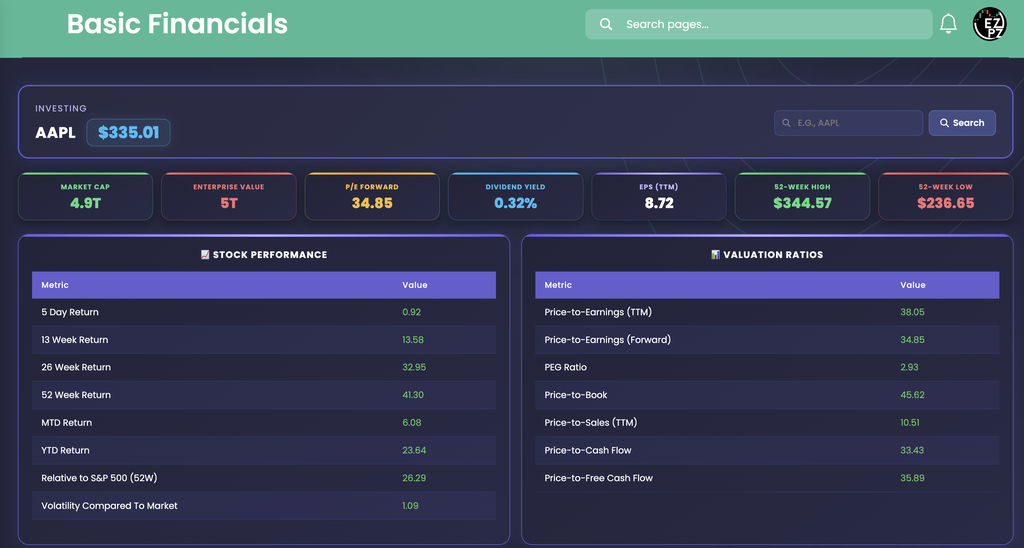
The seven headline cards
The cards sit in one row under the search box. A missing value, or a real zero, prints as a dash, so a company that pays no dividend shows a dash on the Dividend Yield card.
| Card | What it shows |
|---|---|
| Market Cap | The total market value of the company's shares, in short form (K, M, B, T). Shown as 4.9T for AAPL. |
| Enterprise Value | Market Cap adjusted for the company's debt and cash, in short form. It reads 5T for AAPL, a little above Market Cap. |
| P/E Forward | The price to earnings multiple based on expected earnings, to two decimals. |
| Dividend Yield | The yearly dividend as a percent of the price. This is the only card with a percent sign. |
| EPS (TTM) | Earnings per share over the trailing twelve months. |
| 52-Week High 52-Week Low | The highest and lowest prices of the past year, printed with a dollar sign. |
The card colors are fixed styling. Enterprise Value and 52-Week Low are red on every ticker, and Market Cap and 52-Week High are green on every ticker. A red card is not a warning.
The eight tables
Below the cards, eight tables sit in two columns. Each has a Metric column and a Value column, and a row appears only when the data has that metric, so a table can be shorter than the lists below. Values print to two decimals. A negative value is red and everything else is green, so green means the number is not negative and does not mean it is good.
| Table | Rows |
|---|---|
| Stock Performance | 5 Day, 13 Week, 26 Week and 52 Week Return, MTD Return, YTD Return, Relative to S&P 500 (52W), and Volatility Compared To Market. |
| Valuation Ratios | Price-to-Earnings (TTM), Price-to-Earnings (Forward), PEG Ratio, Price-to-Book, Price-to-Sales (TTM), Price-to-Cash Flow, and Price-to-Free Cash Flow. |
| Profitability | Gross Margin, Net Margin, Operating Margin, Return on Equity, Return on Assets, and Return on Investment. |
| Growth | Revenue Growth (YoY), EPS Growth (YoY), EPS Growth (5Y), EBITDA CAGR (5Y), FCF CAGR (5Y), and Revenue CAGR (5Y). This is the only table whose header says the unit: Value (%). |
| Financial Health | Liquidity Ratio, Quick Liquidity, Debt-to-Equity, LT Debt-to-Equity, and Cash per Share. |
| Per Share Data | Earnings per Share, Book Value per Share, Cash Flow per Share, and Revenue per Share. |
| Dividends | Dividend per Share (TTM), Dividend Yield, Payout Ratio, and Dividend Growth (5Y). |
| Efficiency | Asset Turnover (TTM), Inventory Turnover, Receivables Turnover, Revenue per Employee, and Net Income per Employee. The two per employee rows print in short form (2.8M, 776.7K). |
Only the Growth header and the Dividend Yield card say "percent". The other tables print bare numbers, so a ratio like Price-to-Earnings is a multiple while a margin or a return is a percentage. AAPL's Net Margin of 27.62 agrees with its EPS of 8.72 divided by Revenue per Share of 31.73, which is about 27.5 percent, so read margins and returns as percent.
Reading the capture (AAPL)
The header reads AAPL at $335.01. The 52-Week High is $344.57 and the 52-Week Low is $236.65, so the price sits about 91 percent of the way up the year's range and about 2.8 percent below the high. The returns fit that picture: 52 Week Return reads 41.30, YTD Return 23.64, MTD Return 6.08, and 5 Day Return 0.92. Relative to S&P 500 (52W) reads 26.29, and Volatility Compared To Market reads 1.09, a little above a market-sized swing.
In Valuation Ratios, Price-to-Earnings (TTM) reads 38.05 and Price-to-Earnings (Forward) reads 34.85. A forward multiple below the trailing one means the earnings behind it are higher than the last twelve months, since the price is the same. PEG Ratio reads 2.93 and Price-to-Book reads 45.62, which is high. Book Value per Share of 7.36 explains it: $335.01 divided by 7.36 is about 45.5. That small equity base also shows up in Return on Equity, which reads 137.18 against 34.55 for Return on Assets. The ratios agree with each other but not to the last digit. Price-to-Earnings (TTM) of 38.05 is a little under $335.01 divided by 8.72, about 38.4, so do not rebuild a ratio by hand and expect an exact match.

Profitability reads Gross Margin 48.65, Operating Margin 33.17, and Net Margin 27.62, each lower than the one before it, which is the normal order because each margin subtracts more cost. Growth is the most useful place to compare time frames. Revenue Growth (YoY) reads 14.24 against a Revenue CAGR (5Y) of 8.68, and EPS Growth (YoY) reads 32.61 against 17.91 over five years, so the latest year is running well ahead of the longer average. FCF CAGR (5Y) reads 6.13, the slowest of the six.
Financial Health reads Liquidity Ratio 1.00 and Quick Liquidity 0.93, with Debt-to-Equity 0.78, LT Debt-to-Equity 0.66, and Cash per Share 4.27. A liquidity reading near 1 means short term assets roughly match short term obligations. Per Share Data repeats Earnings per Share (8.72, the same as the EPS card) beside Book Value per Share, Cash Flow per Share, and Revenue per Share.

The Dividends table ties out. Dividend per Share (TTM) reads 1.06, and $1.06 divided by the $335.01 price is about 0.32 percent, which matches Dividend Yield. Payout Ratio reads 12.13, and $1.06 against EPS of 8.72 is about 12 percent, so AAPL pays out a small share of what it earns. Dividend Growth (5Y) reads 4.95. In Efficiency, Asset Turnover (TTM) reads 1.25, Inventory Turnover 28.17, and Receivables Turnover 15.84. Revenue per Employee reads 2.8M and Net Income per Employee 776.7K, and 776.7K over 2.8M is about 27.7 percent, in line with the Net Margin above.
How to use the page
- Start with the headline cards. Market Cap tells you the size, and the 52-Week High and Low show where the price sits in its year.
- Read valuation next to growth. A high Price-to-Earnings multiple is easier to accept when EPS Growth (YoY) and PEG Ratio agree, and harder when growth is slowing.
- Check Financial Health before you like a valuation. Debt-to-Equity and the two liquidity rows show how much room the company has if conditions turn.
- Compare like with like. Read one company against its peers or its Sector, not against a random ticker. Sector Metrics gives the sector median for many of the same ratios.
- Compare periods inside Growth. A one year rate far above the five year rate is a change in pace, and it may not last.
- Confirm the symbol. The header ticker and price badge show which company the tables belong to.
How Basic Financials differs from nearby Investing pages
This page answers "what do the standard fundamental ratios say about this company right now?" It is one current snapshot grouped by topic. Financial Statements takes the opposite shape, with one row per year or quarter so you can follow revenue, net income, and debt over time. Historical Market Cap charts the size of the company across a date range, and Company Profile tells you what the business does, where it lists, and which sector it sits in, which is the first thing to know before you read any ratio. Dividends goes deeper on payouts than the four rows here, and Analyst Estimates covers the forecasts that a forward multiple depends on.
For price and opinion, use Ticker Performance for returns, moving averages, and 52 week ranges, Price Target for the levels analysts expect, Recommendation Trends for how analysts rate the stock each month, and Upgrade and Downgrade for each firm's rating change. Earnings Surprises compares reported EPS with estimates, Support and Resistance marks price levels where the stock has stalled, and Social Sentiment shows how the retail crowd talks about it. Company News, Market News, and Congressional Trading cover headlines and disclosed trades.
Outside this category, the Peter Lynch Fundamental Screener ranks stocks on a fixed set of fundamental cutoffs, and Ticker Explorer is the one-symbol dashboard for live quote and options context.
What to check before you rely on it
- The units. Only the Growth header and the Dividend Yield card show a percent unit. The rest print bare numbers, and the page does not state a currency for the per employee rows.
- The age of the data. The page loads once and the ratios are not live. The price badge is a separate read, so a ratio built on price, such as Price-to-Earnings, can sit a little off the badge on a fast day.
- The colors. Green only means not negative. It does not say a value is healthy, and the card colors are fixed.
- The dashes and gaps. A card shows a dash when the data has no value, and a table row is left out when the data lacks it. A dash is not a zero.
- The odd values. Some companies report extreme ratios, such as a Return on Equity in the hundreds when equity is small. Read the row next to it before you take it at face value.
- The ticker. Search the exact symbol. An unknown ticker leaves dashes on the cards and empty tables.
Who uses basic financials
Fundamental screeners
Run a quick checklist across valuation, margins, growth, and debt before deciding which names deserve a deeper look.
Value investors
Lean on Valuation Ratios and Financial Health to judge whether a price is backed by earnings and a sound balance sheet.
Growth investors
Compare the one year and five year rows in Growth to see whether the pace is speeding up or slowing down.
Income investors
Check Dividend Yield, Payout Ratio, and Dividend Growth (5Y) to see how much of earnings is paid out and how the payout has grown.