
Learn Center
Extended Hours Leaders
Two tabs of stocks moving before the open and after the close, with the percent move, the gap, and how much actually traded.
How do you read pre-market and after-hours movers?
Pre-market and after-hours movers are stocks that moved a lot outside the regular 9:30 to 4:00 session. Pre-market runs before the open and post-market runs after the close. Fewer people trade in those hours, so a price can jump on news like earnings while very little stock changes hands.
The move is only half the story. Read the volume next to it. A stock up 50% on a few hundred shares is a thin print that can vanish at the open, while the same move on millions of shares has more behind it. Then separate two numbers that sound alike: the change inside the session, and the gap versus the regular-session close. They use different starting points and can even have opposite signs. Extended hours prices can also be far from where the stock trades at 9:30, so a big pre-market move does not promise a big open. None of it says what happens next. On EZPZ, Extended Hours Leaders has two tabs, Pre-Market and Post-Market, with the same columns for each session. Start with Market Dashboard if you want the whole tape first.
How Extended Hours Leaders works on EZPZ
Two tabs sit above the table. Pre-Market shows the session before the open and Post-Market shows the session after the close. The active tab is highlighted, and the table is paginated with a scroll area, so you move through pages to see more rows.
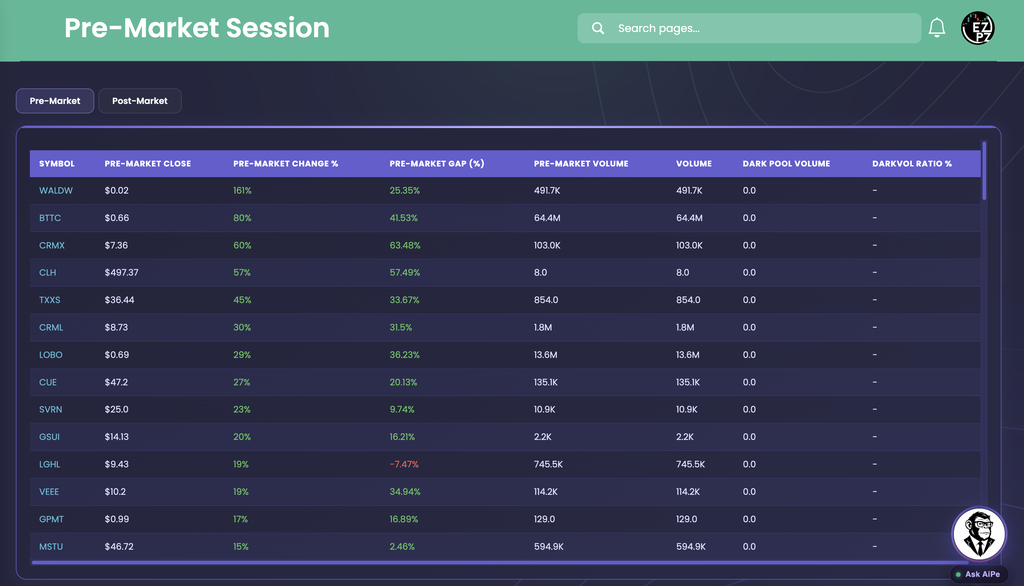
The screenshot shows why the columns matter together. BTTC prints a 41.53% Pre-Market Gap (%) and an 80% Pre-Market Change % on 64.4M Pre-Market Volume, a heavily traded move. CLH prints a 57% Pre-Market Change % on 8.0 shares of Pre-Market Volume, a very thin one. LGHL prints a 19% Pre-Market Change % but a -7.47% Pre-Market Gap (%) in red, because the two are measured from different starting points.
The Post-Market tab
Post-Market uses the same columns for the after-hours session. Earnings and news that land after the bell often show up here first.

GIPR prints a 66.76% Post-Market Change % on 297.1M Post-Market Volume. TJGC prints 61.58% on 2.5M Post-Market Volume with a -2.46% Post-Market Gap (%). A dash in the gap column means that row has no gap value.
How Extended Hours Leaders differs from the rest of stocks-data
This page covers only the hours outside the regular session. Gap Up and Down ranks the opening gap at the 9:30 open. Top Gainers and Losers ranks the total percent move from the prior close. Volume Leaderboard ranks by how much traded against normal. Market Dashboard is the one-screen overview of indices, breadth, and Market Direction lights. Range Change Leaders ranks the move from today's open to now. Use this page when the question is what is moving before the open or after the close. For one name after you have picked it, Ticker Explorer is the one-symbol dashboard.
Reading the columns
The columns are the same on both tabs, with Pre-Market or Post-Market in the names. Read a row left to right: the price, the move, then how much traded.
| Column | What you are looking at |
|---|---|
| Symbol | The ticker. |
| Pre-Market Close Post-Market Close | The last price of that session. The header can read Price instead of Close while the session is still live. |
| Pre-Market Change % Post-Market Change % | How far the price moved inside that session. |
| Pre-Market Gap (%) Post-Market Gap (%) | How far the price is from the regular-session close. Green is above it and red is below it. |
| Column | What you are looking at |
|---|---|
| Pre-Market Volume Post-Market Volume | Shares traded in that session only. |
| Volume | Total shares traded, which can include the regular session depending on the time of day. |
| Column | What you are looking at |
|---|---|
| Dark Pool Volume | Shares that traded on dark, off-exchange venues. |
| DarkVol Ratio % | Dark Pool Volume as a percent of total Volume. A dash means there is no ratio to show. |
How people actually use it
Before the open
Check Pre-Market for names moving on news. It is an early read on which stocks may be active at 9:30.
After the close
Check Post-Market for earnings and headline reactions that hit after the bell, before the next session starts.
Weigh the volume
Put the session Volume beside the percent move. A move on millions of shares is more credible than the same move on a handful.
Pick a name to research
Treat the list as a starting point. Open the chart and the news for the reason behind the move, or check Volume Leaderboard once the regular session opens.