
Learn Center
Historical Weighted Alpha
One ticker's Weighted Alpha score charted day by day next to price, with a daily table of trailing returns from one week to one year.
What is Historical Weighted Alpha and how do you read it?
Historical Weighted Alpha is the Weighted Alpha momentum score for one ticker, plotted day by day next to the stock's price. It answers a question a single reading cannot: has this trend been building, fading or holding steady? EZPZ shows it as a dual-axis chart with a daily history table under it, so you can compare the score with price and with six trailing return windows.
The Weighted Alpha leaderboard gives you today's number for many stocks. This page gives you the path behind one of them. Two stocks can show the same score today while one climbed into it and the other slid down to it, and those are different situations. Read the purple line for the score and the blue line for price, and ask whether they move together or separate. A score that rises while price rises is momentum confirming the move. A score that falls while price holds up can mean the trend is cooling under the surface. A score is also easiest to judge against the same ticker's own history, because readings run higher for volatile small caps than for a broad ETF like SPY. The exact formula is proprietary, so this guide covers how to read the page, not how the score is built. Treat it as context for a stock you are already researching, not as a signal.
How the Historical Weighted Alpha page works on EZPZ
The page has three parts. A title bar shows the ticker and its current price on the left, with a ticker search box and a Go button on the right. Below it sits the line chart, with the Weighted Alpha line on the left axis and the Price line on the right axis. Under the chart is a daily history table with one row per trading date. It opens on SPY, and each search reloads the header, chart and table together. A spinner shows while it loads.
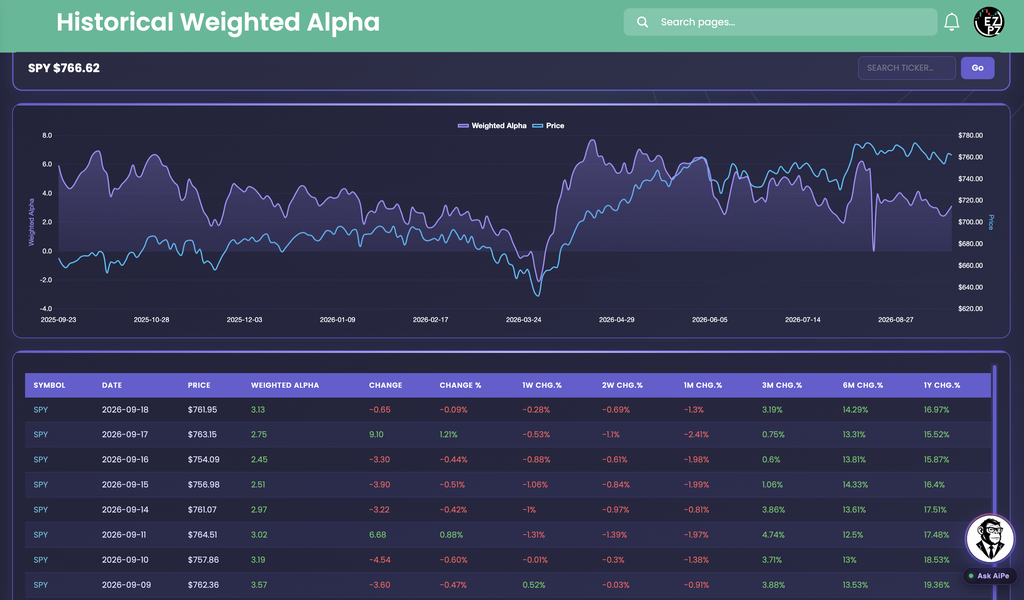
Start with the chart. The purple Weighted Alpha line stays above zero for most of the year and mostly sits between about 2 and 6. Near the 2026-03-24 label it slips below zero, and the blue Price line bottoms out at the same time. After that low, the score climbs back to a peak of roughly 7 to 8 while price recovers. The two lines do not move in lockstep everywhere, which is the point of putting them on one chart. On the right side there is a narrow one-day drop in the score to about zero, followed by a return to the low 3s while price barely moves. Hover over that spot to read the exact date and value, then check the table before you draw a conclusion from one isolated point.
Now the table. The newest row is 2026-09-18, with Price $761.95 and a Weighted Alpha of 3.13, while the header shows a later current price of $766.62. Look at the eight rows from 2026-09-09 to 2026-09-18. Price stayed in a tight band from $754.09 to $764.51, while the score moved from a high of 3.57 on 2026-09-09 down to a low of 2.45 on 2026-09-16 and back to 3.13. The score's low and the period's lowest price landed on the same day, 2026-09-16, but the score's high came on a day when price was $762.36, not at the period high. The trailing columns on 2026-09-18 read 1W -0.28%, 2W -0.69%, 1M -1.3%, 3M 3.19%, 6M 14.29% and 1Y 16.97%. That is a stock that is slightly negative over the last month and clearly positive over three months to a year.
How Historical Weighted Alpha differs from the rest of stocks-strategies
Historical Weighted Alpha is a time series for one symbol. Weighted Alpha is the leaderboard of the highest current readings across many stocks, and it is the natural place to find a name before you open its history here. Stocks Outperforming keeps four separate performance windows beside a pinned SPY row. Relative Strength (RS) Ranking turns performance into a percentile rank. Trend Trading Strategy is a members reading page on risk to reward and ATR stops, with no ticker data. Retail Trend Navigator and Market Trend Signals read trend from moving averages. Volatility Deviations looks for moves that stretched past a stock's normal range. WarriorTrading Setup is a low float day trading setup, and Peter Lynch Fundamental Screener is a valuation screen.
Nearby pages in other categories answer related questions. Top Gainers and Losers ranks one day of percent change, and Volume Leaderboard ranks trading activity. Technical Analysis reads one ticker's indicators. For a one-symbol dashboard beyond momentum, Ticker Explorer is the next stop.
Reading the chart and the table
Read the chart first for the shape of the trend, then use the table for exact dates and the trailing returns.
| Element | What you are looking at |
|---|---|
| Weighted Alpha | The purple line and filled area, plotted against the left axis. This axis is titled Weighted Alpha and its range adjusts to the ticker. |
| Price | The blue line, plotted against the right axis in dollars. The two lines share one date axis, so you can compare them at any point. |
| Date axis | About ten evenly spaced date labels along the bottom, oldest on the left and newest on the right. In this capture it starts at 2025-09-23. |
| Hover tooltip | Hover anywhere on the chart to see the date with both the Weighted Alpha and Price values for that day. |
| Column | What you are looking at |
|---|---|
| Symbol | The ticker for the page, repeated on every row. |
| Date | The trading date for that row. The table opens sorted by Date with the newest first. |
| Price | The closing price on that date, shown with two decimals. |
| Weighted Alpha | The momentum score on that date. Green leans bullish and red leans bearish. |
| Change | The dollar price change on that date, green when up and red when down. It prints as a bare number with no dollar sign. |
| Change % | The percentage price change on that date, colored the same way. |
| Column | What you are looking at |
|---|---|
| 1W Chg.% 2W Chg.% | The stock's percentage change over the trailing one and two weeks, measured as of that row's date. |
| 1M Chg.% 3M Chg.% | The trailing one and three month changes as of that row's date. |
| 6M Chg.% 1Y Chg.% | The trailing six and twelve month changes as of that row's date. |
Working the page
- Search a ticker: type a symbol in the box, then press Enter or click Go. The box turns your entry into uppercase. With no entry, the page falls back to SPY.
- Header price: the title bar shows the ticker and its current price. That price can be newer than the latest row in the table, as in the capture, where the header reads $766.62 and the newest row is 2026-09-18 at $761.95.
- Sorting and paging: the table shows 25 rows per page and opens sorted by Date, newest first. Click a column header to re-sort, and use the paging controls under the table to go further back.
- Colors: Weighted Alpha, Change, Change % and every trailing return are green above zero and red below. Price and Date are white.
- No history: if a ticker has no stored readings, the chart and the table come back empty.
- Ask AiPe: AiPe reads the recent daily rows for the ticker on screen and can summarize the trend or switch the page to another symbol when you name one.
How people actually use it
Judge a leaderboard name
Open a ticker from the Weighted Alpha leaderboard and check whether its score has been building for weeks or only just jumped. A long steady climb reads differently from one sharp spike.
Compare score and price
Look for stretches where the purple line and the blue line move together, and for stretches where they separate. Separation is the cue to look closer, not a call on its own.
Find the turn
Watch for the score crossing zero on the left axis, like the dip near 2026-03-24 in the capture. Use the table to see the exact dates around it.
Check timeframe alignment
Compare today's score with the 1W to 1Y columns. When all windows agree the trend is broad, and when short windows disagree with long ones the stock may be pausing or turning.