
Learn Center
Upgrade and Downgrade
A running log of when research firms change or restate their rating on one stock, with the date, the action, and the From and To ratings.
What are analyst upgrades and downgrades, and how do you read them on EZPZ?
An analyst upgrade or downgrade is a research firm moving its rating on a stock up or down its own scale, such as Hold to Buy or Buy to Hold. The EZPZ Upgrade and Downgrade page lists these events for one ticker, one row per firm action, with the date, the firm, the action, and the From and To ratings.
The rows are a log, not a score. Read each one as "this firm did this on this date," then look at the pattern across firms. A row is only a rating change when the Action reads Upgrade or Downgrade. Reiterated and Maintained rows are firms restating a rating they already had, and they are the bulk of many tickers' history. Each firm uses its own words, so From and To can read Buy, Outperform, Overweight, Neutral, Hold, or Underperform on the same stock. Compare the direction of the move, not the exact label. Two or three downgrades from different firms in a short window say more than one downgrade sitting among many reiterations. This page shows what firms published. It does not say how the stock reacted, and it is not a signal.
How the Upgrade and Downgrade page works on EZPZ
The page opens on AAPL. The header card shows the word Investing, the ticker, and its current price in a blue badge. On the right sit a ticker box with the hint E.G., AAPL, a Search button, and an Actions dropdown. Type a symbol and click Search or press Enter, and the table reloads for that ticker. A spinner shows while the request runs. The page loads once and after each search. It does not refresh on its own.
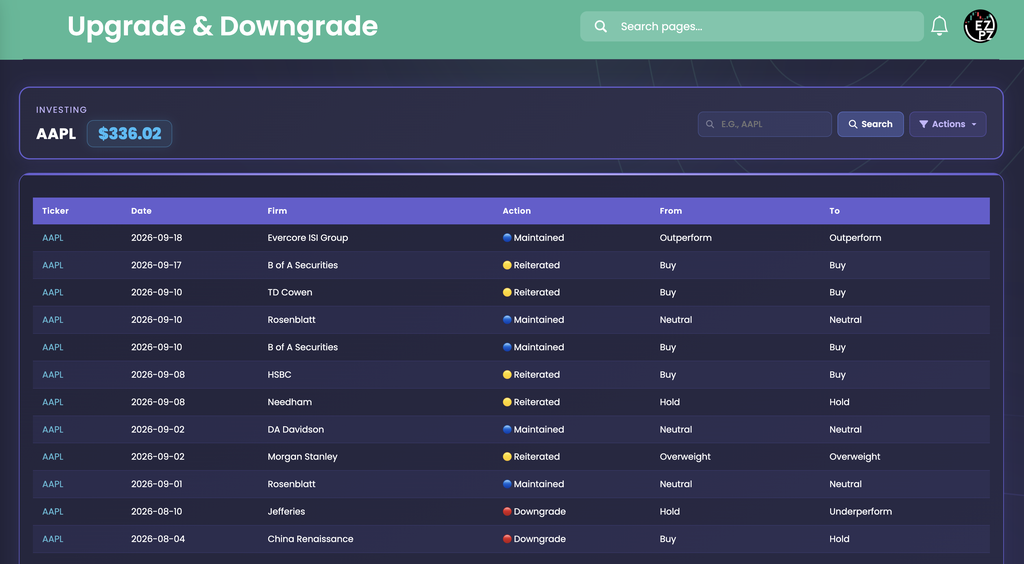
In this capture the table shows twelve rows dated 2026-08-04 to 2026-09-18. Only two of them are rating changes, and both are downgrades. Jefferies cut from Hold to Underperform on 2026-08-10, and China Renaissance cut from Buy to Hold on 2026-08-04. The other ten rows are all newer and carry no rating change. Five read Reiterated (B of A Securities, TD Cowen, HSBC, Needham, Morgan Stanley) and five read Maintained (Evercore ISI Group, Rosenblatt twice, B of A Securities, DA Davidson). The same firm can appear under both labels. B of A Securities is Reiterated at Buy to Buy on 2026-09-17 and Maintained at Buy to Buy on 2026-09-10. The page does not explain the difference between those two labels, so treat both as "no change in rating." The scales also differ by firm. Evercore ISI Group is at Outperform, Morgan Stanley at Overweight, Rosenblatt at Neutral, and Needham at Hold.
How Upgrade and Downgrade differs from the rest of investing
This page is the event log behind analyst sentiment. Recommendation Trends counts how many analysts sit in each rating bucket and how that count shifts, which is the summary this log feeds. Price Target shows where analysts expect the stock to trade, and Analyst Estimates shows what they forecast for earnings and revenue. Earnings Surprises shows how reported results compared with those forecasts, and Ticker Performance shows what the price itself has done. For the story behind a rating change, check Company News and Market News, and for how retail traders feel, Social Sentiment.
Two more pages sit nearby. Basic Financials and Financial Statements cover the business the analysts are rating, and Support and Resistance marks price levels where the stock has stalled before. Company Profile, Sector Metrics, Historical Market Cap, Dividends and Congressional Trading round out the category. Outside investing, Technical Analysis rates one symbol from its price indicators, and Ticker Explorer is the full one-ticker dashboard.
The four Action labels
The Actions dropdown in the header lists four labels. All four start checked, so the table opens showing every kind of row. Each label has a colored dot that also appears in the Action column.
| Action | What you are looking at |
|---|---|
| 🟢 Upgrade | The firm moved its rating up. From is the lower rating and To is the higher one. |
| 🔴 Downgrade | The firm moved its rating down. From is the higher rating and To is the lower one. |
| 🟡 Reiterated | The firm restated its rating. From and To match in the rows above, such as Buy to Buy. |
| 🔵 Maintained | The firm kept its rating. From and To also match, such as Outperform to Outperform. |
Reading the table
The table has six columns. It shows twelve rows per page with paging under it, and it opens sorted by Date with the newest first. Click a column header to sort by that column. There is no text search box and no page-length control.
| Column | What you are looking at |
|---|---|
| Ticker | The symbol you searched, in blue. It is the same on every row. |
| Date | The day of the action, printed as year, month, day. Dates use your browser's time zone. |
| Firm | The research firm that published the rating, as it names itself, for example Evercore ISI Group or B of A Securities. |
| Action | Upgrade, Downgrade, Reiterated or Maintained, each with its colored dot. |
| From | The firm's previous rating. A dash means the feed had no value. |
| To | The firm's new rating, on that firm's own scale. |
Working the page
- Search a ticker: type a symbol, then press Enter or click Search. The box uppercases what you type. It does nothing when the box is empty.
- Header price: the blue badge is the current price. Before the first result loads, the heading reads Upgrades & Downgrades in place of a ticker.
- Filter by action: use the Actions dropdown to hide any of the four labels. Unchecking all four empties the table.
- Empty table: a ticker with no recorded actions, or a symbol the feed does not know, shows an empty table.
- No refresh: the page loads once and after each search. Search again to pull the latest.
How people actually use it
Catch a fresh rating change
Filter to Upgrade and Downgrade and check the newest Date. A change from a recent day is a reason to look at the news and price for that ticker.
Look for firms moving together
Several downgrades from different firms in a few weeks say more than one lone call. The Downgrade rows for Jefferies and China Renaissance in the capture are six days apart.
Follow one firm's history
Sort by Firm to group a firm's rows together and read its From and To ratings in date order. A firm that keeps reiterating Buy is telling you something different from one that just cut to Hold.
Check what the summary hides
When Recommendation Trends shows a bucket shifting, this page shows which firms moved and on which dates.