
Learn Center
Short Volume Trends
A chart of how a stock's daily short volume percentage has moved over time, making shifts in short selling activity easier to spot.
What is daily short volume percentage over time?
Daily short volume percentage over time is Short Volume versus Total Volume for each session, drawn as Short % on one ticker. On EZPZ it is Short Volume Trends. Filter ticker and Go sit on the first row. The first chart is GME Short Volume Percentage. It is a daily tape share series, not official short interest.
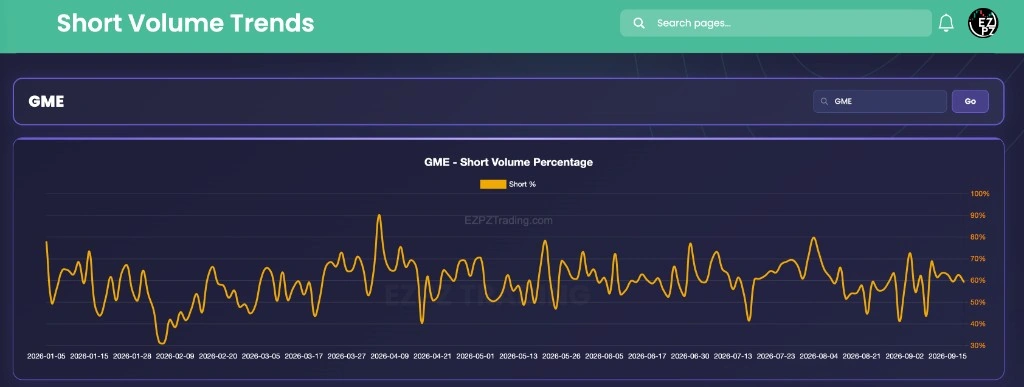
Short % is Short Volume as a share of Total Volume for that date. The screenshot starts on GME. The x-axis runs from 2026-01-05 through 2026-09-16. The right axis is percent, from about 30% to 100%. The orange line is labeled Short %. It spends most of the year between about 50% and 80%. A late January print sits near 35%. An early April print sits near 90%. The last visible print is near 60%. A high Short % day still includes market making and hedges, not only a directional bet. None of those points is a fill. There is no date picker on this page. The series is every date the feed returned for that ticker. Filter ticker is uppercase. Enter reloads the same way Go does. The URL keeps symbol, so a link from Short Volume can land on the same name.
On EZPZ, the live page title is Short Volume Trends. The header prints the loaded ticker, such as GME. Filter ticker and Go sit on the right. The first chart title is GME - Short Volume Percentage. Short % Change sits next. Volume Comparison sits last, with Short Volume next to Total Volume. Short Volume is the many-name table for one Date. Click a Ticker there to open this chart. Short Interest is the one-ticker official snapshot after you already picked a name. Short Interest Leaderboard ranks many names from Official Short Interest %. ShortEx is the squeeze focused rank that blends short interest with days to cover and short volume. Exchange Volume Leaderboard ranks off-exchange share of volume, not short sales. Exchange Volume is the venue mix for one ticker. Gamma Short Squeeze is Squeeze Score(%) next to Gamma Pressure and Short Interest(%). Ticker Explorer is the one-symbol dashboard after you already picked a name.
How Short Volume Trends works on EZPZ
Type a ticker in Filter ticker, then Go. The page starts on GME if the URL has no symbol. Read GME - Short Volume Percentage first, then Short % Change, then Volume Comparison. It is not a score you trade. A one-day spike on Short % Change is a prompt to look at Short Volume against Total Volume on that date. Do not treat GME as a default thesis.
How this differs from Short Volume
Short Volume ranks many names for one Date. High Short Sale Volume starts on. This page is one ticker across many dates. Use Short Volume when you want Percent across the tape. Use this page when you want Short % over time after you already picked a name. Short Interest is Official Short Interest (% Float) and Historical Data. This chart does not print that official percent. Use Short Interest when you want the settlement snapshot. Use this page when you want daily Short %. Short Interest Leaderboard ranks Official Short Interest %. Its sliders start at Official Short Interest Above 8%, Market Cap Above 5M, and Average Volume Above 1M. This page has none of those sliders. ShortEx is a squeeze screen that combines short interest with days to cover and short volume. This page does not print Short Score. Use ShortEx when you want that combined rank. Use this page when you want Short %, Percent Change, Short Volume, and Total Volume on one ticker. Exchange Volume Leaderboard ranks off-exchange share of volume. Exchange Volume is venue mix for one ticker. Gamma Short Squeeze is Squeeze Score(%) next to Gamma Pressure. Use that page when you want options gamma on the same row as Short Interest(%). Use Ticker Explorer after you already picked a symbol.
Filter ticker and Go
Filter ticker and Go sit on the header next to the loaded symbol. There is no Apply button and no date dropdown. Enter reloads the same way Go does.
| Control | What it does |
|---|---|
| Filter ticker | Jump to one ticker. The field is uppercase. The placeholder is Filter ticker. The page starts on GME. |
| Go | Loads that ticker. Enter in Filter ticker does the same. The URL keeps symbol, such as GME. |
Anatomy of the charts
Read top to bottom: Short Volume Percentage, then Short % Change, then Volume Comparison. You do not need every chart on every load. Use the tabs if you want a map of the fields.
The first chart title is the ticker plus Short Volume Percentage, such as GME - Short Volume Percentage.
| Line | What you are looking at |
|---|---|
| Short % | Orange. Short Volume as a share of Total Volume for that date. On the GME load the right axis runs from about 30% to 100%. |
The second chart title is Short % Change. The legend is Percent Change.
| Line | What you are looking at |
|---|---|
| Percent Change | Blue. How Short % moved versus the prior date. On the GME load the right axis runs from about -30% to 30%, and the line oscillates around 0%. |
The third chart title is Volume Comparison. It answers size, not percent.
| Bar | What you are looking at |
|---|---|
| Short Volume | Orange bars. Share size tagged as a short sale on that date. |
| Total Volume | Blue bars. That day's broader volume on the name. On the GME load the right axis runs to about 25M, with taller prints near late January, early May, and early August. |

How people actually use it
Load one name
Type the ticker in Filter ticker, then Go. Stay on GME until you have a different name. The header reprints that symbol.
Read Short % before Change
Use GME - Short Volume Percentage for the level. Open Short % Change when you want a one-day jump, not the year-long range alone.
Check size on Volume Comparison
A loud Percent Change on a quiet Total Volume day is a smaller tape. A tall Total Volume bar next to Short Volume is the size check.
Pair it with the table and the official snapshot
Use Short Volume when you want many names for one Date. Use Short Interest or Short Interest Leaderboard when you want Official Short Interest %. Use ShortEx or Gamma Short Squeeze when you want a squeeze rank instead of this daily Short %.