
Learn Center
Support and Resistance
Price levels where a stock has historically had trouble breaking through, used by traders to anticipate where buying or selling pressure might show up next.
What are support and resistance levels for a stock?
Support and resistance levels are prices where a stock has stalled or turned before. A level below the current price is treated as support, a possible floor. A level above it is treated as resistance, a possible ceiling. On EZPZ you type a ticker and get a one-minute price line for the session, plus a table of levels marked green below the price and red above it.
Traders watch these prices because many orders, alerts, and stops cluster around the same round or repeated numbers, so price often pauses there. That is a habit of the crowd, not a rule of the market. A level can hold once, get sliced through on the next test, or flip roles after a clean break, with old resistance acting as new support. There is no single official way to calculate the levels, and the EZPZ page does not say how its list is built, so treat each number as a reference price and read it as a zone, not an exact line. Distance matters as much as the level itself: a level 2 percent away is a near-term marker, and one 15 percent away is background context.
How the Support Resistance page works on EZPZ
The page opens on SPY. The header card shows the word Investing, the ticker, and a blue price badge such as SPY $761.64. On the right, type a symbol into the box and press Enter or click Search. The box uppercases what you type. The page loads on open and again on every search. When the market was open as the page loaded, it also reloads once a minute for whichever ticker is in the box.
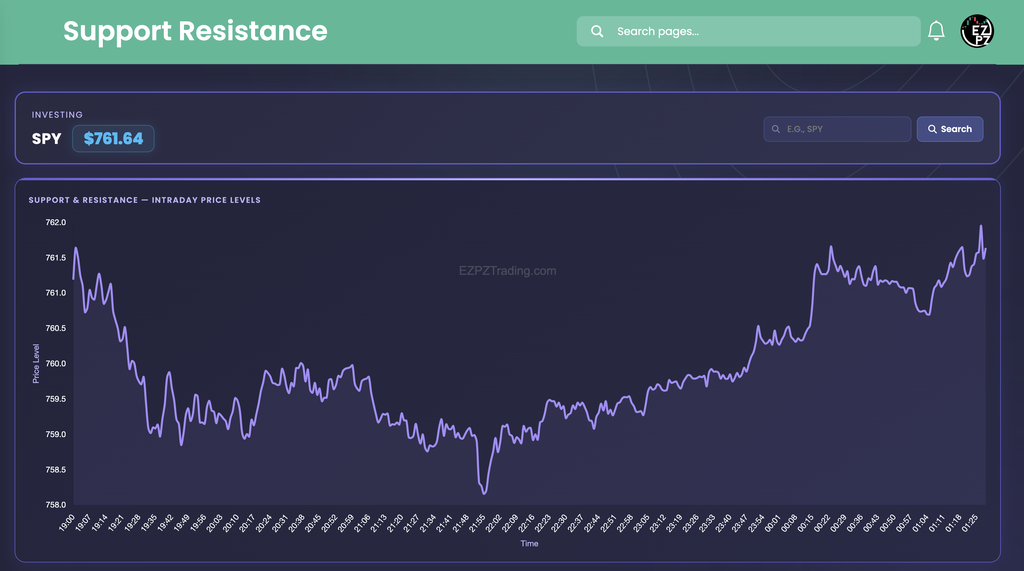
Below the header the page stacks two blocks: the chart card and the level table.
The Support and Resistance intraday chart
The chart card is labeled Support & Resistance, Intraday Price Levels. It has one purple line, the one-minute price for the session, with the axes titled Time and Price Level. There is no legend. Hover anywhere on the chart to see the price at that minute. Time labels follow your browser's time zone, so a US session can read as an evening or overnight span. In the capture the labels run from 19:00 to 01:25.
Levels are drawn as dashed horizontal lines with the price printed at the left end. A line is green when the level sits below the last price and red when it sits above it. Only levels close to the session are drawn, roughly within 10 dollars of the session's low or high. That is why the SPY capture shows no dashed lines at all: the session ranged from about 758 to 762, and the nearest level in the table, 740.80, is more than 10 dollars under the low. Absence of lines on the chart does not mean there are no levels. The table lists every level the page received.
The level table

| Column | What you are looking at |
|---|---|
| Ticker | The symbol you searched, repeated on every row. Its text is green when the level is below the current price and red when it is above. |
| Level | The level price to two decimals in a purple pill, followed by an arrow. The table opens sorted by Level, highest first, and you can click the header to flip the order. |
The arrow is the part readers misread. A green up arrow means the current price is above that level, so the level sits below you and is a support candidate. A red down arrow means the price is below that level, so it sits above you and is a resistance candidate. The arrow describes where you stand against the level, not where price is expected to go. The table has no paging or search box, and it does not show a strength, a touch count, or the date a level formed.
Reading the SPY example
SPY read $761.64 in the capture. The table held five levels. One sat above the price: 779.37, a red down arrow, 17.73 higher or about 2.3 percent away. Four sat below it: 740.80 (20.84 lower, about 2.7 percent), 702.28 (59.36 lower, about 7.8 percent), 662.39 (99.25 lower, about 13.0 percent), and 629.28 (132.36 lower, about 17.4 percent).
Three things come out of that. First, the nearest level on each side is only about 2 to 3 percent away, so those two rows are the ones that matter for a near-term trade. The three deeper levels are context for a large drop. Second, with one level above and four below, the table shows how much room the price has before it meets a marked level in each direction, not which way it will move. Third, turning each gap into a percent of the price is the quickest way to compare a level on SPY with a level on a much cheaper stock.
How Support and Resistance differs from nearby Investing pages
This page answers "where has price stalled before, and how far away is that from now?" Ticker Performance shows what the price actually did, with returns, moving averages, and 52 week ranges, which are recorded highs and lows rather than marked levels. Price Target shows the price levels analysts expect, which come from opinion and not from chart behavior. Recommendation Trends counts analyst ratings and Upgrade and Downgrade logs each rating change. Social Sentiment measures the retail conversation, and Congressional Trading lists the stock trades that lawmakers have disclosed. For the reasons a level might fail, Company News, Market News, and Earnings Surprises cover the events that can push price straight through it. Sector Metrics compares financial ratios with a sector Median, a fundamentals view rather than a chart level. Company Profile tells you what the business is and how large it is before you read its levels. Financial Statements shows the reported revenue, profit, debt and cash, a fundamentals view rather than a chart level. For the standard fundamental ratios behind the company, Basic Financials groups valuation, profitability, growth, debt, and dividends for one ticker. Historical Market Cap charts a company's total value over a date range, a size view rather than a chart level. Dividends lists a company's cash payments, an income view rather than a chart level. Analyst Estimates shows analyst forecasts for revenue, EPS, EBITDA and EBIT, an expectations view rather than a chart level.
Outside this category, Trader's FieldMap is a support and resistance ladder you build from pasted TradingView levels, and GEX Heatmap shows Call Resistance and Put Support from options positioning. Ticker Explorer is the one-symbol dashboard when you want a live quote and options context next to the levels.
What to check before you rely on a level
- Distance first. Convert each level into a percent of the price. A level 2 percent away and one 15 percent away are different tools.
- The arrow's direction. Up means the price is above the level, down means it is below. It is not a forecast.
- Table against chart. The chart draws only levels near the session. If it shows no dashed lines, the table still lists the levels.
- The ticker header. After a search, confirm the card shows the symbol you meant. If nothing changes, check the spelling.
- Volume and news. A level tested on heavy volume, or one that price is approaching just after a headline, behaves differently from a quiet drift into it.
Who uses support and resistance levels
Traders planning entries
Note the nearest green level below the price for a possible pullback entry and where a stop would sit under it.
Traders planning exits
Use the nearest red level above the price as a place to consider taking profit instead of chasing.
Breakout watchers
Watch for the price crossing a level and note when the arrow color for that row flips on the next reload.
Investors sizing risk
Compare how far the nearest levels sit from the price to judge how much room a position has in either direction.