
Learn Center
Option Chain
The full list of available call and put contracts for a ticker across every strike and expiration, the basic building block behind every other options tool.
What is an option chain?
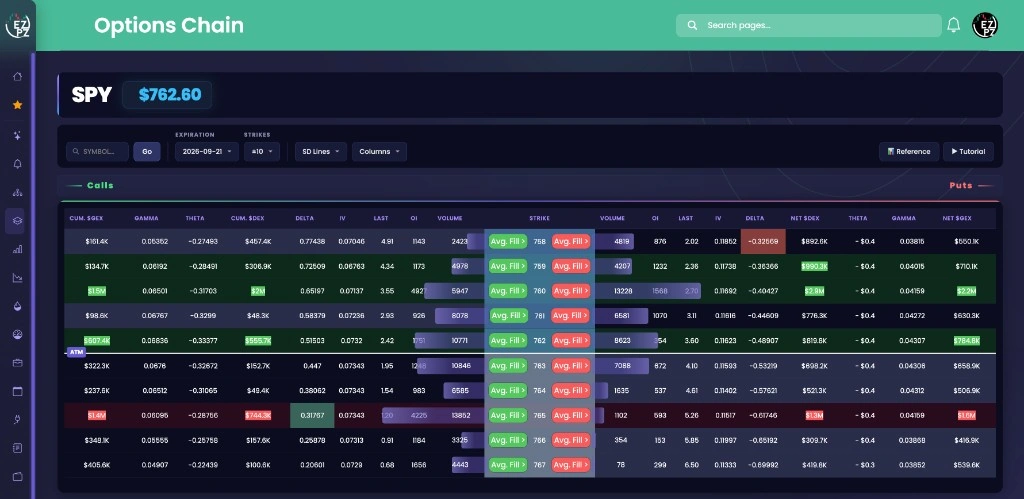
An option chain is the listed call and put contracts for one underlying, grouped by expiration and then by strike. Each row is one strike. Calls sit on the left. Puts sit on the right. The strike sits in the middle. Traders use it to see last, volume, open interest, implied volatility, and the greeks on one screen.
The ATM strike is the one closest to the last price on the ticker badge. Volume and open interest usually cluster there, and the quoted spread is often tighter than on far strikes. You pick one expiration at a time from Expiration. Then Strikes ±10, ±20, ±50, or All to control how many rows you see around that ATM strike.
Calls sit on the left of STRIKE. Puts sit on the right. Last, volume, and open interest tell you whether anyone is trading that contract. Delta tells you how much the option tends to move if the underlying moves. IV is implied volatility on that strike. $GEX and $DEX are exposure labels on the row.
A chain is a map of listed contracts. It is not a score, and it is not a buy or sell signal. Open interest updates more slowly than volume. A crowded strike can be a hedge, a spread, or a directional bet. Read the chain next to the tape to see who is printing.
On EZPZ, Option Chain is that book for one ticker. The live page is titled Options Chain. Search a symbol, pick an expiration, then read calls and puts around ATM. Live Flow is the tape of prints. Unusual Activity keeps only large, sweep, and block prints. Unusual Activity Intraday is the session scan with a date range. $1M Plus Flow keeps only million-dollar premium. 0DTE Flow keeps only prints that expire today. SPX and SPY Flow locks the tape to SPX, SPXW, and SPY.
How Option Chain works on EZPZ
Each row is one strike for the expiration you picked: calls on the left, puts on the right, STRIKE in the middle. It is not a score. Most people start with ATM, LAST, VOLUME, and OI. If a strike looks busy, read DELTA, IV, and the GEX or DEX columns next. When the table is too wide, use Columns. When it is too long, tighten Strikes.
How this differs from Live Flow
Live Flow is every matching print. This page is the listed contracts for one ticker and one expiration. Use Live Flow to see who printed. Use this page to see the strikes those prints sit on. Use Unusual Activity when you only want Large, Sweep, and Block. Use Unusual Activity Intraday when you want a date window on those same kinds of rows. Use $1M Plus Flow when you only want million-dollar premium. Use 0DTE Flow when you only want prints that expire today. Use SPX and SPY Flow when you only care about S&P 500 positioning.
During hours and after the close
During regular hours you get the live chain. Quotes, volume, and the metrics panels can move with the session. After the close you still get the same layout from the end-of-day chain: the same toolbar, the same Calls and Puts table, and the same metrics. The job does not change. You are still reading listed strikes around ATM, not a tape of prints.
Anatomy of a strike
Read a row toward the middle. Calls are on the left. Puts are on the right. STRIKE is the hinge. You do not need every column on every strike. Use the tabs if you want a map of the fields.
These columns sit on the left of STRIKE. They describe the call at that strike.
| Column | What you are looking at |
|---|---|
| LAST VOLUME OI | Last price, session volume, and open interest on the call. |
| IV DELTA | Implied volatility and delta on the call. Green DELTA cells are the OTM call highlights from Reference. |
| GAMMA THETA VEGA | The rest of the greeks. VEGA starts off in Columns. |
| CUM. $GEX CUM. $DEX | Cumulative exposure on the call side. Green rows are the support highlights. |
| SIZE BID-ASK HIGH LOW | Quote and range fields. They start off in Columns. |
The middle of the row is the contract you are actually looking at.
| Column | What you are looking at |
|---|---|
| STRIKE | The strike price. The ATM row is marked ATM. That is the strike closest to the last price. |
| Avg Fill | Green on the call side, red on the put side. Click it to open the fill chart for that strike. |
These columns sit on the right of STRIKE. They describe the put at that strike.
| Column | What you are looking at |
|---|---|
| VOLUME OI LAST | Session volume, open interest, and last price on the put. |
| IV DELTA | Implied volatility and delta on the put. Red DELTA cells are the OTM put highlights from Reference. |
| NET $DEX NET $GEX | Net exposure on the put side. Red rows are the resistance highlights. |
| THETA GAMMA | Time decay and gamma on the put. |
Metrics, legend, and Reference
Below the table, four panels summarize the expiration you picked: Implied Volatility, IVx Expected Move, Demand Expected Move, and Greeks & Skew. Metrics Glossary opens the same labels in a modal. Legend & Definitions sits under the panels. Reference in the toolbar repeats the delta highlights, color coding, and GEX and DEX notes.


Panels
- Implied Volatility: Call IVx, Put IVx, IVx Skew, IVx Composite.
- IVx Expected Move: Call VEM, Put VEM, VEM Imbalance, Expected Move.
- Demand Expected Move: Call DEM, Put DEM, DEM Imbalance, Expected Move.
- Greeks & Skew: Delta Skew, Delta Skew (Wtd), Gamma Imbalance, Gamma Imb. (Wtd).
Legend
- OTM Call / OTM Put: Green or red delta cells around 30-40% ITM probability.
- Theta Strike: Orange delta cells around 0.15-0.21.
- Support / Resistance: Cumulative GEX and DEX highlights. SD1 and SD2 are the expected-move bands on the fill chart.
Toolbar
The toolbar is how you change the book, not how you score it.
- Symbol... / Go: Load another underlying. The ticker badge and last price sit above the table.
- Expiration: One listed expiration at a time.
- Strikes: ±10, ±20, ±50, or All around ATM. ±10 is the usual start.
- SD Lines: DEM, VEM, and VWAP overlays on the Avg Fill chart. VEM starts checked.
- Columns: Size & Pricing (SIZE, BID-ASK, LAST, HIGH, LOW), Volatility & Greeks (IV, VEGA, GAMMA, THETA), Exposure (GEX / DEX) with $GEX, CUM. $GEX & NET, $DEX, and CUM. $DEX & NET. LAST, IV, GAMMA, THETA, and the cumulative columns start on.
- Reference and Tutorial: The color-coding modal, and the Option Chain Video Tutorial.
How people actually use it
Pick one expiration
Search the ticker. Leave Strikes on ±10. Start at ATM. You are mapping the book, not scanning every listed week.
Sit with one strike
Read LAST, VOLUME, OI, and DELTA on both the call and the put. Click Avg Fill if you want the fill chart. Turn on VEM, DEM, or VWAP from SD Lines.
Watch GEX and DEX levels
Leave CUM. $GEX & NET on. Green and red rows are the page's support and resistance highlights. Open Reference if you forget the colors.
Use it next to the tape
This page is the book. Open Live Flow if a strike makes you want the prints. Open Unusual Activity if you only want the standouts.