
Learn Center
Short Volume
The share of a stock's daily trading volume executed as short sales, reported separately from official short interest.
What is daily short volume percent?
Daily short volume percent is short sales as a share of that day's total volume. On EZPZ it is the Short Volume table. High Short Sale Volume starts on. Each row is one Ticker with Date, Short Volume, Total Volume, and Percent. It is a daily tape share, not official short interest.
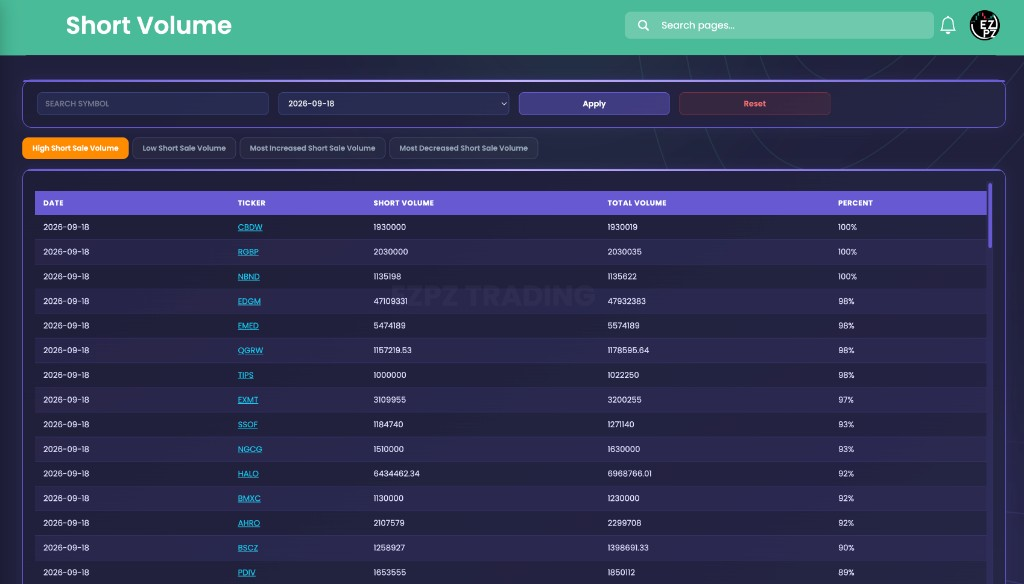
Percent is Short Volume versus Total Volume for that Date, printed as a whole percent. High Short Sale Volume puts the largest Percent at the top. Low Short Sale Volume flips that order. Most Increased Short Sale Volume and Most Decreased Short Sale Volume add Percent Change versus the prior date in the list. Search Symbol, the date dropdown, Apply, and Reset sit on the first row. Changing the date reloads. Apply is for Search Symbol. Reset clears Search Symbol and returns the first date. Click a Ticker to open that name's Short Volume Trends chart. The screenshot is High Short Sale Volume on 2026-09-18. CBDW, RGBP, and NRND print 100%. EDGM prints 47,109,331 Short Volume against 47,932,383 Total Volume at 98%. HALO prints 6,434,482.34 Short Volume at 92%. PDIV sits at 89%. A 100% Percent row is almost all of that day's printed volume tagged as a short sale. It still includes market making and hedges, not only a directional bet. None of those cells is a fill.
On EZPZ, the live page title is Short Volume. Search Symbol, the date dropdown, Apply, and Reset sit on the first row. High Short Sale Volume starts orange. Low Short Sale Volume, Most Increased Short Sale Volume, and Most Decreased Short Sale Volume sit next to it. Click a Ticker to open Short Volume Trends. Short Interest is the one-ticker official snapshot after you already picked a name. Short Interest Leaderboard ranks many names from Official Short Interest %. ShortEx is the squeeze focused rank that blends short interest with days to cover and short volume. Short Volume Trends charts this daily Percent over time. Exchange Volume Leaderboard ranks off-exchange share of volume, not short sales. Exchange Volume is the venue mix for one ticker. Gamma Short Squeeze is Squeeze Score(%) next to Gamma Pressure and Short Interest(%). Ticker Explorer is the one-symbol dashboard after you already picked a name.
How Short Volume works on EZPZ
Start on High Short Sale Volume, then read Short Volume against Total Volume and Percent on the same row. It is not a score you trade. Type a ticker in Search Symbol and click Apply when you already have a name. Change the date when you want a prior session. Open Most Increased Short Sale Volume when you want Percent Change instead of the largest Percent. Reset clears Search Symbol and returns the first date. Do not treat CBDW as a default thesis.
How this differs from Short Interest and ShortEx
Short Interest is one ticker you already have in mind. This page ranks many names for one Date. Use Short Interest when you want Official Short Interest (% Float) and Historical Data. Use this page when you want daily Short Volume versus Total Volume. Short Interest Leaderboard ranks Official Short Interest %. Its sliders start at Official Short Interest Above 8%, Market Cap Above 5M, and Average Volume Above 1M. This table has none of those sliders. Use the leaderboard when you want the official percent board. Use this page when you want High Short Sale Volume Percent. ShortEx is a squeeze screen that combines short interest with days to cover and short volume. This table does not print Short Score. Use ShortEx when you want that combined rank. Use this page when you want Percent for one Date. Short Volume Trends is that series over time after you click a Ticker. Exchange Volume Leaderboard ranks off-exchange share of volume. Exchange Volume is venue mix for one ticker. Gamma Short Squeeze is Squeeze Score(%) next to Gamma Pressure. Use that page when you want options gamma on the same row as Short Interest(%). Use this page when you want Date, Ticker, Short Volume, Total Volume, and Percent. Use Ticker Explorer after you already picked a symbol.
Search Symbol, date, Apply, and Reset
Search Symbol, the date dropdown, Apply, and Reset sit on the filter card. Search Symbol needs Apply. Changing the date reloads the table. Reset clears Search Symbol, returns the first date, and reloads page 1.
| Control | What it does |
|---|---|
| Search Symbol | Jump to one ticker. The field is uppercase. Click Apply after you type it. |
| date dropdown | The unlabeled date list next to Search Symbol. The screenshot is on 2026-09-18. Changing it reloads the active tab. |
| Apply | Loads Search Symbol and the selected date on page 1. |
| Reset | Clears Search Symbol, returns the first date, and reloads page 1. |
Volume tabs
The orange tab is the current list. High Short Sale Volume starts on. The screenshot has that tab orange. Low Short Sale Volume keeps Date, Ticker, Short Volume, Total Volume, and Percent. Most Increased Short Sale Volume and Most Decreased Short Sale Volume add Percent Change. Clicking a tab starts again on page 1.
| Tab | What sits at the top |
|---|---|
| High Short Sale Volume | Largest Percent for that Date. This is the starting tab. The screenshot ranks CBDW, RGBP, and NRND at 100%. |
| Low Short Sale Volume | Smallest Percent for that Date. The columns stay the same. |
| Most Increased Short Sale Volume | Largest rise in Percent versus the prior date. Percent Change shows on the row. |
| Most Decreased Short Sale Volume | Largest drop in Percent versus the prior date. Percent Change shows on the row. |
Anatomy of a Short Volume row
Read a row left to right: Date, then Ticker, then Short Volume against Total Volume, then Percent. You do not need Percent Change until the increased or decreased tab is on. The screenshot starts at 2026-09-18 with CBDW at 1,930,000 Short Volume, 1,930,019 Total Volume, and 100%.
These columns answer how much of that Date's volume printed as a short sale.
| Column | What you are looking at |
|---|---|
| Date | The session for that row. The screenshot prints 2026-09-18 on every visible row. |
| Ticker | The symbol. Click it to open that name's Short Volume Trends chart. |
| Short Volume | Share size tagged as a short sale. The screenshot prints 1,930,000 on CBDW and 47,109,331 on EDGM. |
| Total Volume | That day's broader volume on the name. The screenshot prints 1,930,019 on CBDW and 47,932,383 on EDGM. |
| Percent | Short Volume as a share of Total Volume. The screenshot prints 100% on CBDW, 98% on EDGM, and 89% on PDIV. |
This column only shows on Most Increased Short Sale Volume and Most Decreased Short Sale Volume.
| Column | What you are looking at |
|---|---|
| Percent Change | How Percent moved versus the prior date in the list. It stays hidden on High Short Sale Volume and Low Short Sale Volume. |
How people actually use it
Start on High Short Sale Volume
Leave the orange tab first. Then read Short Volume against Total Volume. On 2026-09-18 that puts CBDW at 100% and EDGM at 98% with a much larger Total Volume.
Switch to change when one Date is noisy
Most Increased Short Sale Volume and Most Decreased Short Sale Volume add Percent Change. Use those tabs when you want a move versus the prior date, not the largest Percent alone.
Open the trend from Ticker
Click a Ticker to open Short Volume Trends. Use this table for one Date. Use the chart when you want that Percent over time.
Pair it with the official snapshot
Use Short Interest or Short Interest Leaderboard when you want Official Short Interest %. Use ShortEx or Gamma Short Squeeze when you want a squeeze rank instead of this daily Percent.