
Learn Center
Market News
A newest-first list of general financial headlines with category, local time, publisher, summary, and a link to the full story.
What is the Market News page?
Market News is a running list of general financial headlines that are not tied to any one stock. Each row gives you a category, the time, the headline, a source logo, the publisher name, a short summary, and a link to the full story. On EZPZ the list is one table, newest first, that you can search and page through.
Use it to see what is being reported across the market right now, before you look at a single ticker. The page does not write the stories. It lists what news publishers put out and sends you to their article. That means a headline here is a pointer, not a conclusion. The wording comes from the publisher, headlines can be updated or corrected after they first appear, and a story that reads important may or may not move prices. Read the full article before you act on anything, and check the price and options data for the names you care about. For headlines about one company instead of the whole market, use Company News.
How the Market News page works on EZPZ
The page has no ticker box and no filters. It loads the general news list once when you open it and shows a spinner while it fetches. It does not refresh by itself, so reload the page to pull newer stories. The table shows 15 rows at a time and has no rows-per-page menu, so use the page controls under the table to reach older headlines.
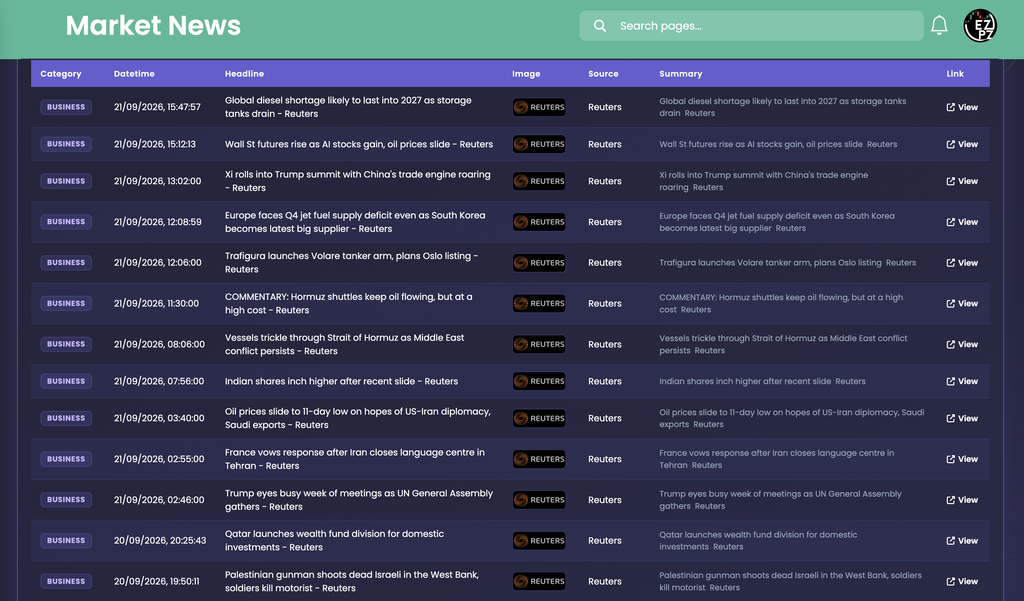
The columns
| Column | What you are looking at |
|---|---|
| Category | A purple badge with the category supplied with the story. Every row in the capture reads BUSINESS. A row with no category shows a dash. |
| Datetime | When the story was published, converted to your browser's time zone and date format. The table opens sorted by this column, newest first. |
| Headline | The publisher's headline, wrapped over two lines when long. Many headlines end with the publisher name, as in "- Reuters". |
| Image | A small thumbnail supplied with the story. In the capture every thumbnail is the publisher's logo, not a photo from the article. This is the only column you cannot sort. |
| Source | The name of the publisher. |
| Summary | The short summary text supplied with the story, in smaller grey type. |
| Link | A View link that opens the full article on the publisher's site in a new tab. |
Click a column heading to sort by it. A search box above the table filters the rows as you type, and it looks at the text in every column, so you can type a word such as a company, a place, or a publisher name to narrow the list. It is not shown in the capture above.
Reading the capture
The capture shows 13 rows: eleven from 21/09/2026, from 15:47:57 back to 02:46:00, and two from 20/09/2026. All are Reuters, all are categorised BUSINESS, and the list is dominated by one theme. Five of the 13 headlines name oil, diesel or jet fuel, and the Strait of Hormuz appears in two of them. A run like that tells you what the news flow is about right now. It does not tell you what any price will do.
Three rows show different kinds of story. "Wall St futures rise as AI stocks gain, oil prices slide" is a market-wide headline that touches two themes at once. "COMMENTARY: Hormuz shuttles keep oil flowing, but at a high cost" carries a COMMENTARY prefix, which marks opinion or analysis rather than a straight report. "Indian shares inch higher after recent slide" is a foreign-market story that may or may not matter to a US trader.
Notice the Summary column. On every row in the capture the summary is the headline again with the publisher name on the end, so it adds nothing beyond the headline. If a row looks interesting, click View to get the real detail.
How to scan the list
- Start at the top. The newest rows are the ones that just broke. Check the Datetime to see how old the top row is, and reload if it looks stale.
- Look for a theme. When several headlines repeat the same subject, as oil does in the capture, that subject is driving the conversation.
- Search for what you hold. Type a sector word, a country, or a company name into the search box to pull related headlines out of the list.
- Separate news from opinion. Prefixes such as COMMENTARY signal a different kind of story. Weigh them differently.
- Open the article. Use View for anything you might act on. The headline and the summary on this page are only a preview.
How Market News differs from nearby Investing pages
This page answers "what is the market reading about right now?" The other Investing pages narrow the question. Company News filters headlines to one ticker. Social Sentiment measures how the retail crowd is talking about a stock instead of what publishers report. Recommendation Trends counts analyst ratings by month, and Upgrade and Downgrade logs each firm's rating change with the date. Price Target shows the levels analysts expect, and Earnings Surprises covers reported results against estimates, which are often what a headline is about. Ticker Performance shows what a price actually did, so you can set a headline beside the move it may have caused. Support and Resistance marks price levels where a stock has stalled before, and Congressional Trading lists stock trades that members of Congress have disclosed. Company Profile tells you what a business in a headline does. Sector Metrics compares a company with its sector medians, useful when a headline hits a whole industry. Financial Statements shows the reported revenue, profit, debt and cash behind a company in a headline. For the standard fundamental ratios behind the company, Basic Financials groups valuation, profitability, growth, debt, and dividends for one ticker. Historical Market Cap charts a company's total value across a date range, a way to see how far a headline moved the whole company. Dividends lists a company's payments and dates, the record behind a headline about a raise or a cut. Analyst Estimates shows the forecasts a headline about guidance or a report gets measured against.
Outside this category, Ticker Explorer is the one-symbol dashboard for checking live price and options context on a name a headline mentions.
What to check before you rely on it
- The timestamp. The page loads once, so the top row is only as new as your last load. Reload before a decision.
- The source. The Source column tells you who reported the story. Stories are as reliable as the publisher and can change after posting.
- The summary. It can simply repeat the headline, so do not treat it as a fact check.
- The time zone. Datetime follows your browser, so the hour you see is your local hour, not New York time.
- The price. A headline is only useful if it changes something. Compare it with what the stock or index did after it printed.
Who uses market news
Pre-market checkers
Skim the overnight and early headlines to see what is setting the tone before the open.
Position holders
Search the list for a sector, country, or company name tied to an open trade.
Theme spotters
Notice when one subject, like energy, repeats across headlines, then check the related tickers.
Event watchers
Reload around big scheduled releases to see how publishers are framing the news as it lands.