
Learn Center
Trader's FieldMap
A one-ticker support and resistance ladder you can copy into TradingView as EZPZ FieldMap Levels.
What is Trader's FieldMap?
Trader's FieldMap is a one-ticker support and resistance ladder. Each row is a price, with labels stacked from the toggles you leave on. Current Price sits on a gold row between resistance above and support below. It is a map of levels, not a new score.
Traders use FieldMap to put several kinds of levels on one scroll: daily pivots, session highs and lows, Fibonacci retracements, VWAP across Daily, Weekly, and Monthly, moving averages, dark pool prints, and options walls from DEX and GEX. Nearby prices can share a row when Proximity % (Merge) groups them. The right column, Key Turning Points, names those stacked labels. Records caps how many rows stay on the ladder. Below the table, TradingView Resistance Output and TradingView Support Output are preformatted strings. Copy them, open EZPZ FieldMap Levels on TradingView, and paste. That script does not invent levels. It only draws what you paste, including single prices, ranges, optional labels, and a major versus minor mark if you set one in the indicator. A crowded row is still overlapping labels. It is not a trade.
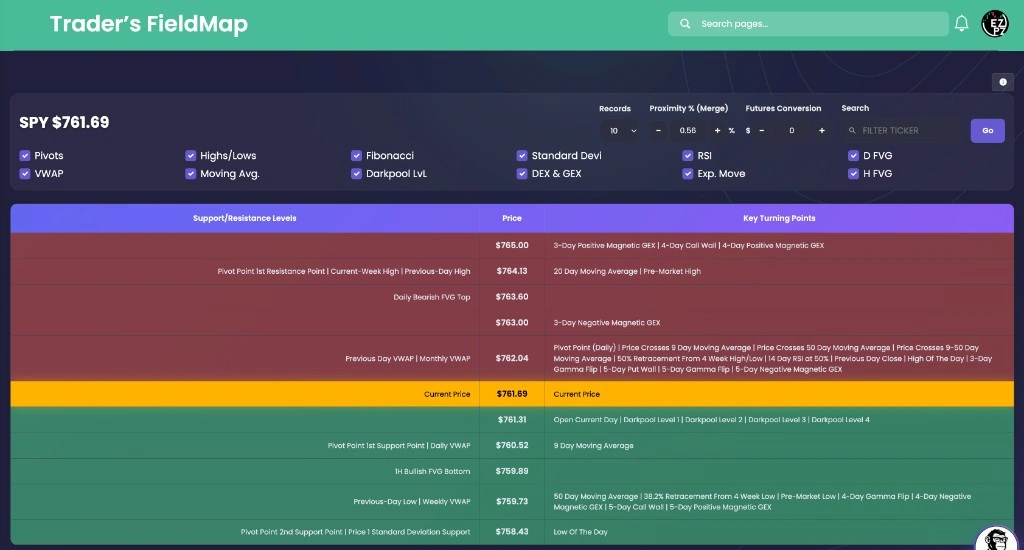
On EZPZ, the live page title is Trader's FieldMap. Search placeholder is Filter ticker. Go loads the name. Records starts at 30. Choices are 10, 20, 30, 40, 50, and All. Proximity % (Merge) starts at 0.01. Futures Conversion starts at $0. Toggles that start on are Pivots, Highs/Lows, Fibonacci, VWAP, Moving Avg., Darkpool LvL, and DEX & GEX. Toggles that start off are Standard Devi, RSI, Exp. Move, D FVG, and H FVG. The screenshot uses SPY at $761.69 with Records on 10, Proximity % (Merge) on 0.56, and every toggle on. The table headers are Support/Resistance Levels, Price, and Key Turning Points. AiPe in the corner is labeled FieldMap Analyst. EZPZ Trade Alerts is the notable-event feed, not this ladder. EZPZ TradingView Indicators is the catalog of Pine scripts. This page is the source of the paste strings for EZPZ FieldMap Levels. GEX and DEX is the Intraday GEX and DEX chart pair with Gamma Flip. Gamma Exposure is the strike table with Call Wall and Put Wall. Expected Move is DEM and VEM bands by expiration. Contract Prices (XVWAP) is XVWAP on one listed option, not stock VWAP on this ladder. Ticker Explorer is the one-symbol dashboard.
How Trader's FieldMap works on EZPZ
Type a ticker in Filter ticker, press Go, then start at Current Price. It is not a score. Most people read the gold row, then the nearest resistance above and the nearest support below. If a Price cell stacks too many names, raise Proximity % (Merge) so nearby labels share a row, or turn off a toggle you do not need. When you want those same prices on a chart, Copy TradingView Resistance Output and TradingView Support Output, then paste into EZPZ FieldMap Levels. Do not treat SPY as a default thesis.
How this differs from Trade Alerts and GEX tools
EZPZ Trade Alerts is a feed of notable events. This page is one ticker's price ladder. Gamma Exposure is a strike table with Call Wall, Put Wall, Spot Price, and expected-move badges. FieldMap can include DEX & GEX labels on a price row, but it is not that wall map. GEX and DEX is Intraday GEX and DEX with Gamma Flip. Use that page when you want the chart pair. Use this page when you want those walls next to pivots, VWAP, and Darkpool LvL at the same price. Expected Move is DEM versus VEM by expiration. Exp. Move here is one toggle on the ladder. Contract Prices (XVWAP) charts one option versus XVWAP. VWAP on FieldMap is Daily VWAP, Previous Day VWAP, Weekly VWAP, and Monthly VWAP on the stock. EZPZ TradingView Indicators lists scripts. EZPZ FieldMap Levels is the overlay that draws the strings this page Copy buttons produce. Ticker Explorer is the one-symbol briefing with quote, PCR, and unusual activity.
Anatomy of a FieldMap row
Read a row left to right: the stacked names, the price, then Key Turning Points. You do not need every toggle on every session. Use the tabs if you want a map of the fields.
The three headers never change. Color tells you which side of last price you are on.
| Column | What you are looking at |
|---|---|
| Support/Resistance Levels | Names stacked at that price. Pipe characters join labels that share the row. |
| Price | The level. Rows above Current Price are resistance. Rows below it are support. |
| Key Turning Points | The same stack, written for scanning. On the screenshot, $765.00 lists 3-Day Positive Magnetic GEX, 4-Day Call Wall, and 4-Day Positive Magnetic GEX together. |
| Current Price | The gold row. Last price for the ticker you loaded. The screenshot prints $761.69 on SPY. |
The checkboxes pick which frameworks can write labels. They live in the filter panel, not as a published crop.
| Toggle | What you are looking at |
|---|---|
| Pivots | Starts on. Pivot Point (Daily), Pivot Point 1st Resistance Point, Pivot Point 1st Support Point, and the 2nd and 3rd support and resistance points. |
| Highs/Lows | Starts on. Current-Week High, Previous-Day High, High Of The Day, Low Of The Day, Open Current Day, Pre-Market High, Pre-Market Low, and the week, month, and 52-week extremes. |
| Fibonacci | Starts on. 38.2%, 50%, and 61.8% retracements from 4 week, 13 week, and 52 week highs and lows. |
| VWAP | Starts on. Daily VWAP, Previous Day VWAP, Weekly VWAP, Monthly VWAP. |
| Moving Avg. | Starts on. 9 Day, 20 Day, 50 Day, 100 Day, and 200 Day Moving Average, plus Golden Cross, Death Cross, and price-cross labels. |
| Darkpool LvL | Starts on. Darkpool Level 1 through Darkpool Level 4. |
| DEX & GEX | Starts on. Options labels such as Call Wall, Put Wall, Gamma Flip, and Magnetic GEX on the price that matches. |
| Standard Devi RSI Exp. Move D FVG H FVG | Start off. Standard Devi is 1, 2, and 3 standard deviation support and resistance. RSI is 14 Day RSI at 80%, 70%, 50%, 30%, and 20%. Exp. Move adds expected-move prices. D FVG is Daily FVG+ / Daily FVG- and Daily Bullish / Bearish FVG Top and Bottom. H FVG is the same idea on 1H. |
These sit beside the ticker title. They are not a screenshot strip.
| Control | What you are looking at |
|---|---|
| Records | How many rows to keep. Starts at 30. Choices are 10, 20, 30, 40, 50, All. The screenshot uses 10. |
| Proximity % (Merge) | Starts at 0.01. Plus and minus step the value. Nearby prices share a row when they fall inside this percent. The screenshot uses 0.56. |
| Futures Conversion | Dollar offset. Starts at 0. Use it when you want the ladder shifted for a futures chart. |
| Filter ticker Go | Search box and load button. Type a symbol, then Go. |
Copy levels into TradingView
Under the table, TradingView Resistance Output and TradingView Support Output fill as you change toggles and Records. Each box has Copy. Tradingview connector (FieldMap Indicator) opens the invite-only EZPZ FieldMap Levels script on TradingView. Paste the resistance string and the support string into that indicator's settings. Levels may be single prices or ranges, and each one can carry the label from FieldMap. The overlay can mark a level as major, restyle lines, and recolor relative to last price. It does not calculate a new FieldMap. If the website output changes, copy again.

How people actually use it
Start at last price
Load the ticker you already trade. Read Current Price, then the first resistance and first support. Ignore far rows until those two matter.
Cut the stack
Leave Pivots, VWAP, and DEX & GEX on if that is your session. Turn Fibonacci or Moving Avg. off when the Key Turning Points cell gets long.
Move the ladder to the chart
Copy both TradingView outputs. Open EZPZ FieldMap Levels. Paste. Confirm Daily VWAP and Darkpool Level labels match the table before you draw anything else.
Follow one label to its page
If a row is all GEX, open Gamma Exposure or GEX and DEX. If it is expected move, open Expected Move. FieldMap is the index, not the deep chart.