
Learn Center
Top Money Flow
A ranked table of the stocks with the most dollars traded today, with price change and dark pool share beside each name.
How do you read dollar volume on a stock money flow leaderboard?
Dollar volume is the total money that changed hands in a stock today: last price times shares traded. A $200 stock trading 50M shares moves far more money than a $2 stock trading 100M shares. Ranking by dollars instead of shares shows where the most capital is actually moving.
Share volume alone flatters cheap stocks, because a low priced name needs a huge share count to look active while a high priced name moves serious money on far fewer shares. Money Flow Leaders fixes that by sorting on Volume * Price, so the top rows are the names with the most dollars traded today. It still does not show direction. A stock can sit at the top because buyers are lifting it or because sellers are dumping it, so read Total Change (%) beside the dollars. It also says nothing about who traded, which is why the page adds Dark Pool Volume and DarkVol Ratio %, the share of the day's volume that printed off exchange. On EZPZ the whole page is one table: Volume * Price as the sort, price and change columns for direction, and the dark pool pair for venue. Use Volume Leaderboard when you want volume compared with each stock's own normal instead of measured in dollars.
How Money Flow Leaders works on EZPZ
The page is titled Money Flow Leaders. It is a single table sorted by Volume * Price from highest to lowest, and a small arrow on that header marks the active sort. Rows keep updating while the market is open. The list is capped at 100 names, so it is a leaderboard, not a full market scan. There are no stat cards and no filter row. The Info button at the top right is the only control outside the table.
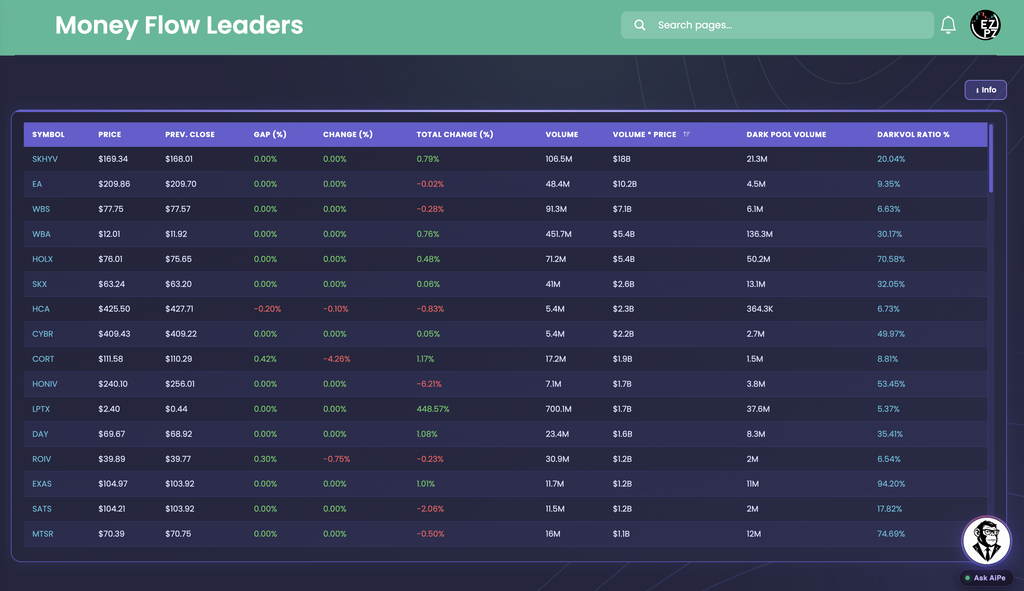
The screenshot shows why dollars change the ranking. SKYHV sits first with 106.5M shares at $169.34, so Volume * Price prints $18B, and its Total Change (%) is 0.79%. EA is second with 48.4M shares at $209.86 for $10.2B. That is fewer than half of SKYHV's shares and still the second biggest dollar total. The clearest contrast is further down. WBA traded 451.7M shares at $12.01 and HOLX traded 71.2M shares at $76.01, and both print $5.4B. WBA's DarkVol Ratio % is 30.17% and HOLX's is 70.58%, so the same dollars traded very differently by venue. LPTX shows 700.1M shares, the most shares in view, but at $2.40 that is only $1.7B, so it sits eleventh. In this capture Gap (%) and Change (%) read 0.00% on most rows while Total Change (%) still shows the move, so lean on Total Change (%) for direction.
How Money Flow Leaders differs from the rest of stocks-analytics
Money Flow Leaders ranks by how many dollars traded today. Volume Surge Trades is a flow page that shows S&P 500 buy versus sell dollars by sector and stock. Market Price Action Trend is the price trend chart. Seasonal Returns looks at calendar patterns. Intraday Regime Leaderboard, Swing Regime Leaderboard, and Investing Regime Leaderboard score a regime or setup over three time horizons, which this page does not. Technical Analysis and Top-50 Aggregate Technicals are indicator pages. Predictive CandleScope is a forecast view. Here there is no score and no forecast, just dollars traded, price change, and dark pool share.
A few neighbors in other categories answer nearby questions. Volume Leaderboard ranks share volume and adds Rel Vol./30D. Market Dashboard is the one-screen overview of the whole tape. Top Gainers and Losers ranks by percent change. DarkVol Leaders is the dedicated rank for off-exchange volume. When a name stands out, Ticker Explorer is the one-symbol dashboard.
Reading the columns
Read a row left to right: what the stock costs and how it moved, how much traded and in dollars, then where it traded.
| Column | What you are looking at |
|---|---|
| Symbol Price | The ticker and its current price. |
| Prev. Close | The prior session's closing price. |
| Gap (%) | The jump from the prior close to today's open. Green is up or flat, red is down. |
| Change (%) | The move during regular trading hours, from the open to now. |
| Total Change (%) | The move from the prior close to now, including the gap. |
| Column | What you are looking at |
|---|---|
| Volume | Shares traded today, shown short (K, M, B). |
| Volume * Price | Total dollars traded today. This is the default sort, and the header carries the sort arrow. |
| Column | What you are looking at |
|---|---|
| Dark Pool Volume | Shares that traded on dark, off-exchange venues today. |
| DarkVol Ratio % | Dark Pool Volume as a percent of Volume. Higher means more of the day traded off the public order book. |
Working the table
- Default order: Volume * Price, high to low. Click any column header to sort by that column instead.
- Scrolling: the table scrolls inside its card with the header row pinned, and there are no pages.
- Info button: opens the Money Flow Leaders reference guide, with a short What is it? and a list of how traders use the table.
- Refresh: rows update on their own while the market is open, so you do not need to reload.
How people actually use it
Find where the capital is
The top of the table is the short list of names moving the most money today. It is a fast way to see which stocks matter to the tape before you dig into any one of them.
Pair dollars with direction
Heavy dollars with a rising Total Change (%) reads as buying pressure. Heavy dollars with a falling Total Change (%) reads as selling pressure. Neither is a promise about the next move.
Spot the dollar-versus-share gap
Compare Volume with Volume * Price. A stock high on shares but low on dollars is a cheap name, and the dollar rank keeps it from crowding out bigger money elsewhere.
Check the venue
Two rows with the same dollar total can trade very differently. A DarkVol Ratio % well above the rest of the list means more of that volume printed off exchange.